Testing wine bottles
Combining UV and EDX – Non-destructive quality control, fast and simple screening method
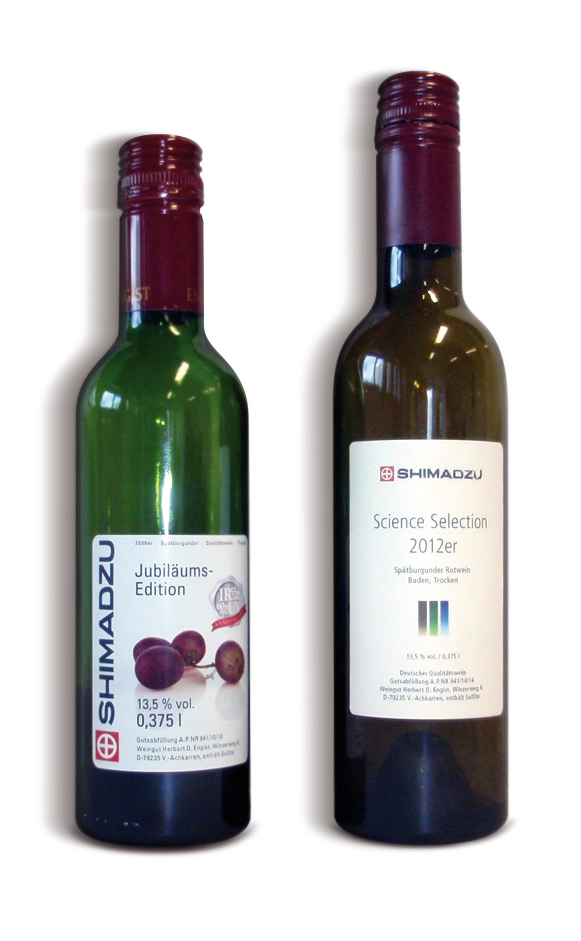 Figure 1: Two wine bottles of different glass color were of interest. The green bottle on the left is referred to as an old wine bottle and the green-blue bottle on the right as a new wine bottle.
Some beverages are sensitive to light and can lose color and vitamins. This is why they are distributed in colored glass bottles to protect them from the influence of light. The color and shape of bottles are often part of the sales strategy to attract the attention of buyers. As the production of glass bottles requires much energy, recycling of glass is worthwhile. In Germany, recycling is promoted via the ‘Green Dot’ system. Used glass bottles are collected in separate containers for white, brown and green glass, and this multitude of colors is a challenge. How to handle blue glass or bottles that are neither brown nor green, but appear milky?
Colors are subjective, but they can also be characterized objectively using color tables. Spectroscopic methods such as UV-VIS spectroscopy can help. Depending on the desired quality of the end product, higher or lower percentages of recycled glass are being used in glass production. The base material silicon dioxide is mixed with coloring oxides. The oxides are used depending on the desired specifications (color) of the end product.
In white glass, for instance, iron oxide causes interference which makes the glass appear slightly green. If the color should be more intense, chromium oxide is added and the glass turns into more intense green. Brown glass contains manganese oxide and iron oxide. A variation of oxides results in different colors. To be able to limit the immense number of color shades, oxides of complementary colors are added to decolorize the glass.
It is therefore interesting to know the composition of the glass granulates before smelting and, with this knowledge, to add further oxides if necessary. A fast method to determine this composition is elemental analysis with an energy-dispersive X-ray fluorescence spectrometer (EDX). This technique enables direct non-destructive analysis of the material to determine its elemental composition. The technique provides information of the main elements and interfering elements in glass production.
While glass consists to a large extent of SiO2, it is also possible to determine iron (Fe), manganese (Mn) and chromium (Cr) in addition to the silicon (Si) signal. A traditional glass is made of lead crystal which contains lead oxides. The element lead (Pb) is also included in the analysis spectrum of the EDX systems and is in addition subject to the RoHS (Restriction of Hazardous Substances) directive.
The experiment presented here discusses the end product wine bottle. The intention is to analyze the bottle non-destructively. This is possible using UV-VIS spectroscopy as well as the EDX system. The sample compartments in both instrument classes are large enough to hold an entire bottle.
Measurement results using UV-VIS spectroscopy
There are different approaches for qualification in glass analysis. It is possible to perform a standardized color analysis for which specialized evaluation software is available, for instance Chroma (ILIS) or Color Lite (LabCognition). These color analysis software packages calculate standard color values from the given UV spectrum. These are objective color analysis methods.
Classical evaluation is performed on the spectrum itself. The nature of the oxides and their specific energy potentials yield characteristic UV-VIS spectra. These spectra work like fingerprints, even at high concentrations. Interpretation of the spectra enables classification of the elements that are involved in the coloration of the glass.
Another challenge is the shape of the material, for instance a bottle with thick walls. In the transmission and absorption method, two walls were illuminated. This inevitably leads to strong absorptions. In this analysis, another interfering material is present: the glass itself. It exhibits strong absorptions in the ultraviolet range, which affects the analysis of iron oxides. UV spectroscopic analysis focuses on the color of the solid. In this analysis, the sample material was not destroyed (Figure 2).
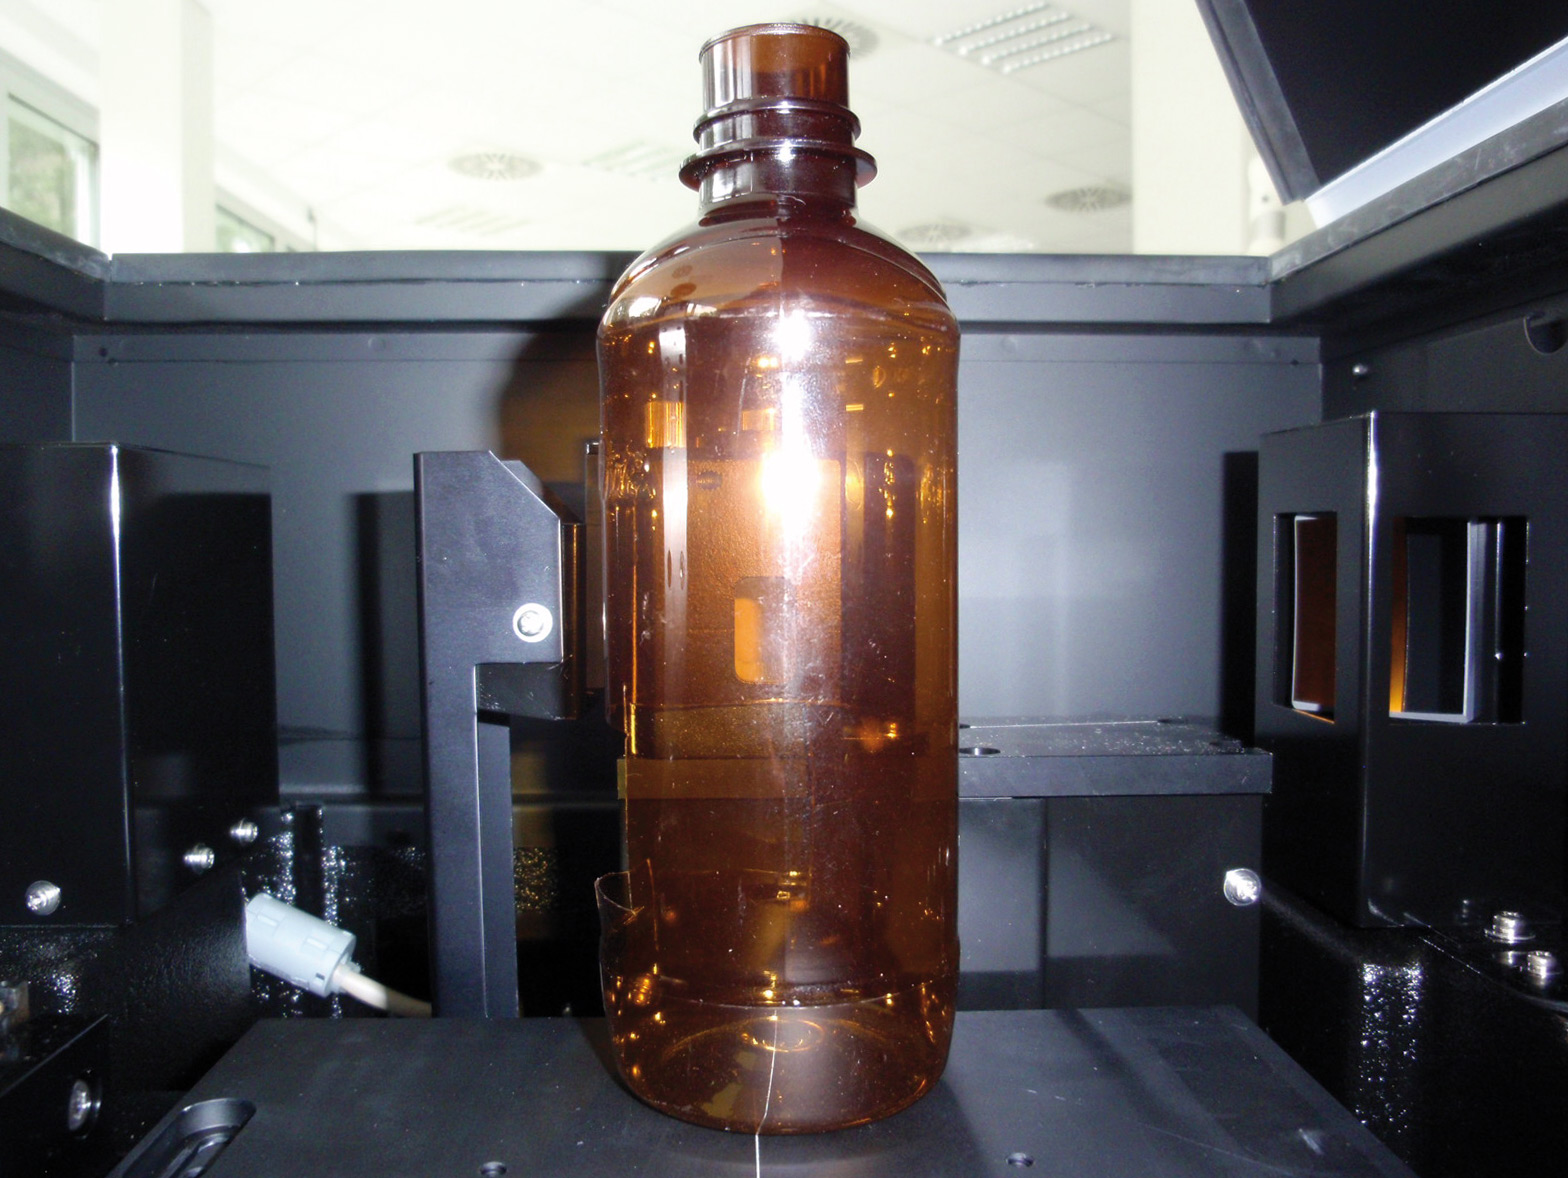 Figure 2: Bottle in the measurement position in front of an integrating sphere in the MPC-2600. The measuring window is 1 x 2.5 cm. The bottle can be positioned using the x-y-z table. The measuring window can be seen through this thin transparent bottle.
In addition to coloring materials, glass also contains other main materials that are required for the properties of the target application. In order to identify these elements, the non-destructive EDX measuring technique is recommended.
Figure 3 shows the absorption spectra of two wine bottles. The black line (bottom) represents the colors and components of the old bottle and the blue line (upper) those of the new bottle. In the spectra, the Fe2O3 range (400 – 450 nm) and the Cr2O3 range at 650 nm can be clearly recognized. A quantitative shift can be identified in the spectra. The black spectrum (bottom) shows that there is more Cr2O3 present, while in the blue spectrum the iron oxide region around 410 nm absorbs more strongly.
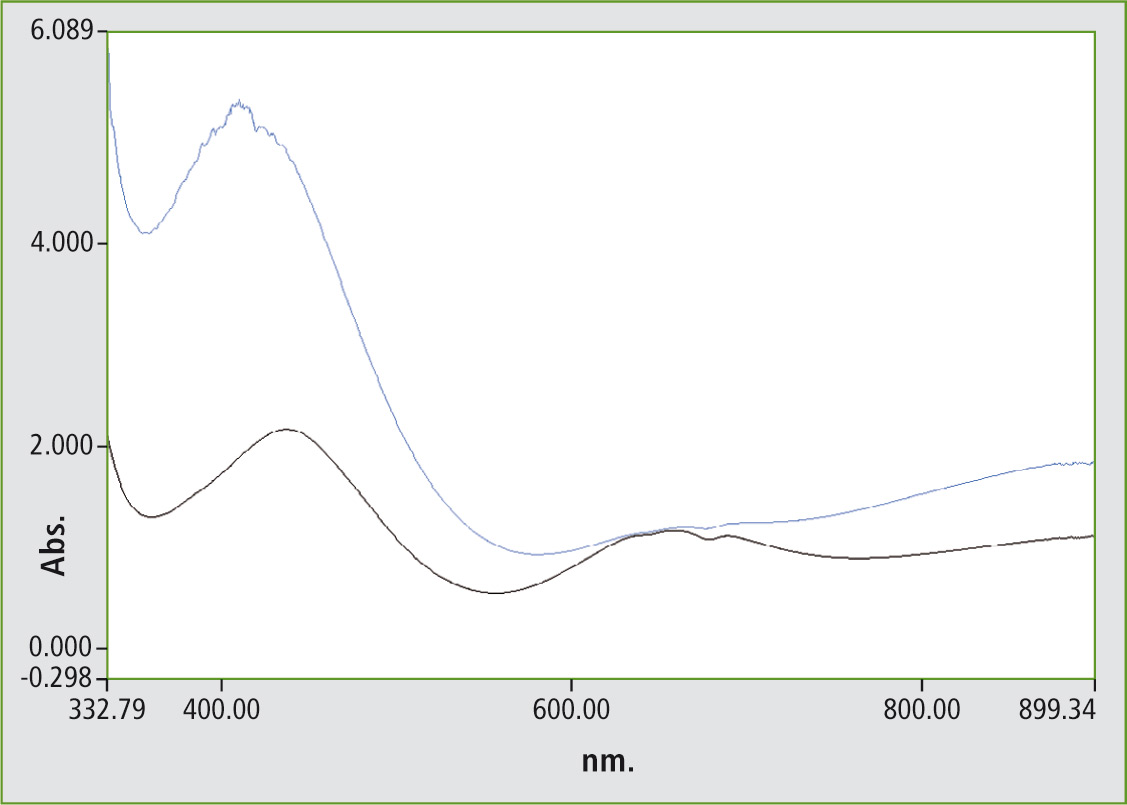 Figure 3: Absorption spectra of glass bottles in the visible spectral range of 310 to 890 nm
Using the second derivative, the oxide fine structure (Figure 4) can be made visible for these spectra that were measured with a resolution of 5 mm.
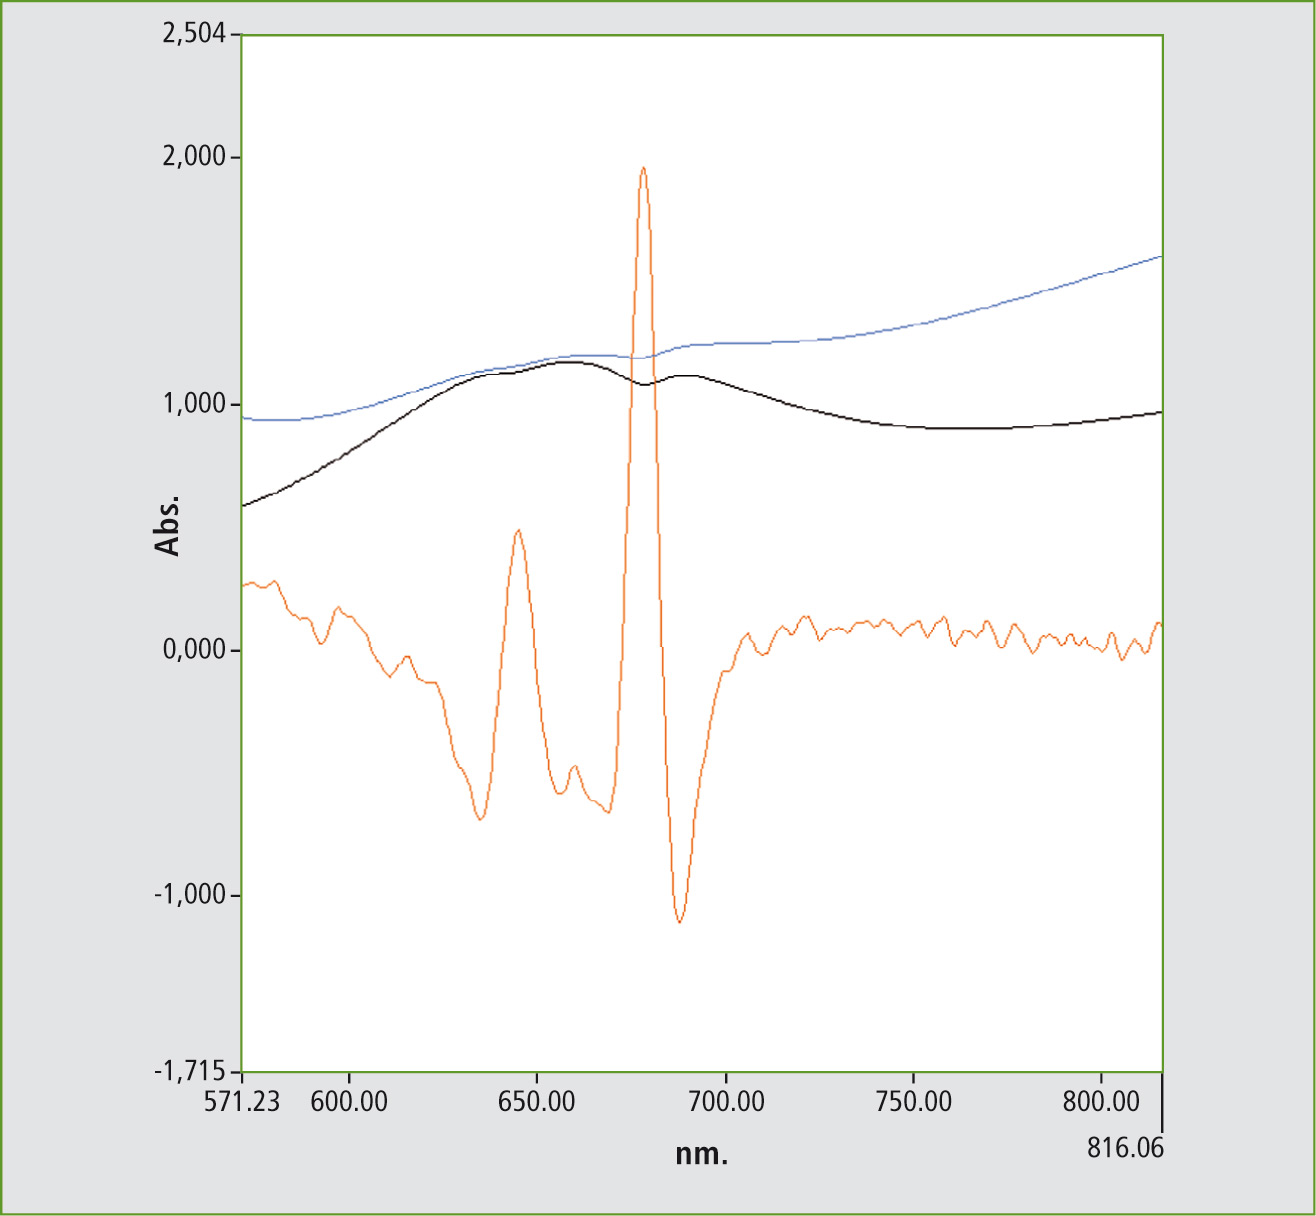 Figure 4: Using the second derivative of the spectrum of the old wine bottle, the energy bands belonging to Cr2O3 can be made visible according to the literature [2]
The increased iron oxide signals in the blue spectrum are a matter for discussion. In the literature, an increase of the signals by manganese oxide has been described [3]. This effect, and the reduction of the chromium oxide, causes the bottle color to change to brown.
Measurement results using the EDX technique
Using EDX, all elements involved in the composition of the glass can be identified, For the measurement, the bottle is placed on the measurement window. The high-energy radiation of the EDX penetrates the glass, and the elements react to the X-ray irradiation by emitting fluorescence radiation. This fluorescence radiation is detected, is element specific and can therefore be assigned to each element. Due to the presence of glass (SiO2), a high percentage is assigned to silicon oxide. Since the starting materials used in glass manufacture are silicon oxide and mixtures of other oxides, a range of elements can be expected. The analysis presented was carried out with the fundamental parameters. The observed surface is 1 cm in diameter. For analysis, the bottle is placed directly into the sample compartment.
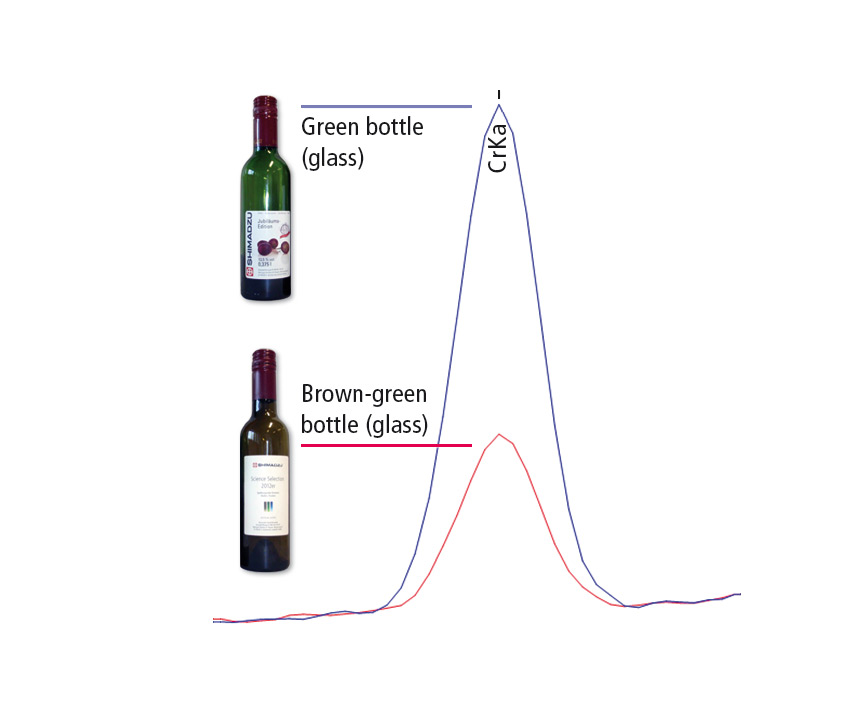 Figure 5: EDX measurement curves of a wine bottle, where blue represents the old wine bottle and red the new wine bottle. The green color of the old bottle is related to its higher Cr content.
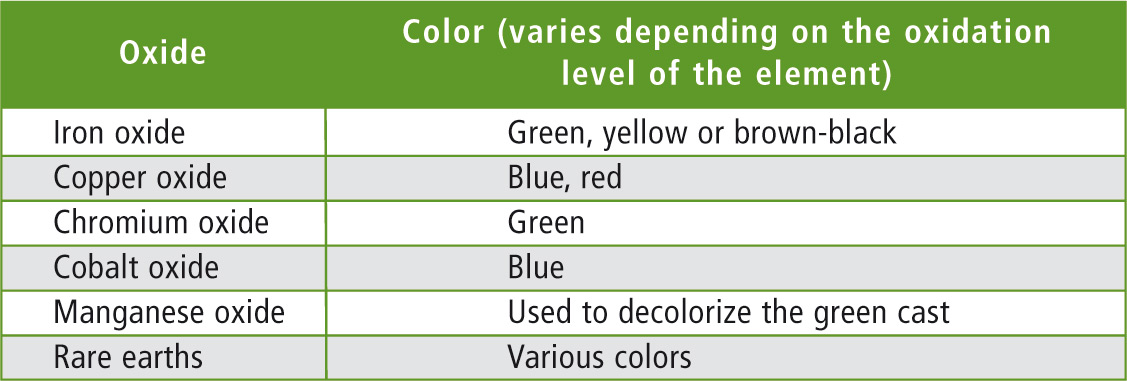 Table 1: Typical oxides for staining of glasses [1]
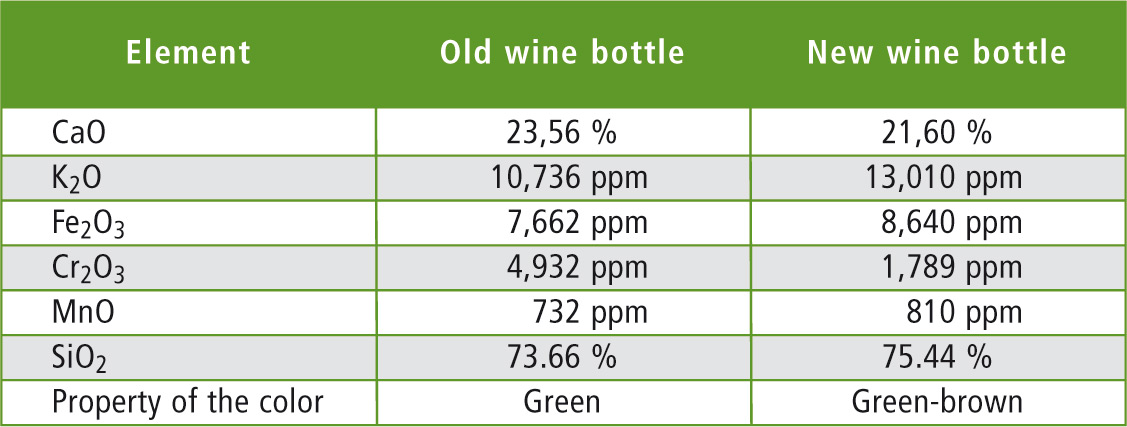 Table 2: Comparison of the element distribution in both wine bottles
Two wine bottles of different years were analyzed. Both bottles are used for bottling red wine. As might have been expected, the EDX result was dominated by the typical glass oxides – i.e. SiO2, CaO and K2O, which represent the main components in both bottles. A summary of the results is presented in table 2. The results of individual measurements are shown in figures 6 and 7 (Page 18).
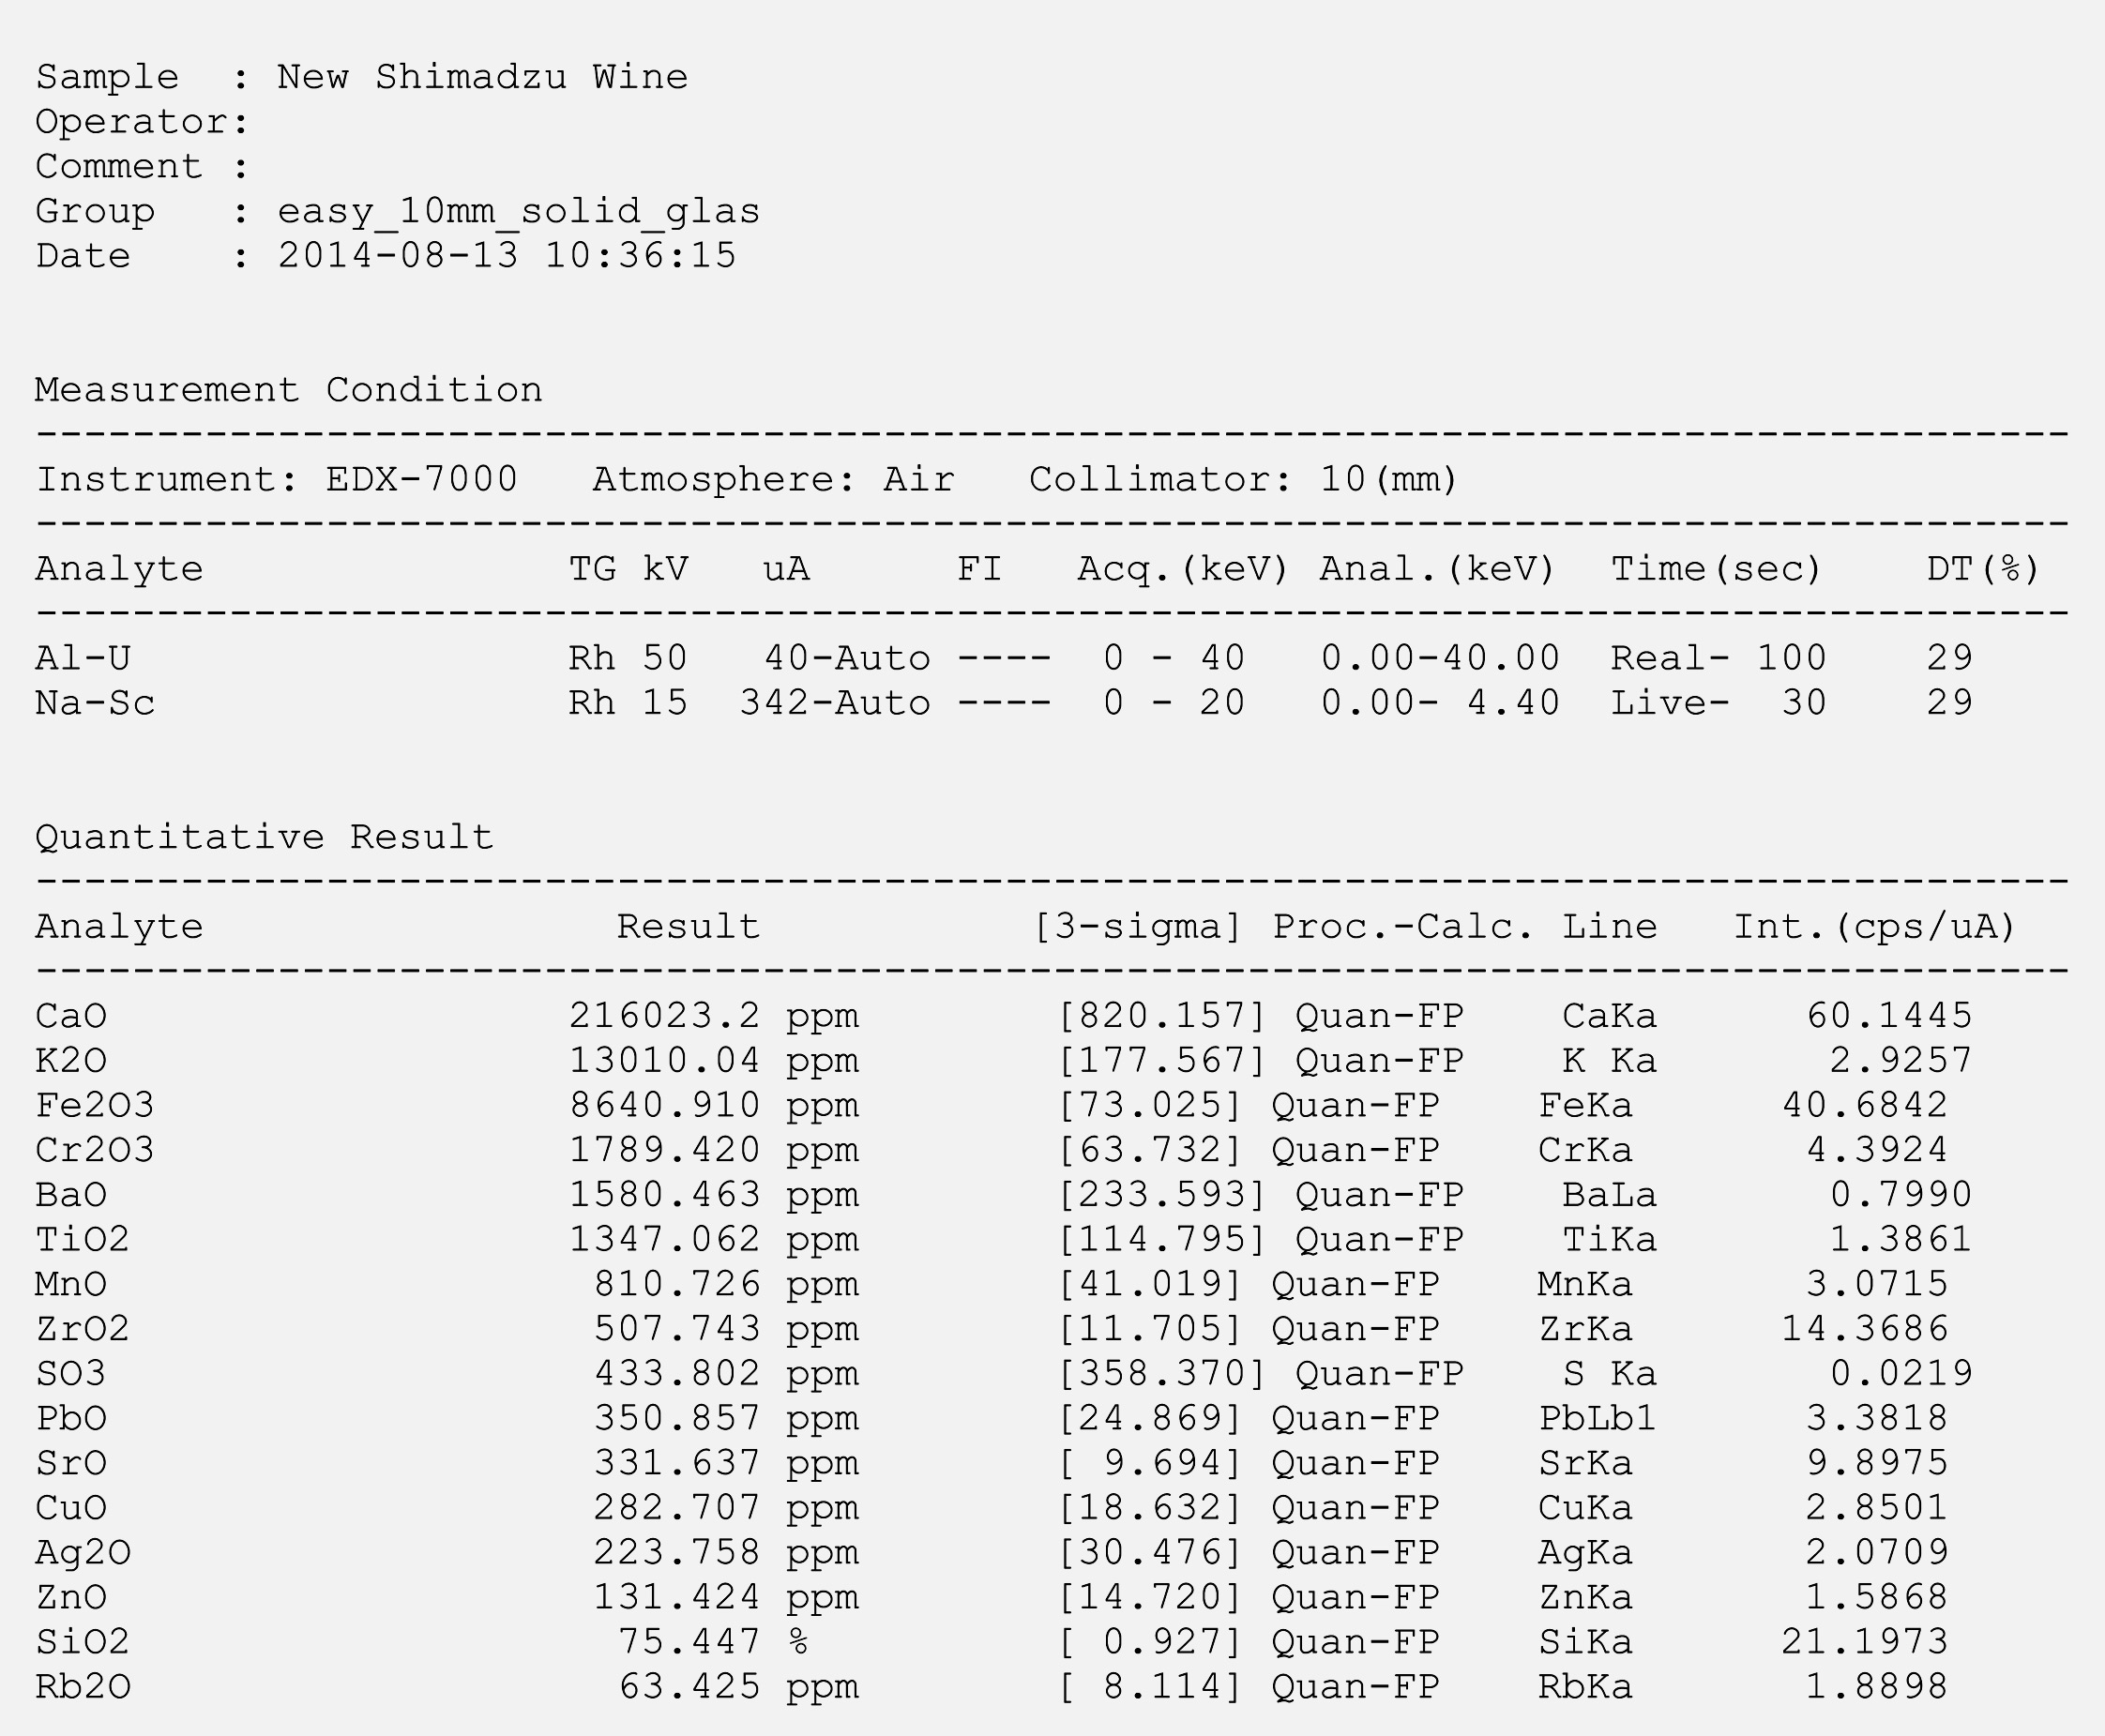 Figure 6: Analysis of the new wine bottle (EDX measurement)
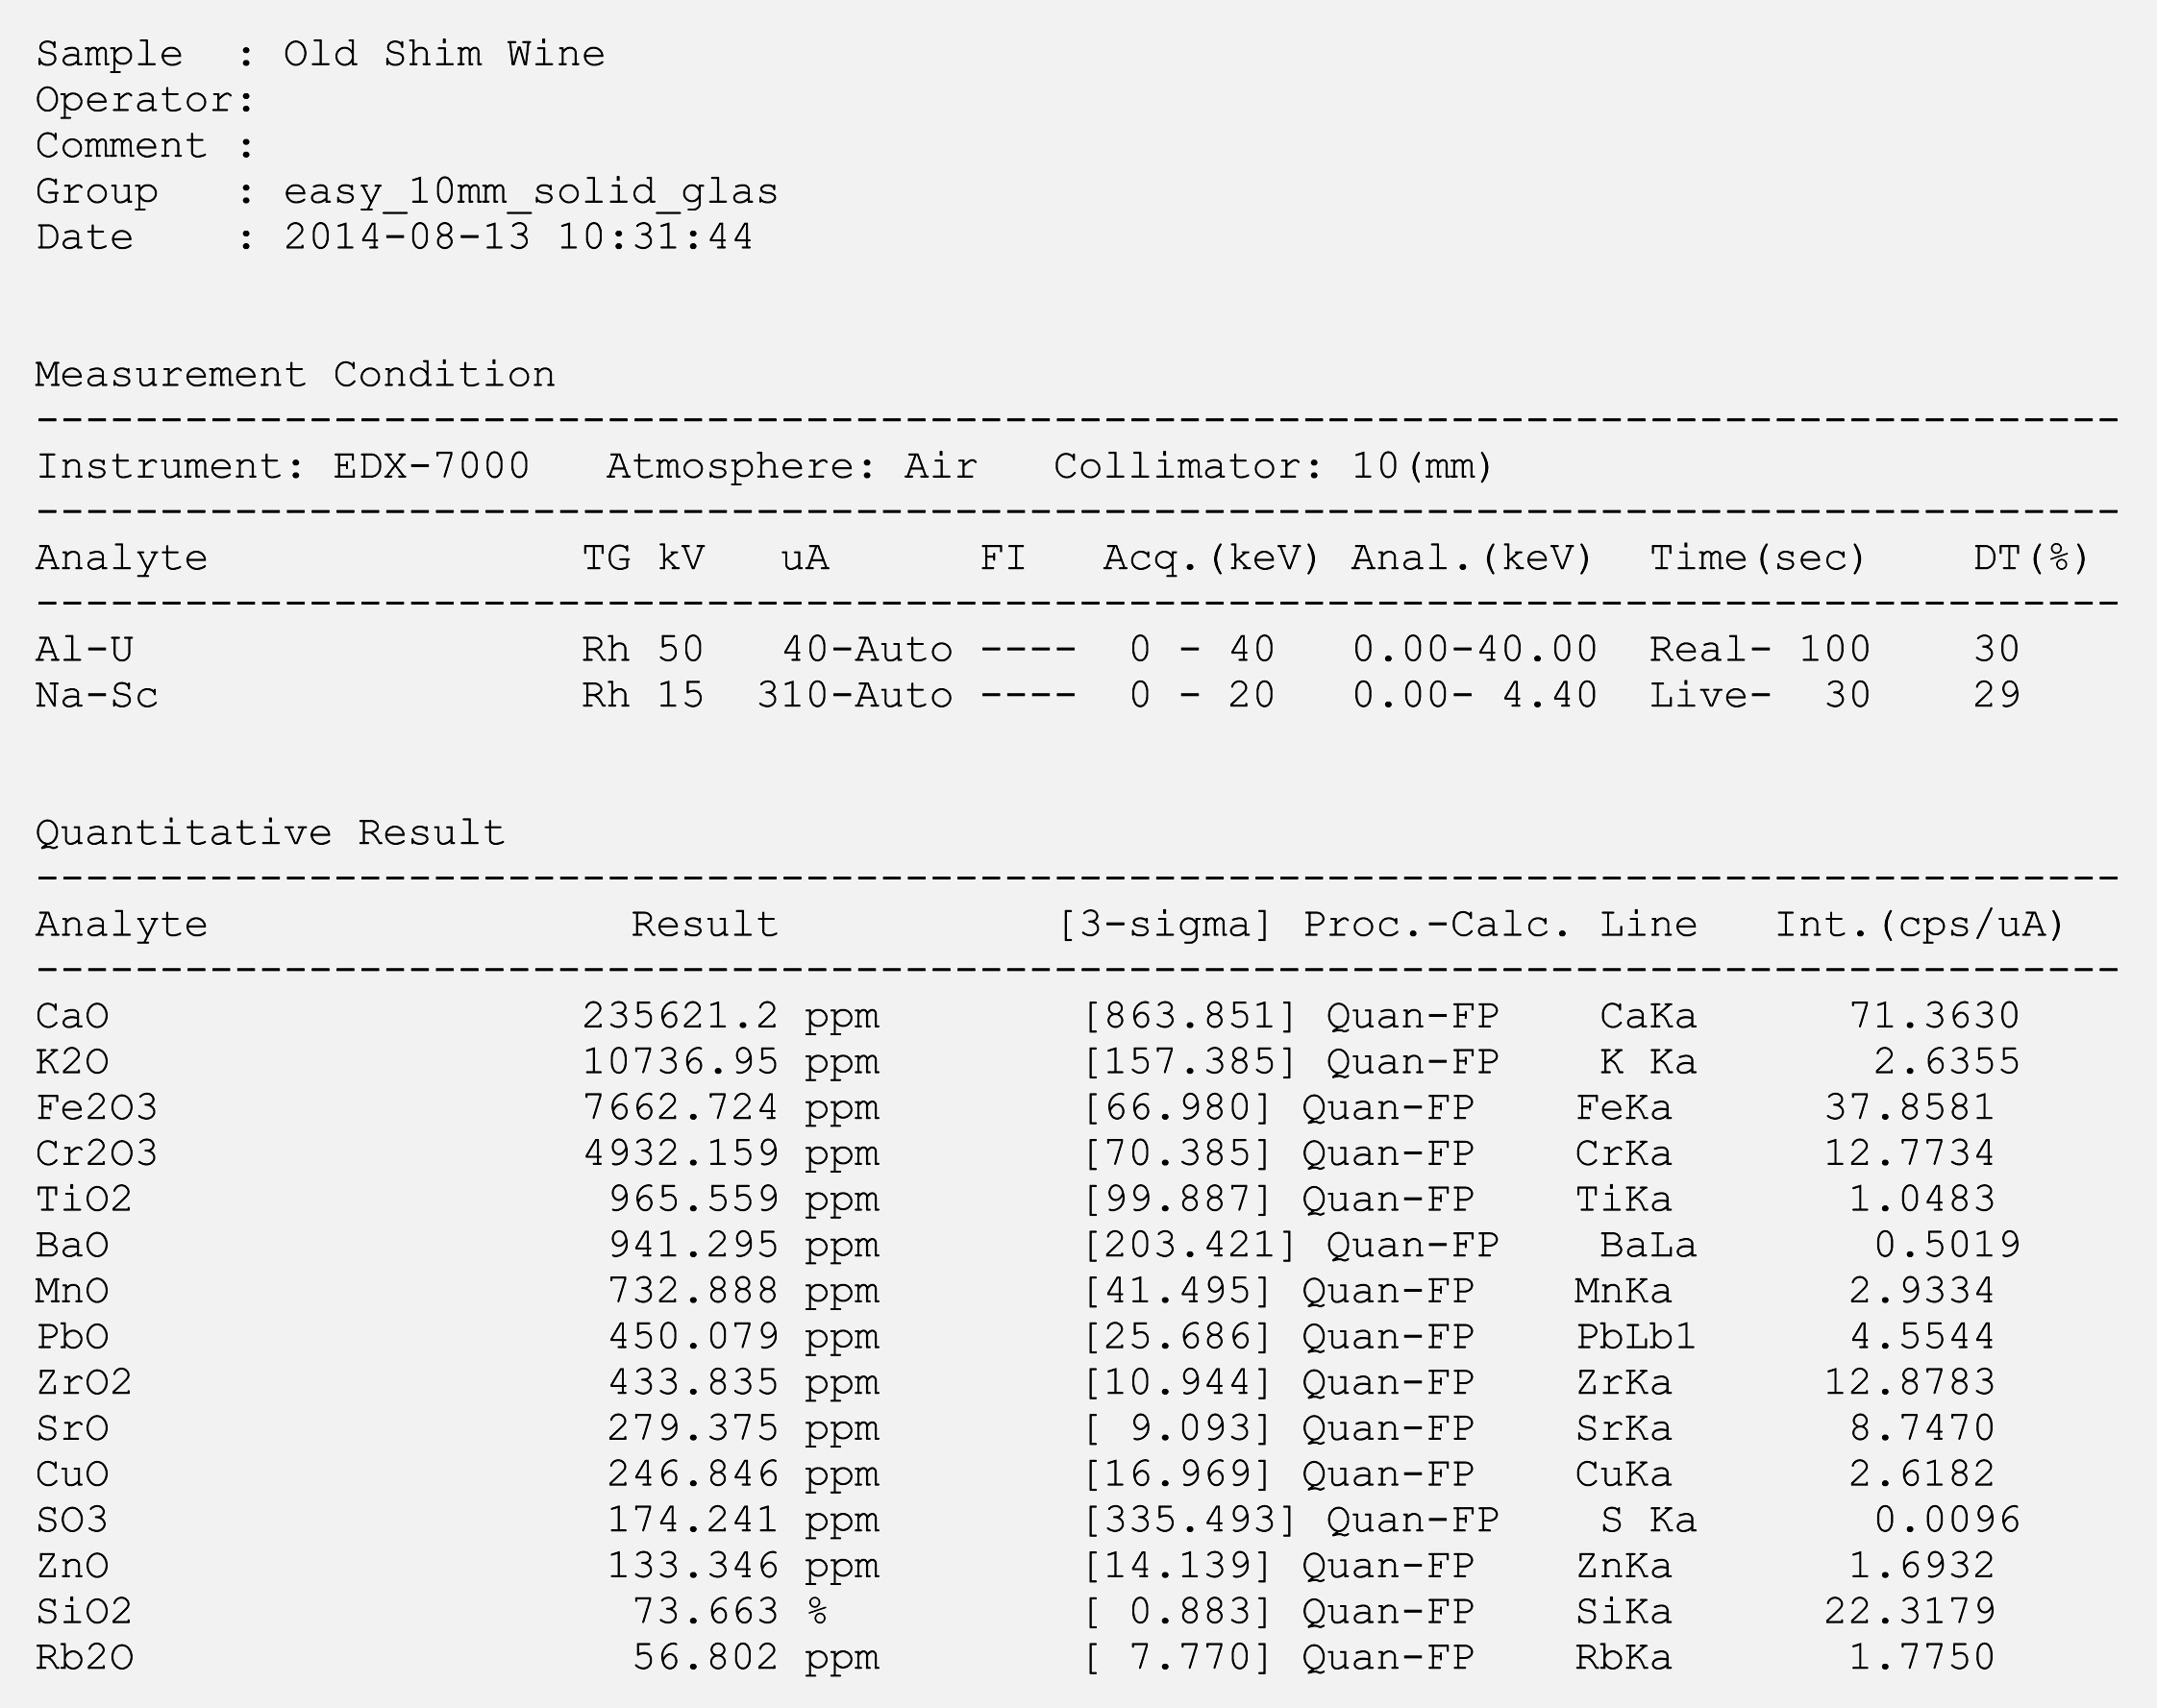 Figure 7: Analysis of the old wine bottle (EDX measurement)
Discussion
Using the EDX results, the visual and spectroscopic analyses could be confirmed. It was found that molecular spectroscopy exhibits characteristic signals that could be assigned to the oxides involved. The color as well as the composition could therefore be determined from one spectrum. The EDX elemental analysis complemented the obtained result with additional details of the material, which could indicate that the unexpected element contributions (such as silver) originated from recycled glass.
Literature
[1] Werner Vogel: Glaschemie. 3. Auflage, Springer-Verlag, 1992.
[2] The effect of chromium oxide on optical spectroscopy of sodium silicate glasses, Bahman, Mirhadi, Behzad Mehdikhani, Journal of Optoelectronics and Advanced Materials, Vol. 13, No. 9, September 2011, p. 1067 – 1070
[3] Effect on manganese oxide on redox iron in sodium silicate glasses, Bahman, Mirhadi, Behzad Mehdikhani, Journal of Optoelectronics and Advanced Materials, Vol. 13, No. 10, October 2011, p. 1309 – 1312