Quality by Design
UHPLC hardware meets DryLab®2010 software
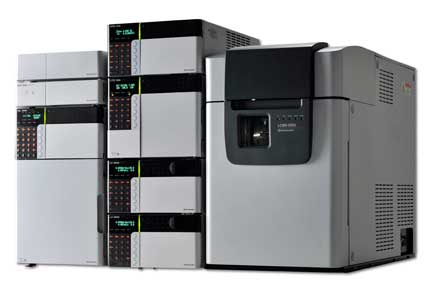 Figure 1: Shimadzu Nexera with LCMS 2020
QbD automated HPLC Method Development using DryLab®2010 enables the transfer of HPLC methods into most-modern Shimadzu UHPLC-technology. By remaining in the design space, there is a much higher flexibility in adjusting working conditions according to individual needs.
Shimadzu and the Molnar Institute in Berlin cooperated in applying well-known DryLab2010 software and the new generation of Shimadzu UHPLC instruments.
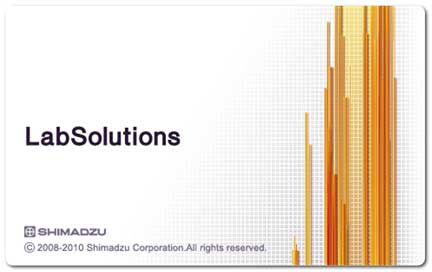
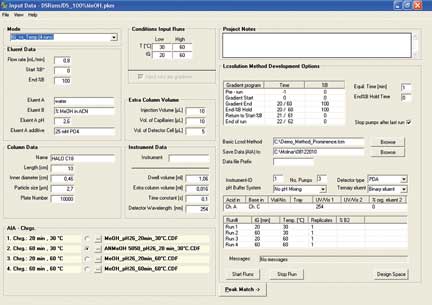 Figure 2: Interface of Shimadzu’s LabSolution software
With Drylab2010 it is now possible to simultaneously optimize several measured experimental parameters (tG, T, pH or ternary composition of eluent B) with six other derived factors (column length, -ID, dp, Flowrate, dwell volume, extra column volume) to further define the Design Space of a separation. DryLab2010 uses two-dimensional tG-T resolution maps [2]. By applying three of them, three-dimensional resolution spaces can be created in which the combined influence of three parameters can be assessed and optimized.
Molnár-Institute for applied chromatography
Founded in 1981, the Institute brings 29 years of experience in high performance liquid chromatography (HPLC). Dr. Imre Molnár, former coworker of Prof. Csaba Horváth from Yale and of Lloyd Snyder and John Dolan of LCResources USA, is a well known expert in HPLC method development.
The Molnár-Institute plays a small but essential role in the improvement of worldwide healthcare, ensuring safe products in pharmaceutical, life science and food industries, while supporting research and development at universities. The Molnár-Institute continuously serves companies all over the world in successfully designing and shaping HPLC method conditions. By offering software solutions, courses and development services, the Molnár-Institute defines its mission in applying modern software tools such as DryLab2010 to increase efficiency in HPLC laboratories and to help to find the best separation as soon as possible.
FDA, ICH and other regulatory authorities are now promoting and requesting the application of QbD principles in order to ease exchange of complex information on chromatographic selectivity and critical resolution values, so as to support better method control including method transfer. Furthermore, the ICH Q8 has made a clear movement towards more flexibility in supporting development of new products.
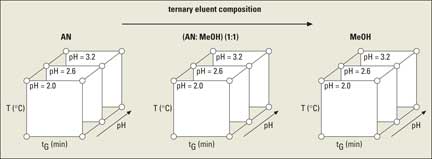 Figure 3: Experimental design for a three-dimensional HPLC method optimization
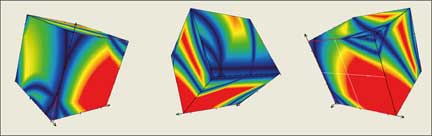 Figure 4: Design Space Visualization with DryLab®2010
Quality by Design
The Quality by Design (QbD) concept was outlined by quality expert Joseph Juran (1904-2008), stating that quality can be planned, and that most quality problems relate to the way it was planned originally.
The ideal state for pharmaceutical manufacturing in the 21st century means
- understanding the product and its production processes
- understanding the methodologies (HPLC, etc.) which generate data to support the product quality.
DryLab applies QbD principle since 20 years with a systematic evaluation of parameters influencing method performance (selectivity, resolution). DryLab simplifies and speeds up the process of developing excellent chromatographic separations by enabling users to model changes in separation conditions using their personal computer. The time-consuming laboratory runs that are typically required to achieve a satisfactory separation or development of a complete method are replaced with instantly generated chromatograms corresponding to conditions that can be individually selected.
DryLab is useful in almost all chromatography applications in the lab. The software helps to
- quickly find a good set of separation conditions
- develop complete method in minimal time
- evaluate method robustness
- shorten run times
- transfer methods to better and more modern instruments such as Shimadzu Nexera
- easily carry out validation of methods
- find the best separation conditions for any component in a mixture
- fine tune or troubleshoot existing methods
- make the method fit to its purpose
- adjust methods for ageing columns.
Design of Experiments
Preliminary evaluation determined that the most influential experimental variables on critical resolution (separation between critical peak pair) were
- Gradient time (tG) (strongest influence) (2 runs, factor 3 difference)
- Temperature (T) (moderate influence) (2 runs, 30 °C difference)
- Ternary eluent composition (% tC), (fairly strong influence for most compounds)
- Eluent B: 100 % MeOH, (50:50) (MeOH:AN), 100 % AN
- pH (strong influence for polar compounds, s.a. acids, bases, zwitterions) (f.e. pH: 2.2, 2.8, 3.4).
The most popular model is the tG-T-model which works well with UHPLC and represents more than 10,000 virtual chromatograms [2]. The experiments can be run automatically and unattended overnight using the Shimadzu LabSolution software.
The Cube
Based on the principles of the Solvophobic Theory [1] DryLab 2010 calculates continuous changes in the selectivity of Reversed Phase (RP) separations. Retention forces are based primarily on highly organized water structure and on the tendency of water to reduce the cavity interfaces between the C18-silica surface and nonpolar molecules. Lipophobicity of water can be reduced by dilution with strong eluents MeOH or AN. This is how the Molnar-Institute carries out RP-gradient elution. The Cube is calculated from twelve experiments using tG-T models at
- different ternary compositions of the weak retarding eluent B (MeOH, AN or 50:50-mix) or
- three different pH-values
and it represents over 106 modeled chromatograms while evaluating multiple parameters simultaneously. With just one mouse-click the best separation out of ca. 106 runs can be found in the Cube. The Cube also helps to partially or fully replace expensive acetonitrile with methanol. The input data necessary for these 3D models is depicted in the figure below: three tG-T models, at three different values of a third parameter.
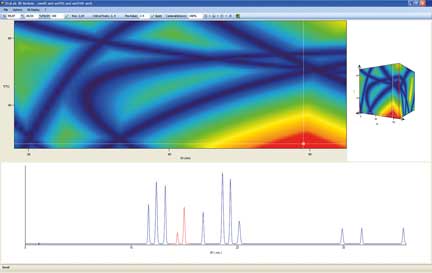 Figure 5: DryLab 3D model
Each point in these 3D resolution spaces corresponds to a highly accurate chromatogram [3].
The best chromatogram is available in one second. Red color in the resolution map means that the critical peak pair is better separated than baseline resolution (Rs, crit > 1.5). The critical (least well separated) peak pair is shown with different colors than the other peaks.
At the optimum setting of the tG, T and pH or ternary composition can further optimize separation using different gradient steps while controlling the influence of the flowrate, column dimensions and dwell volume on the separation selectivity.
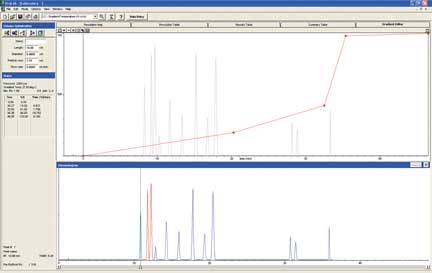 Figure 6: Gradient Editor
In the gradient editor points can be added and moved with the mouse. Selectivity changes with up to 10 gradient points can be observed immediately together with separation changes. Furthermore, the changes can be studied while modifying flowrate or column dimensions and altering the resolution.
Precision of predictions
The predicted runs deviate from the corresponding experiments with an average less than 0.2 % of the peaks’ retention times. This reduces trial & error runs tremendously and increases work efficiency.
References
- Solvophobic Interaction with Nonpolar Stationary Phases in Liquid Chromatography, Cs. Horváth, W. Melander, I. Molnár J. Chromatogr. 125 (1976) 129-156.
- Rapid high performance liquid chromatography method development with high prediction accuracy using 5 cm long narrow bore columns packed with sub-2µm particles and Design Space computer modeling, Sz. Fekete, J. Fekete, I. Molnár, K. Ganzler, J. Chromatogr. A, 1216 (2009) 7816-7823.
- Aspects of the “Design Space” in high pressure liquid chromatography method developmentI. Molnár, H.J. Rieger, K. E. Monks J. Chromatogr. A, 1217 (2010) 3193-3200.