Luminescent PET bottles
Part 1: Plastic determination using fluorescence spectroscopy
Whether soft drinks, lemonade or sparkling water – PET bottles are used for beverages all over the world. PET stands for “polyethylene terephthalate” and is one of the synthetic polymers commonly known as plastic. Every year, several million tons of polymers are released into the environment.
Together with climate change, pollution by plastic is one of the major challenges worldwide: for humanity, animals, and the environment. Microplastic especially presents a high risk due to its small size, as many creatures and microorganisms may confuse it with food.
PET bottles can be analyzed using fluorescence spectroscopy since these bottles show partial luminescence. As it is a complex topic, the topic of fluorescence effects in polymers in general and the effect of size regarding environmental degradation of plastics into microplastics is divided into three parts. This part 1 of the article series shows the effect of fluorescence on dedicated polymer PET, part 2 widens the focus to different polymers and part 3 investigates particle size and its effect on fluorescence.
Multicolored polymers
Many polymers are colored with inorganic or organic colorants (pigments and dyes). The group of colorants used depends on the individual plastic and the production form as well as the required consumer preferences. Regulations regarding coloring apply when food comes into contact with plastic, such as candy packaging or beverage bottles [1]. For example, the coloring of PET bottles can range from opaque to transparent.
Figure 1 shows a collection of beverage bottles. All of them contained water-based beverages like non-carbonated water, lemonade, citrus lemonade and sparkling water. Many of these PET bottles have a light or intense blue color. In particular the bottles declared to be based on 100 % recycled PET are more bluish than the others.
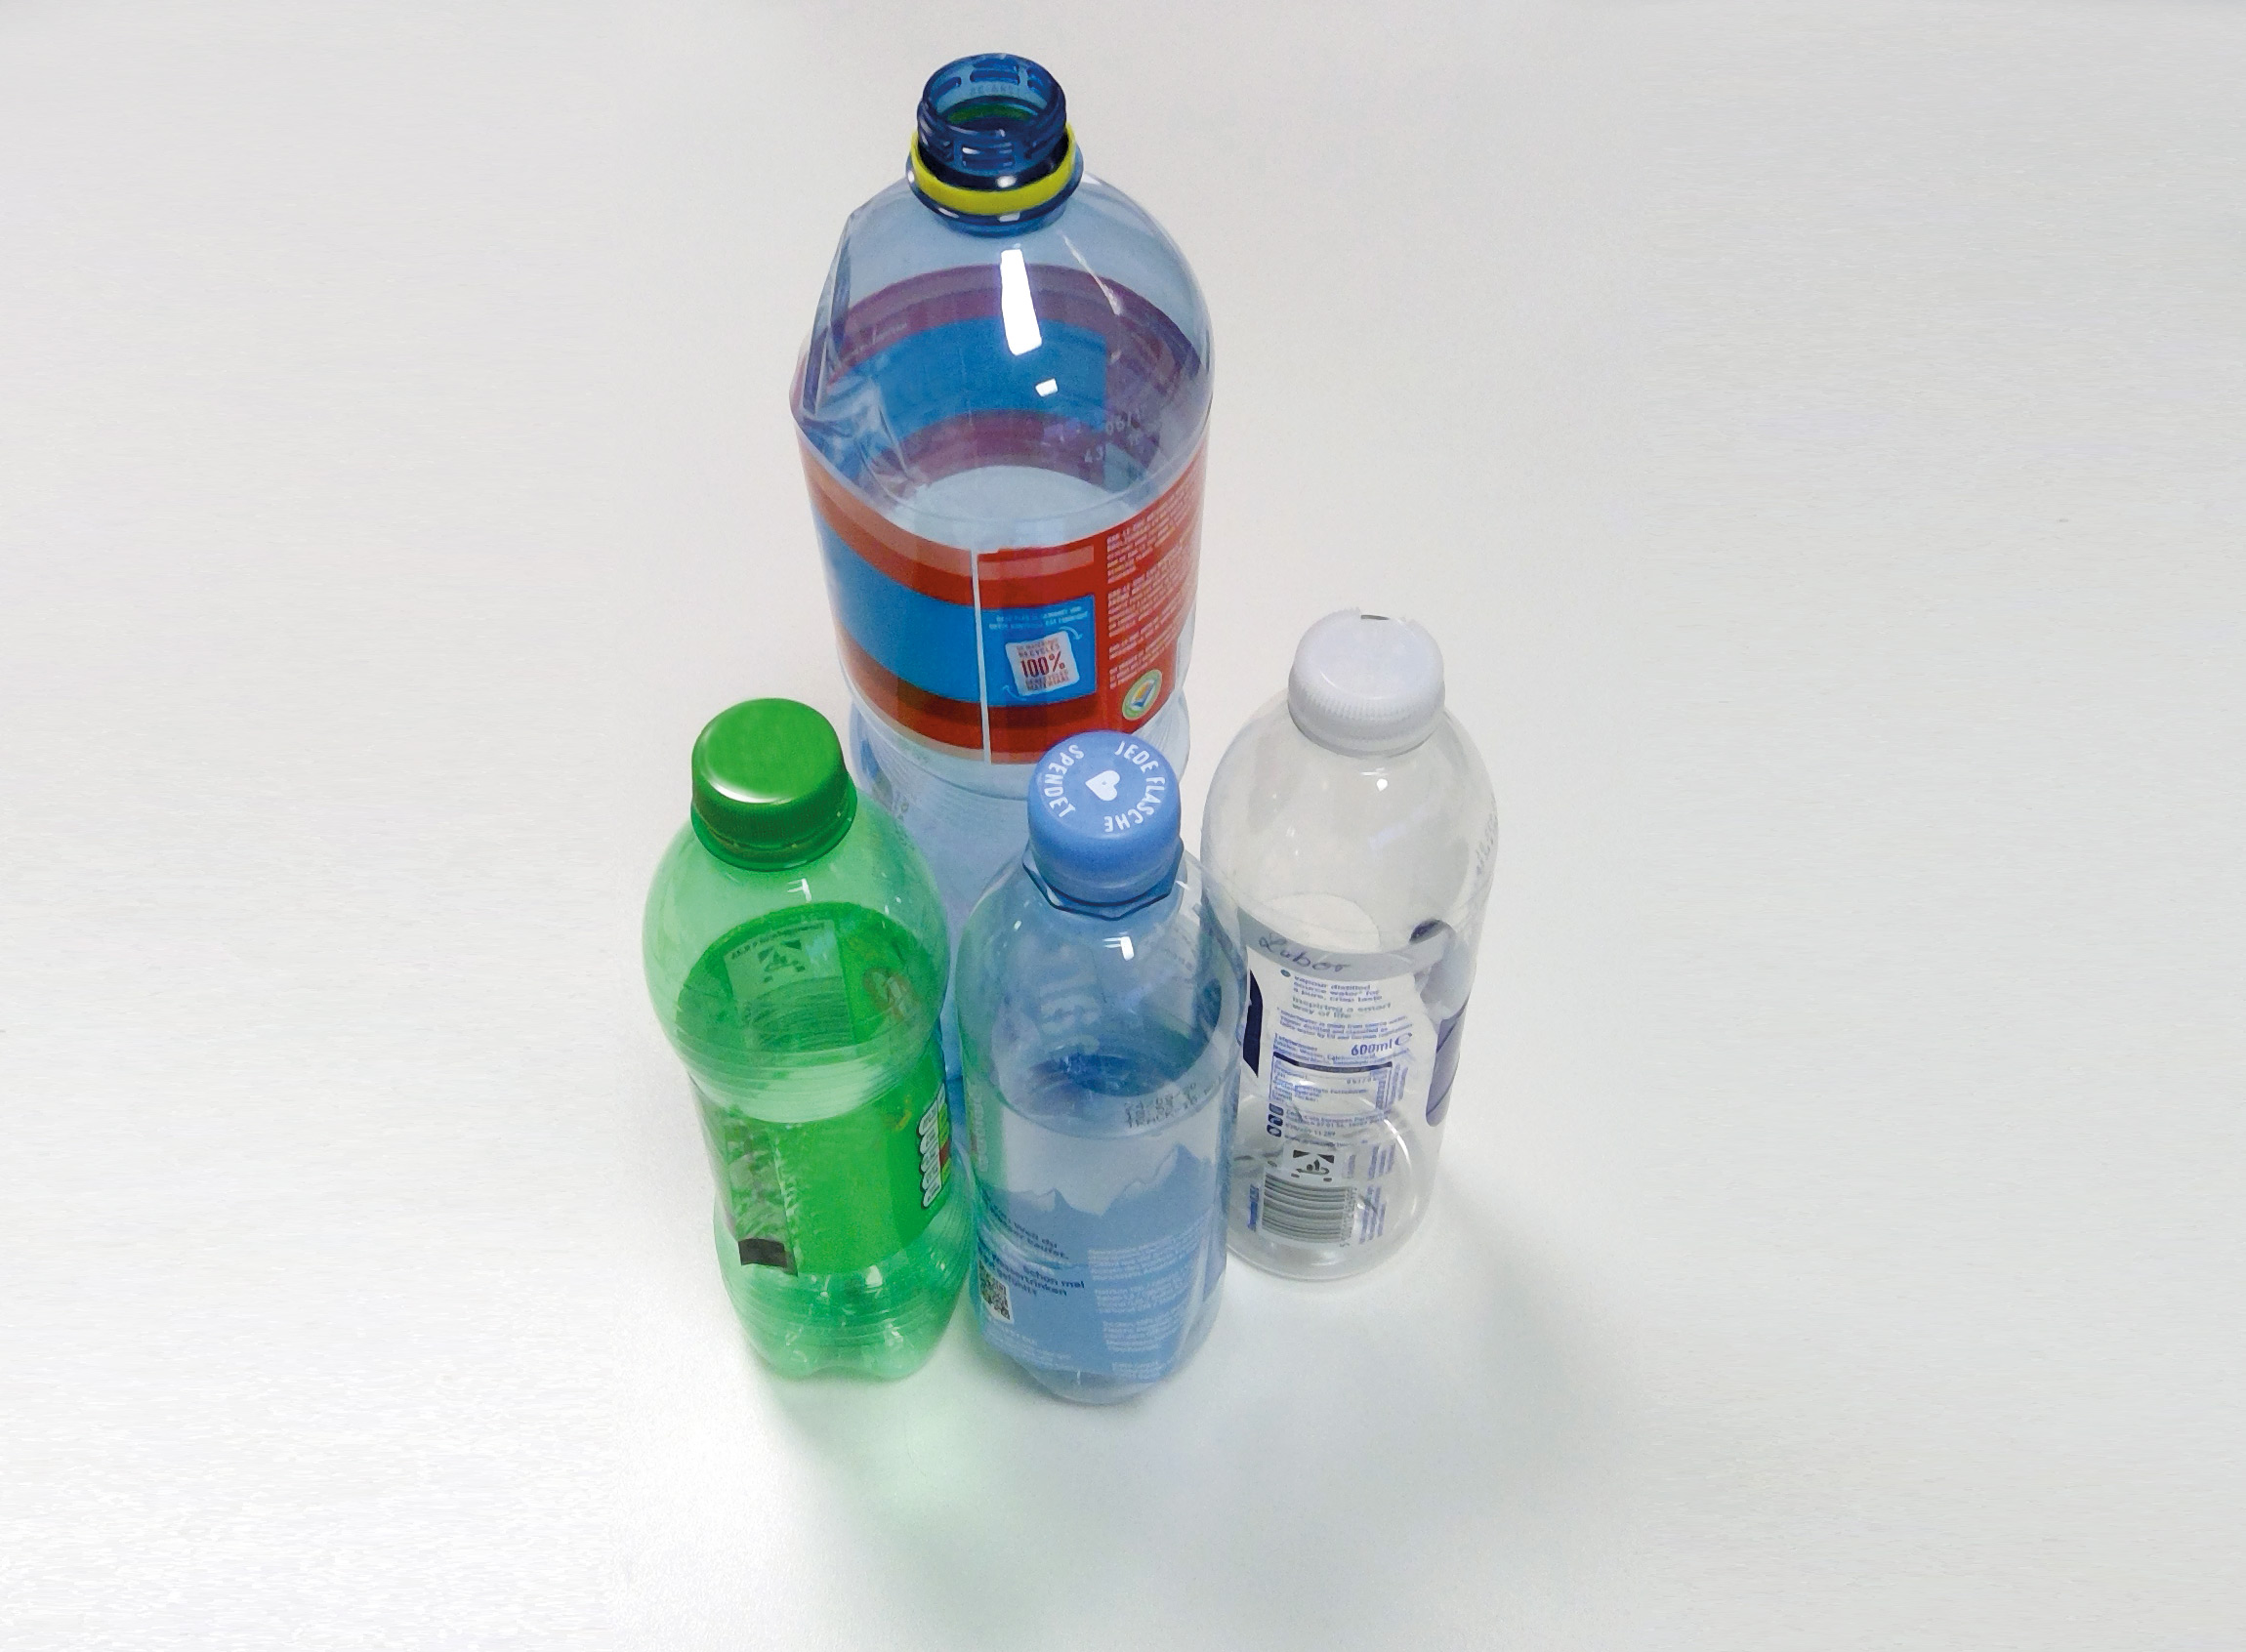 Figure 1: Four bottles made from PET. They originally contained beverages. Citrus lemonade, water, lemonade and non-carbonated water
Color sells
Marketing reasons also influence the appearance of a bottle. For example, a bottle consisting partly of recycled colorless PET appears unpleasantly yellowish. With the help of colorants, the bottle can be transferred into a bluish color, more attractive to the human eye and enhancing consumer willingness to buy.
Analysis
For a quick screening, rectangular pieces from the bottle walls of approx. 2 x 3 cm were placed in the solid sample holder and measured with Shimadzu’s RF-6000 spectrofluorophotometer system. The Excitation Emission Matrix (EEM) of almost all bottle pieces showed a weak fluorescence in the area of 325 to 420 nm.
Quick screening was performed to detect unknown colorants in the PET cuts using the EEM function of the LabSolutions RF software. The advantage of such a screening of unknown colorants is the wide dynamic range of the fluorescence measurements regarding concentration of different fluorophores without changing the parameters.
The variety of PET bottles contributed to identification of PET related fluorescence [1] which was detected in each of the samples, as well as different fluorophores and their concentrations including an overall diverse fluorescence activity.
The quick analysis of the cuts showed higher fluorescence activity for the dark green lemonade bottle. Measurement results are shown in table 1. It contains the bottle volume, beverage, color, size, highest fluorescence intensity value from the region and the related Excitation (EX) and Emission (EM) wavelength. The three last values only represent one measurement region and are not absolute single values characterizing the polymer or the colorant.
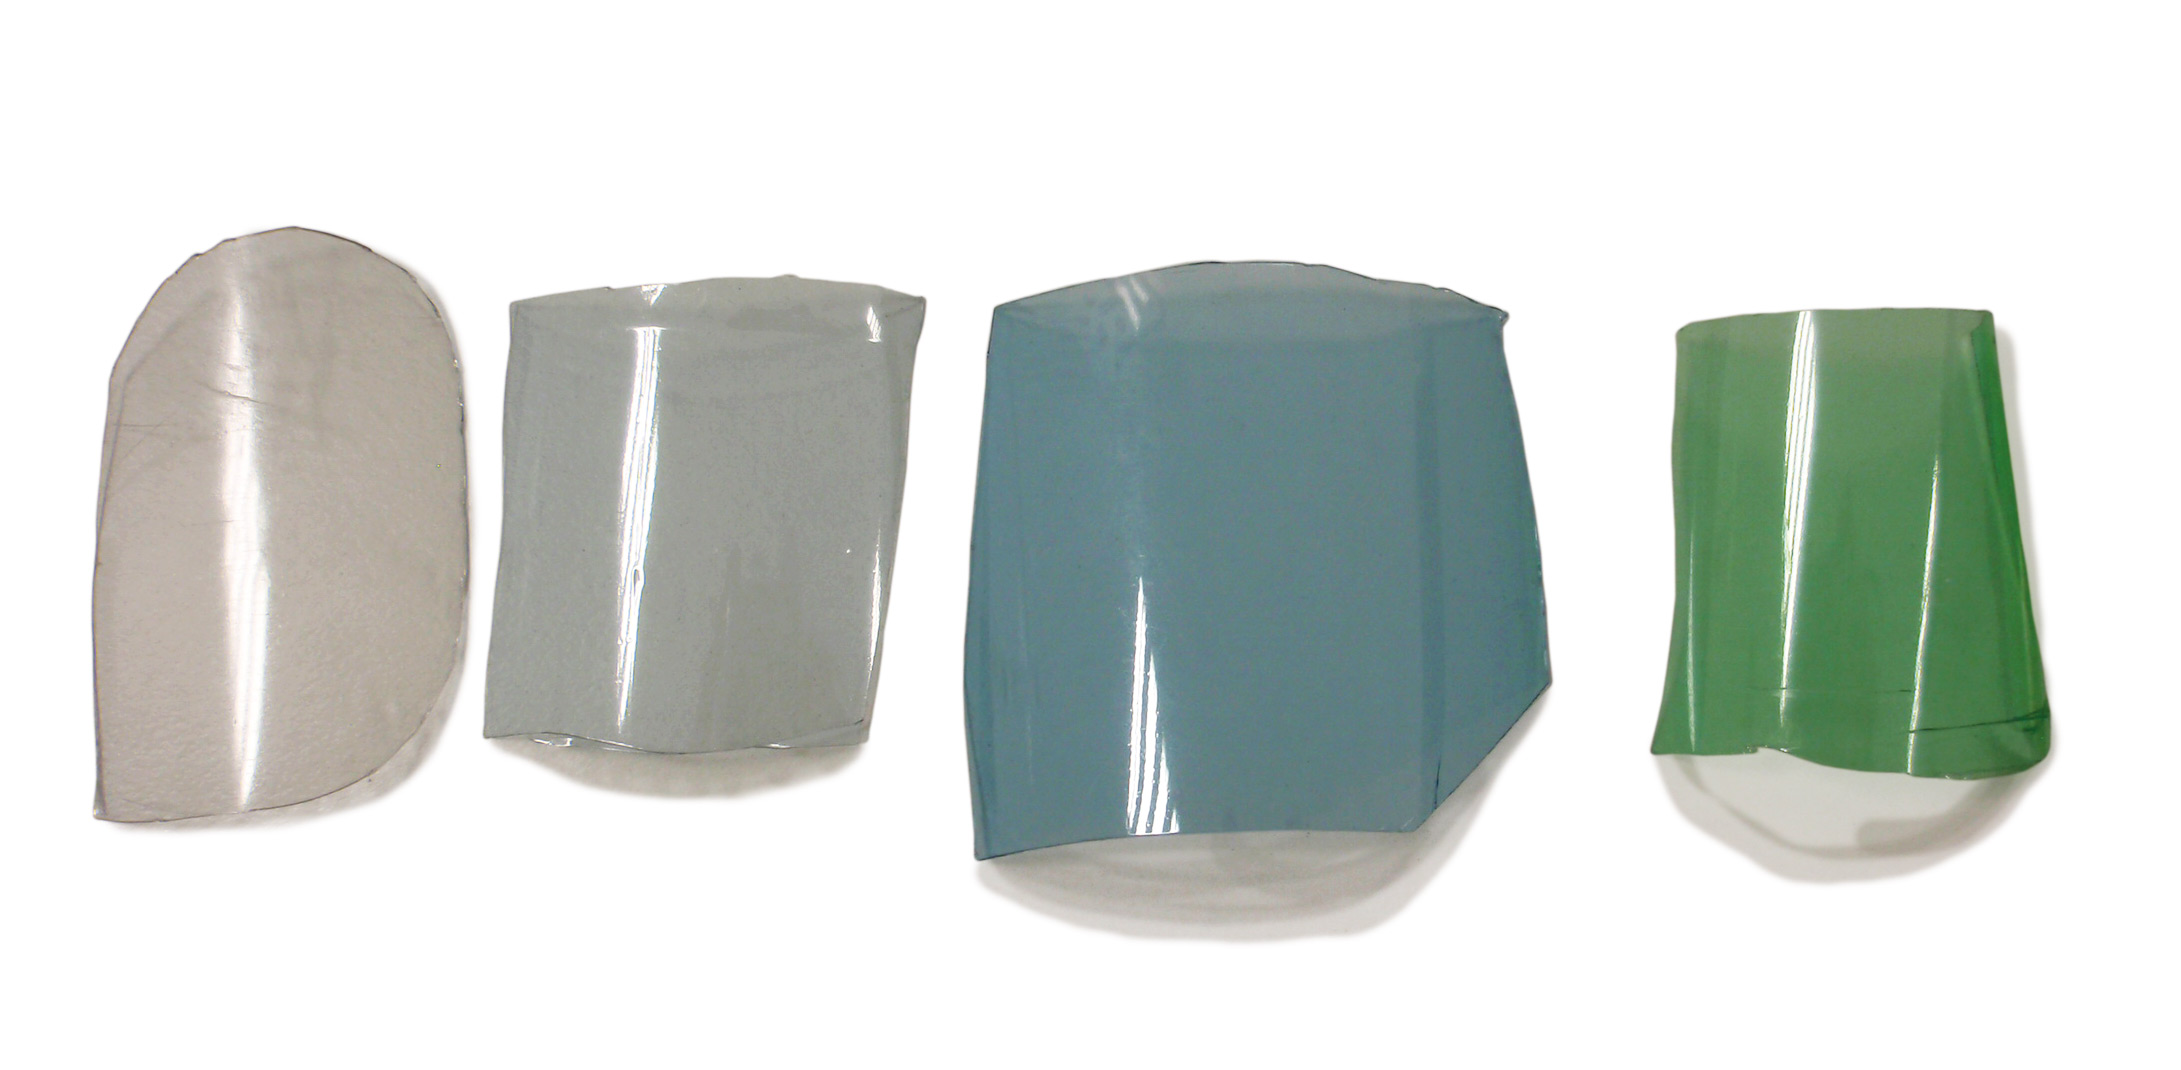 Figure 2: Cuts of plastic sheets from PET bottles
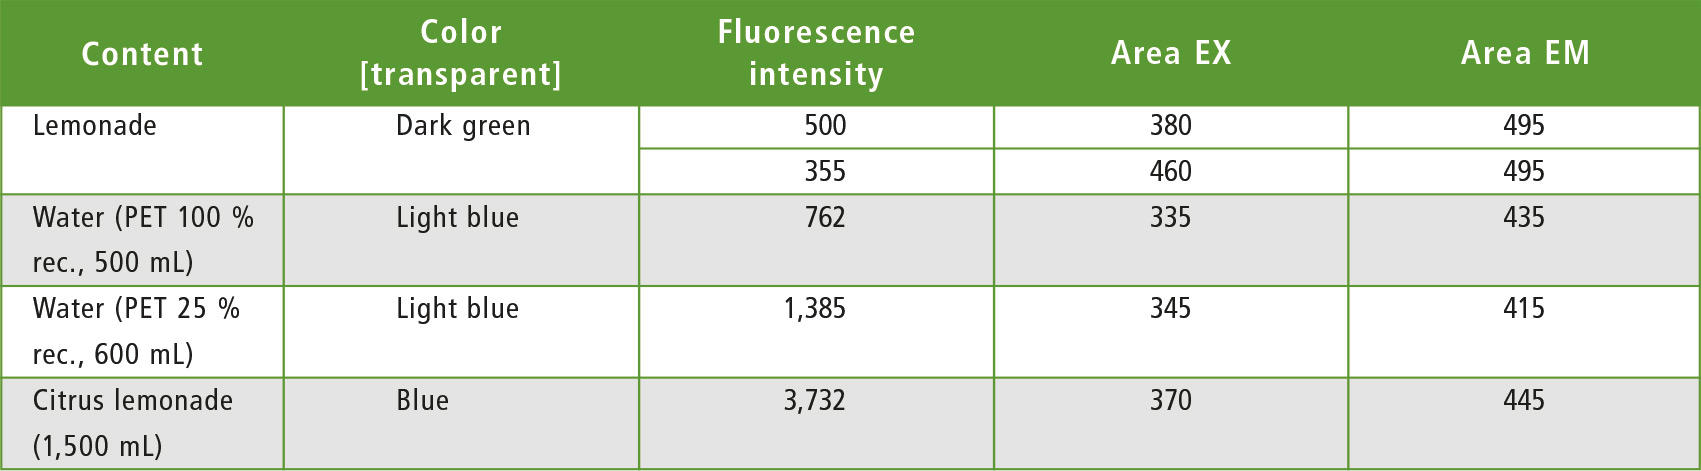 Table 1: Fluorescence intensity of PET from different sources – in common plastic bottles for beverages (rec. = recycled)
The LabSolutions RF software file version in combination with Shimadzu’s RF-6000 was used. Measurement parameters were the same for all samples.
For the double grating system (excitation and emission) the slits for the excitation and emission scan were set to 3 nm. For the excitation energy, a 150 Watt Xenon lamp was used. Step size for the excitation grating movement to receive the EEM was 5 nm.
Scan speed was 6,000 nm/min. The EEM was obtained by moving the excitation grating in 5 nm steps along the defined UV-Vis measurement range and recording the emission spectrum over a fixed range. All spectra collected were then presented with their intensities in a 3D-view of excitation wavelength versus fluorescence wavelength.
Observation range was 300 to 600 nm for both axes (excitation and emission). The intensity scale of the upper and lower limit in the matrices graph is identical. For the table, a more precise value was selected from the highest intensity of a range.
All bottles showed a typical area of weak intensity at about EX 325 nm and EM 320 nm. The intensity of the fluorescence matrix is zoomed to 2,000 intensity units (figure 3).
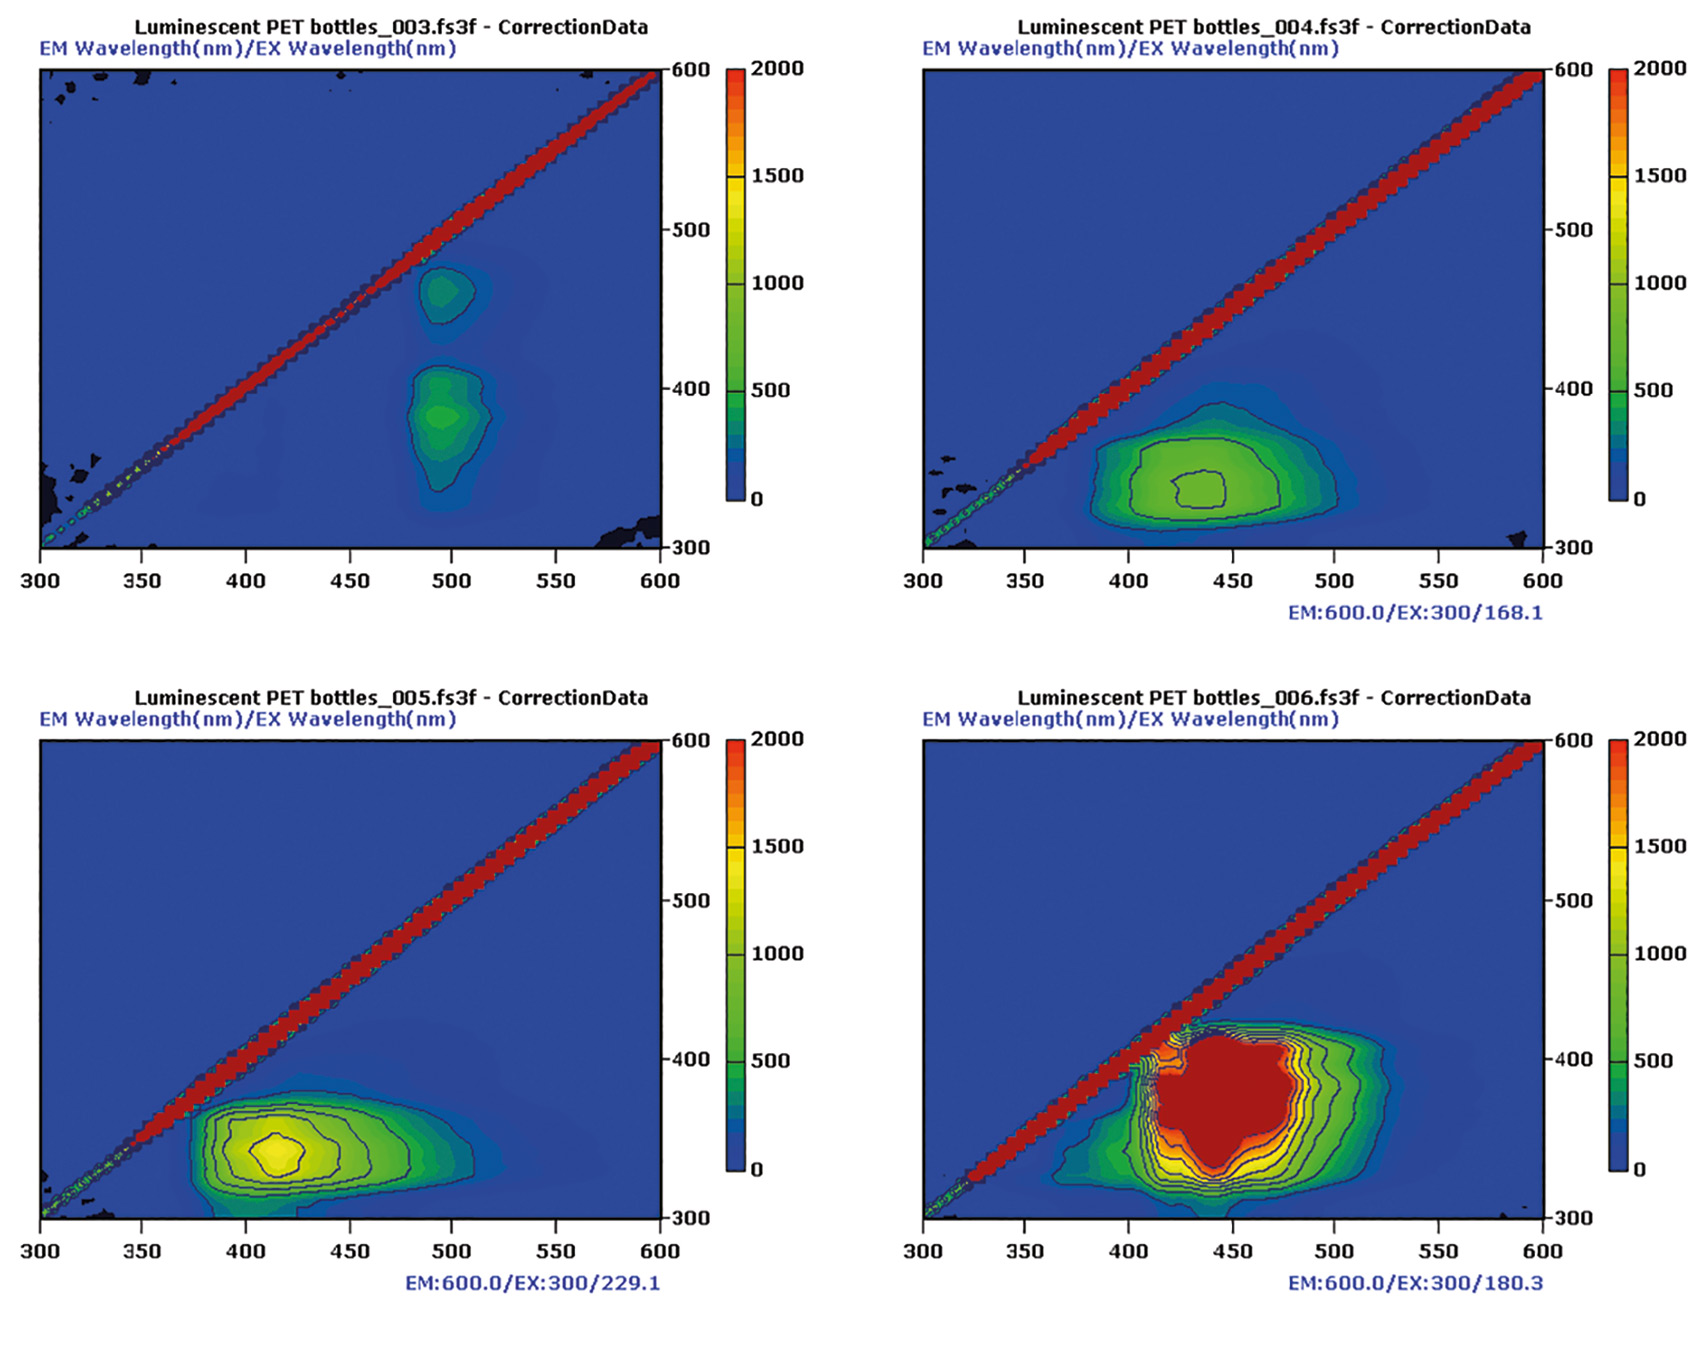 Figure 3: EEM Matrices of the cuts from the four bottles of figure 1, upper left lemonade, upper right water 100 % recycled, bottom left water 25 % recycled, bottom right citrus lemonade
Generally, PET has its own fluorescence [2]. It may therefore overlap with the colorant. Due to the bottles different structures and thicknesses, fluorescence intensity (table 1) of the hot spots in the matrices is also film thickness dependent.
Conclusion
All bottles made from PET showed fluorescence activity. The dark colored bottles (lemonade-dark green and citrus lemonade-blue) had higher intense signals in the non-PET area. Blue colorants can have their fluorescence in the range of the PET signal, so that an overlapping with a blue fluorescent colorant can be expected. This also explains the shift of the hot spot in the graphics (figure 3) into the region of longer wavelength (table 1).
With this measurement setup, it is possible to analyze fluorescence intensity from colored plastics based on PET. As the measurements were done with low sensitivity and small slits, it is likely that fluorescence with only traces of material can also be expected and detected. The influence of size will be shown in the following parts two and three of this application in the next Shimadzu NEWS issues.
The idea to utilize this measurement came from CARAT GmbH, Bocholt (Albert van Oyen, Erwin Jansen).
Literature
[1] Colorants and Polymers, Food and drug administration HHS 178.3297, 21 CFR Ch. I (4-1-16 Edition)
[2] Absorption and fluorescence spectra of poly(ethylene terephthalate) dimers, M. F. Sonnenschein and C. M. Roland, POLYMER, 1990, Vol 31, November, 2023-2026