High-performer to support the doctor
Therapeutic Drug Monitoring with LCMS-8040 in Moscow Davydovsky Hospital
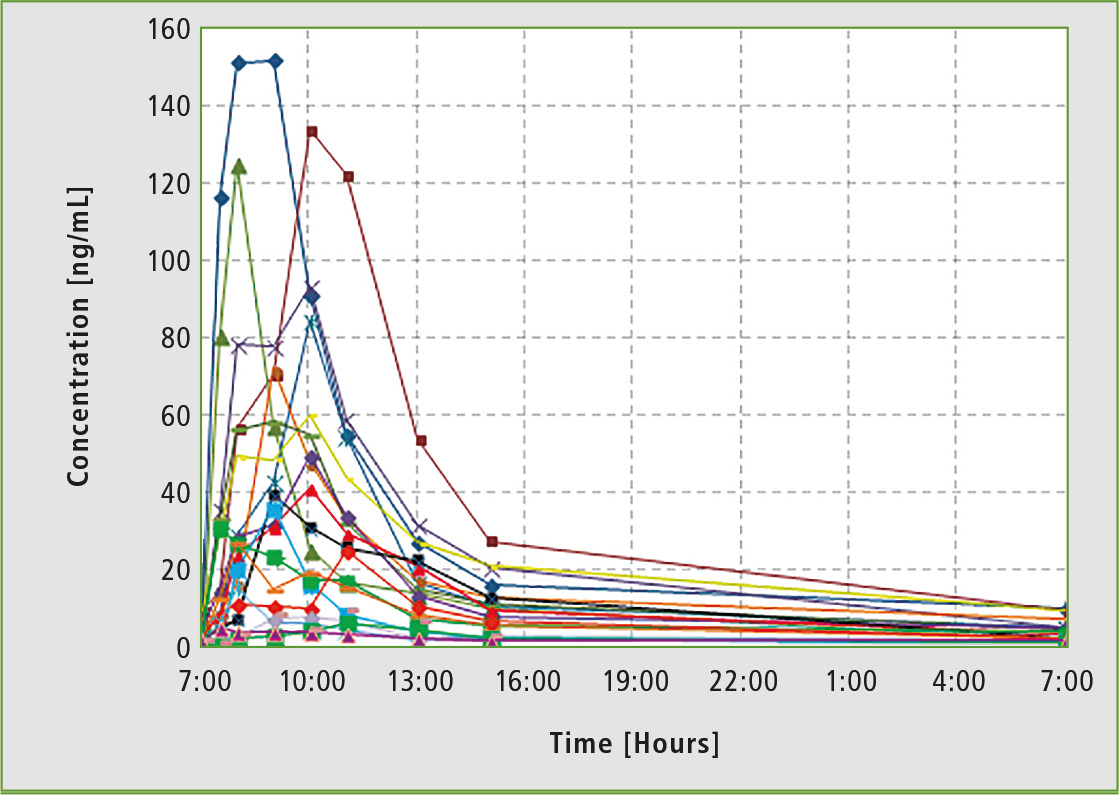 Figure 2: Individual pharmacokinetic curves for daily monitoring of drugs in the blood serum of patients taking the same anti-tumor drug in the same dose at the same time. It shows how significant the differences in pharmacokinetics are among people of the same population.
The efficient treatment of diseases matters a lot in evidence-based and personalized medicine. One powerful tool is Therapeutic Drug Monitoring (TDM), determining the concentrations of medical substances and/or their metabolites in patients’ blood (rarely in urine). Medication dose and frequent adjustment may be done based on the data obtained. Results collected during pharmacokinetic studies indicate that it is impossible to prescribe many medicines according to a “general” template. Individual needs of each patient must be taken into account (figure 2).
TDM mandatory for a wide range of drugs
According to GCP (Good Clinical Practice) regulation, use of a number of medicines has to be accompanied by pharmacokinetic monitoring, especially for drugs with a narrow therapeutic window such as immunosuppressants, anticonvulsants, some antibiotics, antiarrhythmic drugs or cytostatics. Currently, it is prohibited in most European countries and the USA to prescribe some potent drugs (psychotropic, psychostimulants, antidepressants etc.) and long-term drugs (antihypertensive, cardiac glycosides) without monitoring their concentration in the patient’s body. According to the Russian Ministry of Health regulation “About improving the clinical pharmacologist’s activity” (# 494 on 10/22/2003), it is necessary to perform TDM for a wide range of drugs: anticonvulsants, antiarrhythmic drugs, antibiotics, immunosuppressants, etc.
LC-MS is the method of choice for TDM
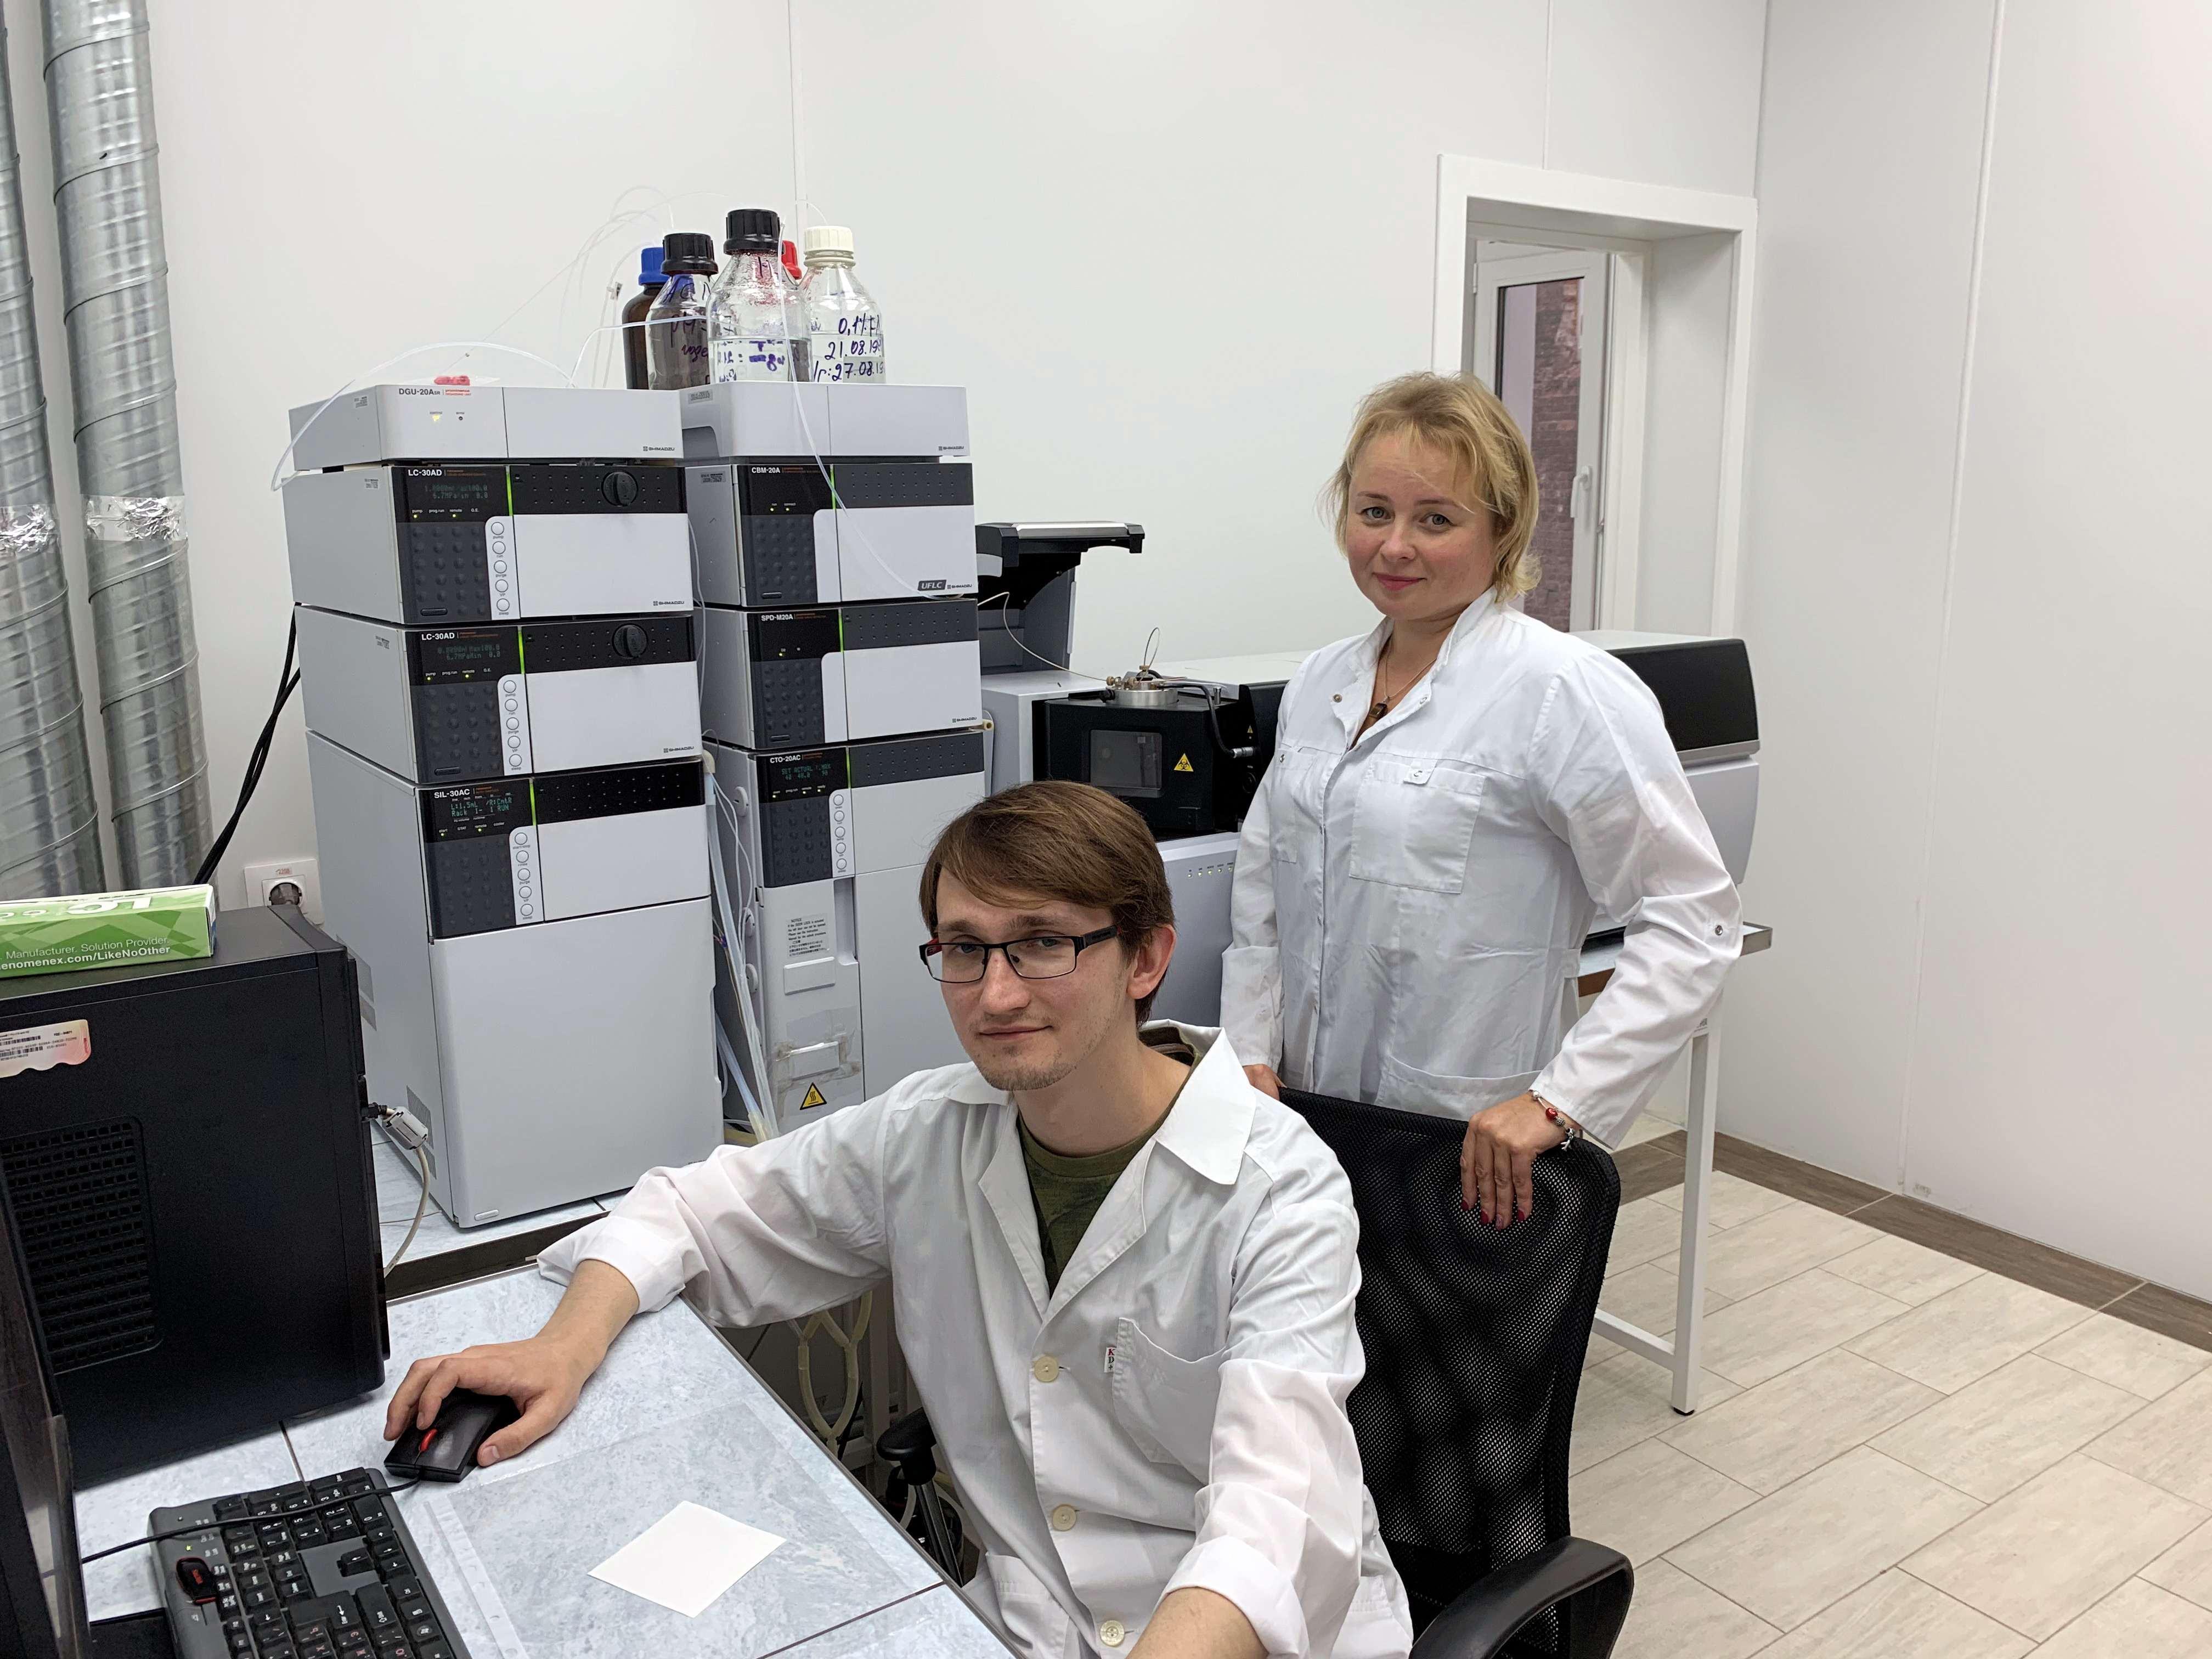
The importance of TDM for practical healthcare can be illustrated by routine day-to-day work of the Pharmacokinetics Laboratory located at the Moscow Hospital named after Ippolit Davydovsky where Shimadzu’s high-performance liquid mass spectrometer LCMS-8040 was installed in 2013 (figure 1). This triple quadrupole is intended for high-sensitivity and ultra-fast analysis.
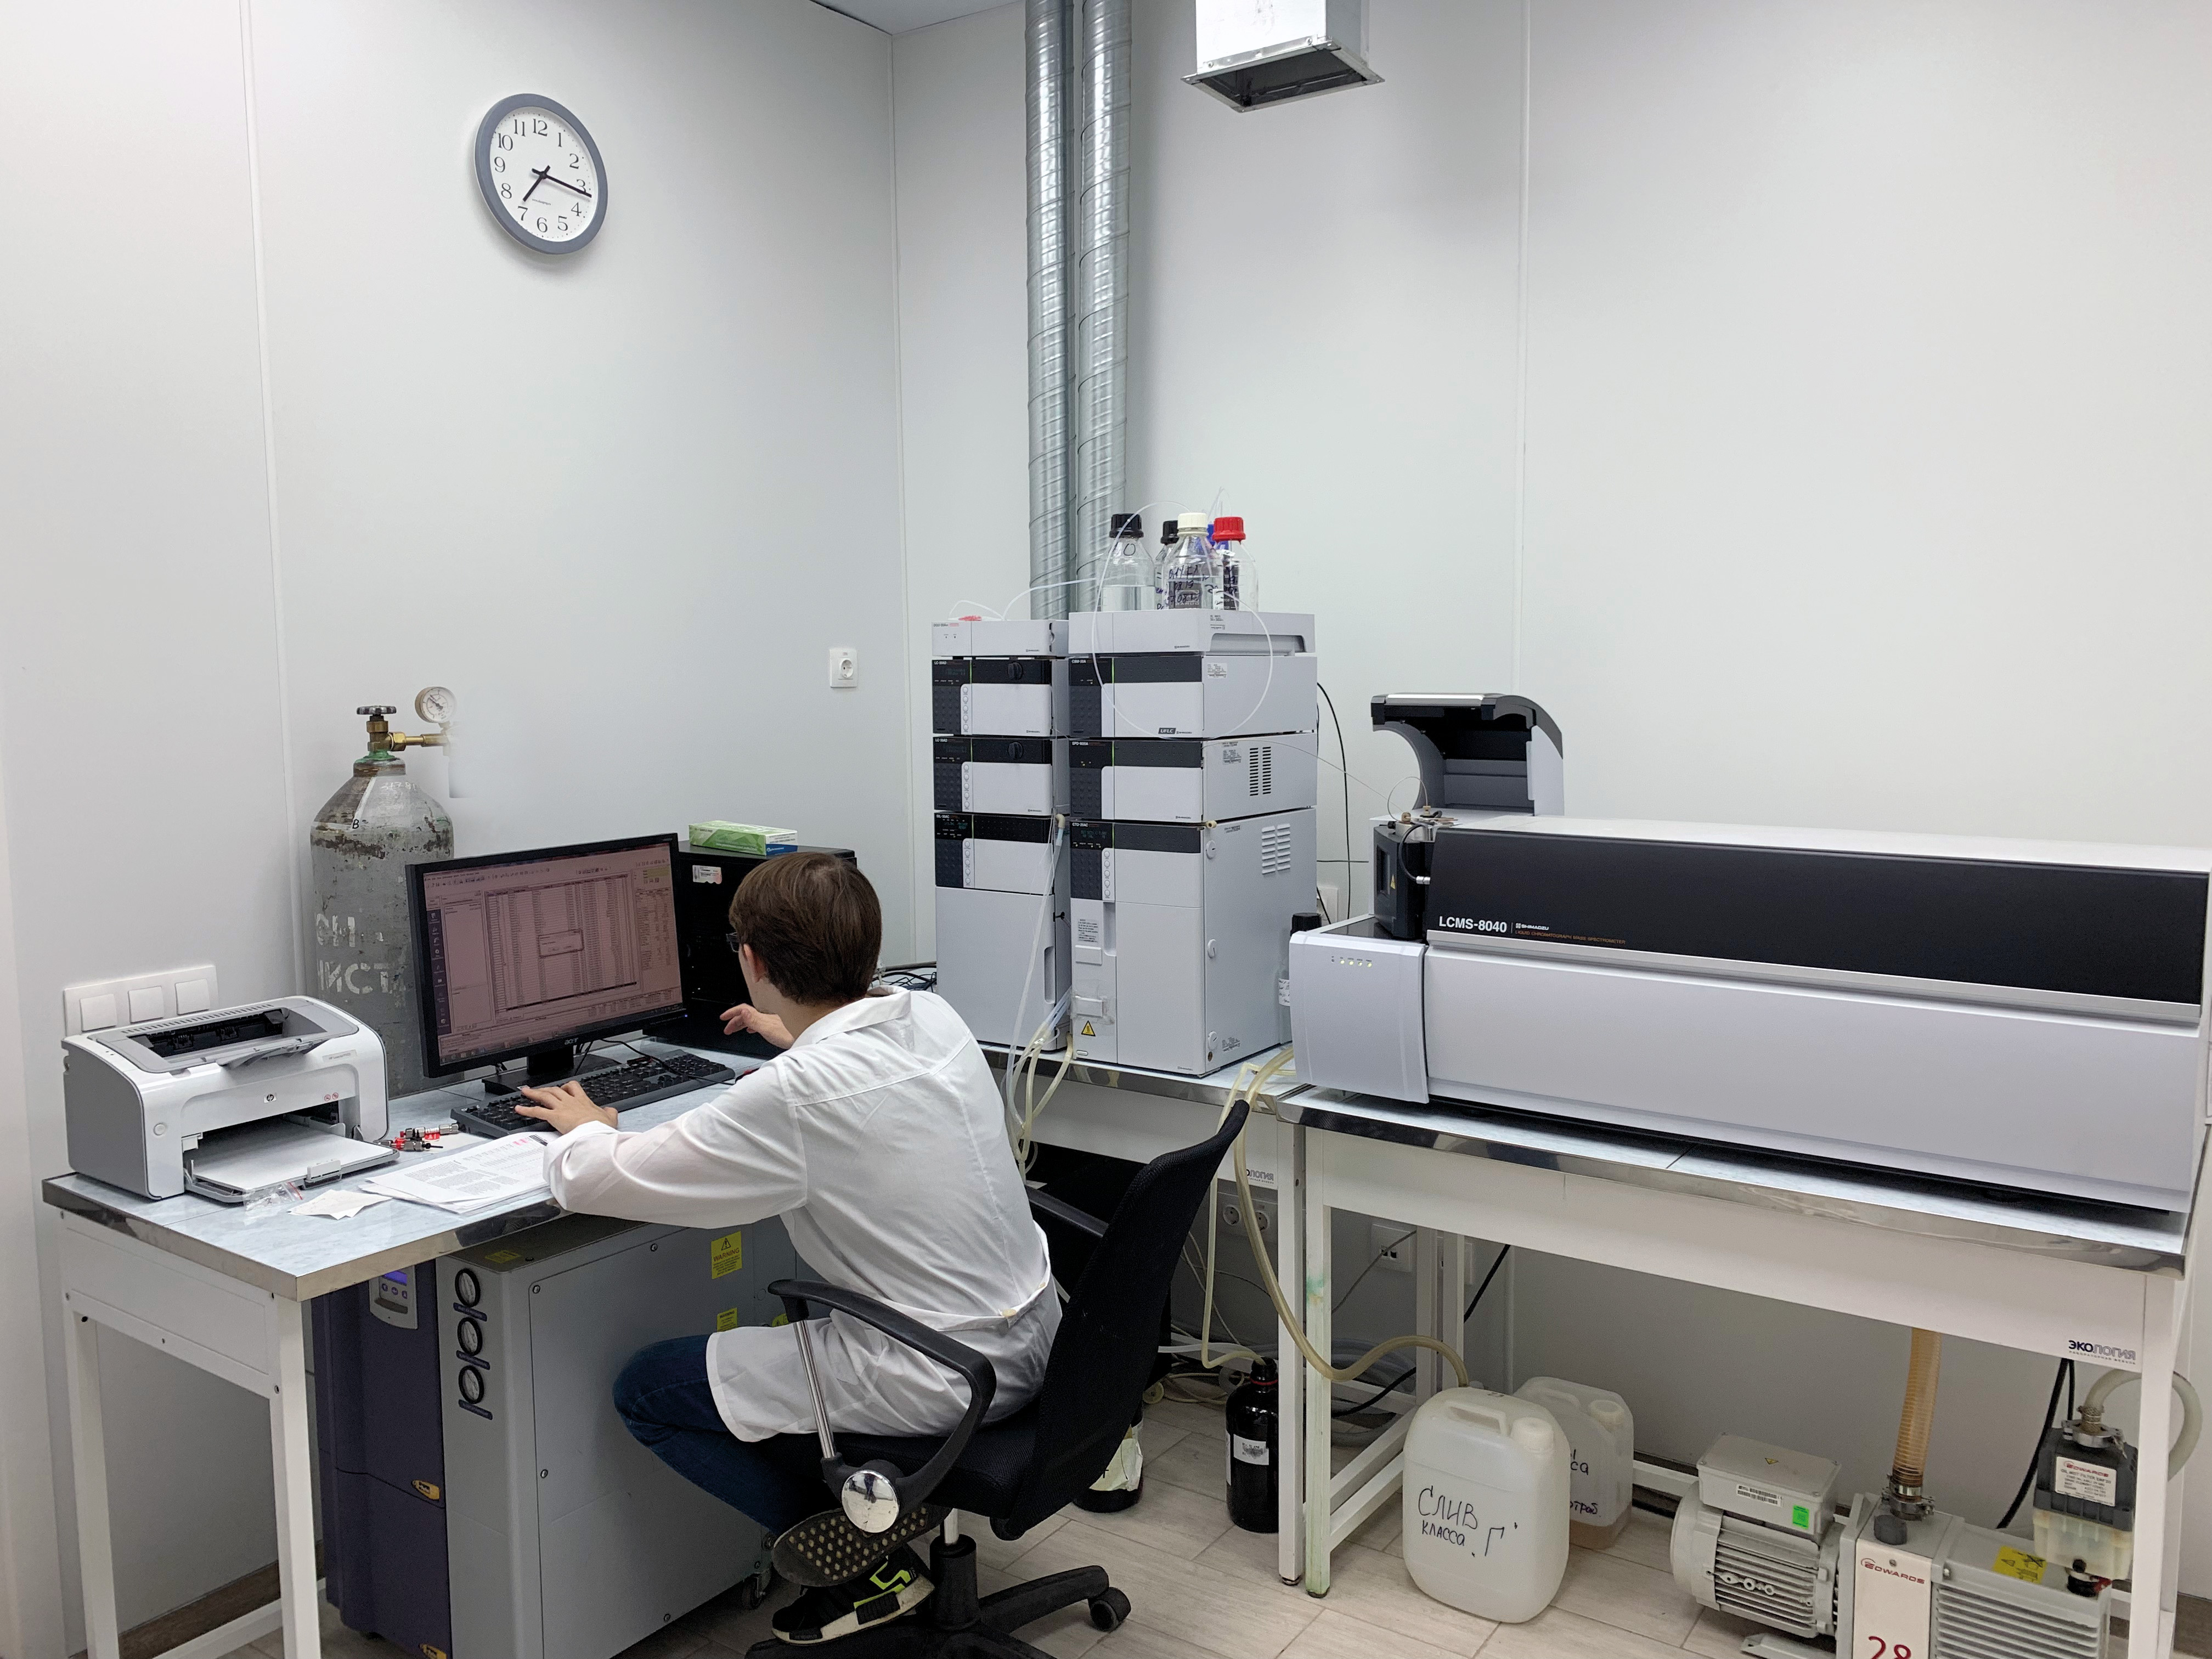 Figure 1: Shimadzu LCMS-8040 installed in the Pharmacokinetics Laboratory at the Moscow Hospital named after I. Davydovsky
Lately, some methods for TDM of several groups of drugs (anticoagulants, anticonvulsants, antihypertensive, hypoglycemic, anti-tumor) were developed in the laboratory (table 1) and many of them have been applied successfully in clinical practice.
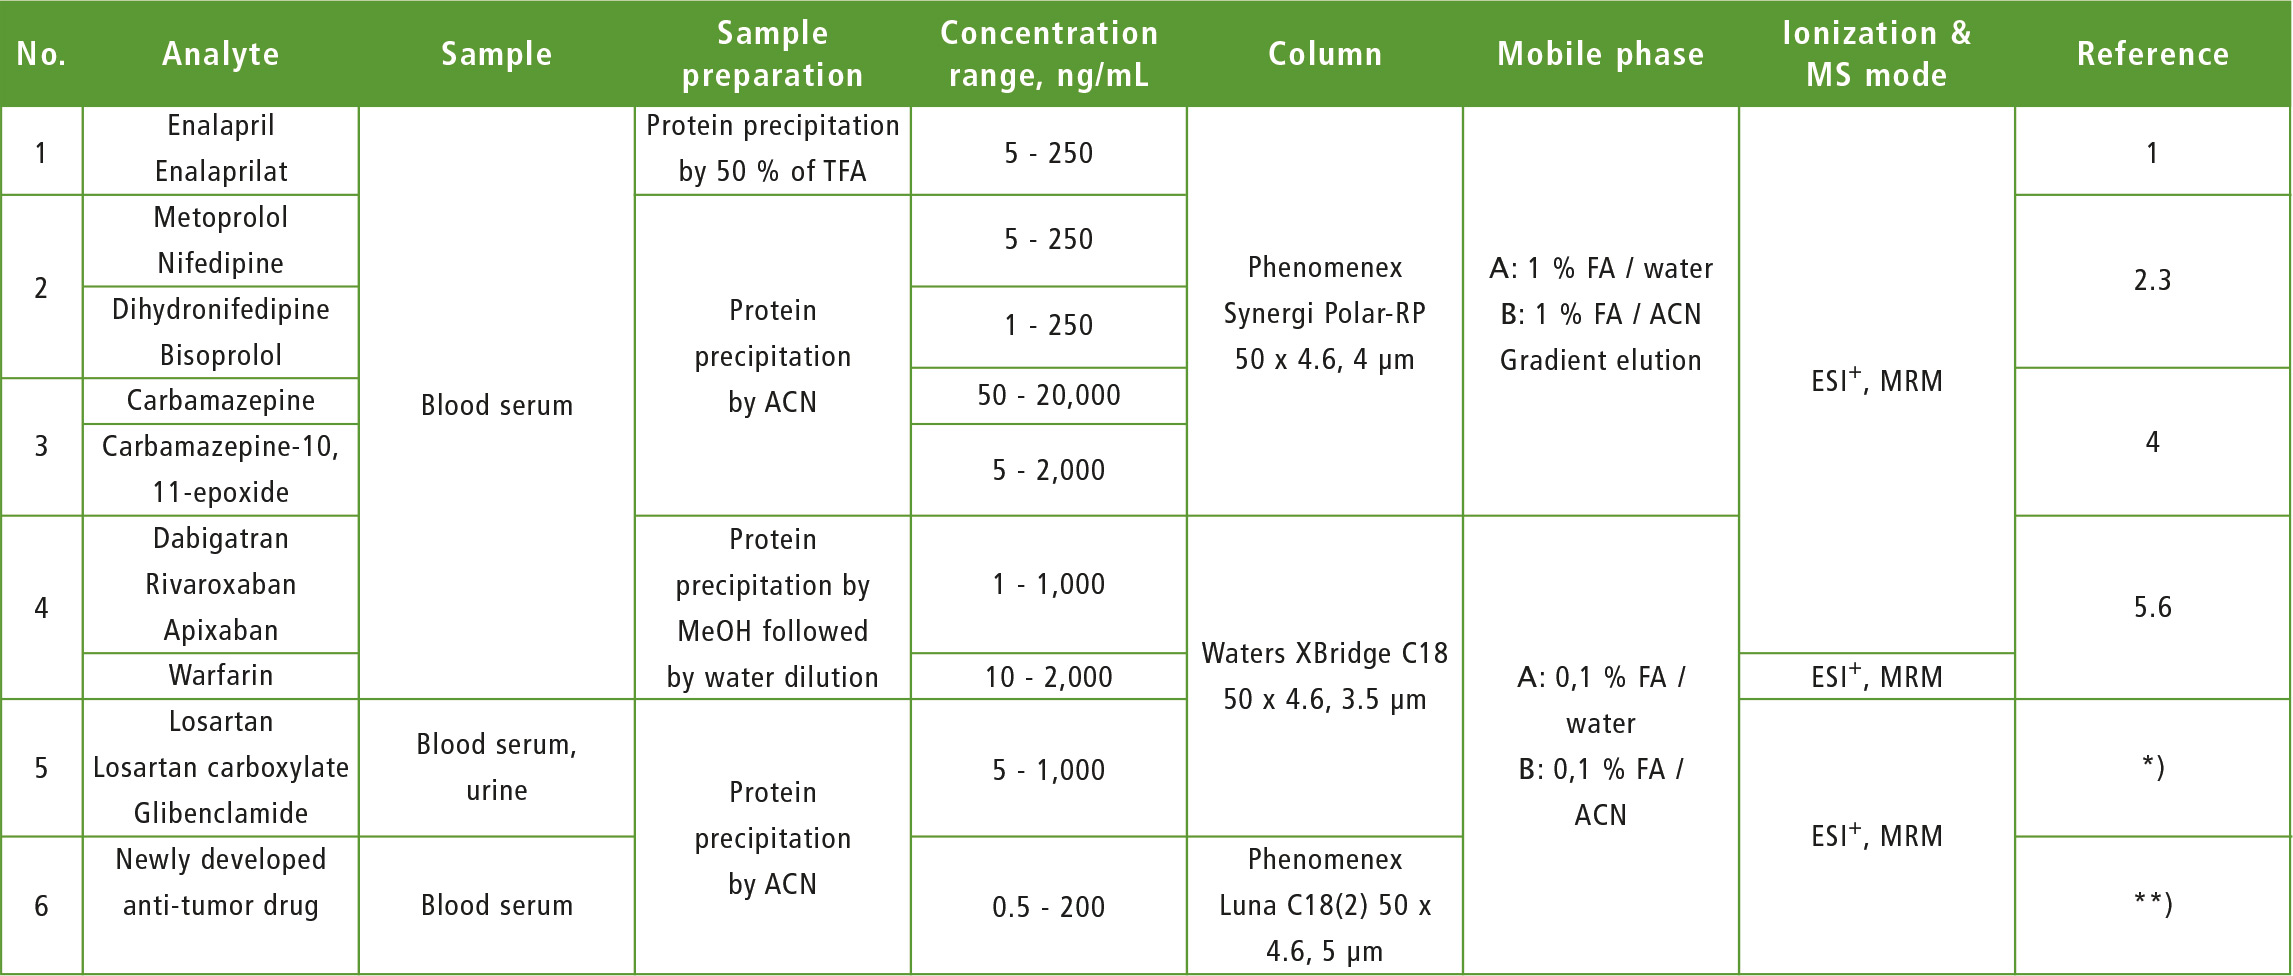 Table 1: Electrospray, positive mode, ESI-: Electrospray, negative mode, MRM: Multiple reaction monitoring, ACN: Acetonitrile, MeOH: methanol, FA: formic acid,
*): article in the press, **): research in progress
TDM also suitable for »simple« drugs?
As mentioned above, TDM is essential for drugs with a narrow therapeutic window, e.g. for carbamazepine. However, the practical work demonstrated that TDM might also be useful for “simple” medicines. For example, enalapril, a well known and widely used drug, is rarely used for monotherapy.
Often, patients take several antihypertensive drugs, and usually need to take additional medicines to relieve side effects. In such cases, it is difficult based on clinical signs only to determine whether side effects/treatment inefficiency are related to the drugs monitored, or induced by other factors.
Enalapril is a prodrug with a weak antihypertensive effect. Its active metabolite, enalaprilat, is formed due to hydrolysis by carboxylesterase. So, the intensity and duration of the hypotensive effect caused by enalapril are determined mostly by the rate of hydrolysis to enalaprilat. This rate may vary significantly from patient to patient. Hypotension and its complications are the highest risks during treatment with enalapril.
TDM helps make the right decisions
With correct dosage, concentration of enalaprilat in blood plasma should remain within the therapeutic window of 10 – 50 ng/mL, and the clinical effect persists up to 24 hours after taking the drug. However, in some cases it is difficult to achieve a stable decrease in blood pressure to the required level as individual patient metabolism (patient phenotype) is not taken into account when prescribing enalapril.
Patient metabolic activity relating to enalapril can be estimated by calculating the enalapril/enalaprilat concentration ratio in blood serum. The absolute value of enalapril concentration in serum is determined in parallel and compared with average (typical) values. The information obtained by TDM helps doctors to make the right decisions concerning dose/ frequency adjustment, cancellation or replacement of the drug if necessary.
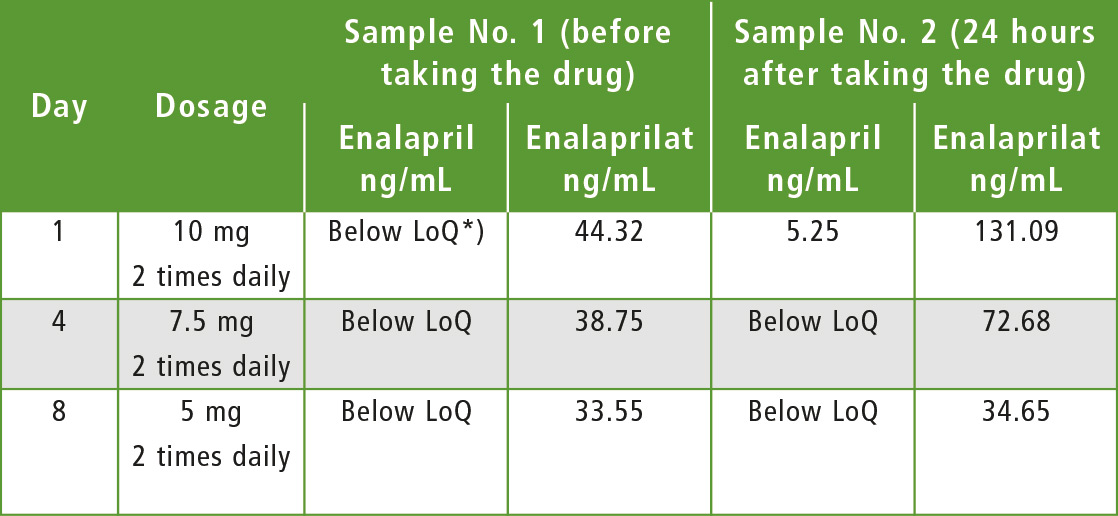 Table 2: Choice of therapeutic enalapril dosage for patient »G«
*) LoQ = Limit of Quantification
Patient G: lower risk of hypotension
The algorithm of choosing an individual enalapril therapy is illustrated by the following example. Male patient “G”, previously prescribed with 10 mg of enalapril twice daily, was taken to hospital. This prescription achieved the desired therapeutic effect, but TDM showed that the concentration of the active metabolite had increased in the patient’s blood.
Medicinal dose was reduced twice in the following days and each time the concentrations of enalapril and its metabolite were determined in blood. Measured concentrations turned to normal values, while the therapeutic effect remained the same as by initial prescription. TDM thus helped significantly to reduce the risk of hypotension. It is extremely difficult in practice to control how faithfully a patient follows doctor prescriptions. Often, treatment failure is not caused by poor drug quality or individual metabolism, but by weak patient commitment to treatment. This is not only a local Russian problem, but a general global problem.
This phenomenon can even be observed in hospitals. It is impossible to permanently monitor whether each patient took the required drug. TDM with mass spectrometer helps to fight this problem clearly and effectively. While a patient cannot be convicted of neglecting their own health, a chromatogram without peak of the drug even though the patient should have taken it, is strong evidence for doctors and gives the opportunity to take appropriate action.
Problem: low commitment to treatment
TDM of patients hospitalized for ischemic stroke and prescribed with anticoagulation therapy determined that about 40 % of acute conditions were caused by low commitment to treatment. The new oral anticoagulants and warfarin were either not found in serum samples of the patients or their concentrations barely exceeded LoQ (limit of quantitation). In other cases (about 6 % of examined patients), measured concentrations of oral anticoagulants exceed the average maximum values significantly. The dose for this group of patients was adjusted to eliminate any adverse reactions.
Patient L: avoiding adverse reaction
An important task of TDM is to control forced substitution of one anticoagulant for another, as in the case of male patient “L” diagnosed with chronic kidney disease (figures 4 and 5). The most common case is a substitute of warfarin for safer anticoagulant. A decrease of warfarin concentration with this replacement is slow (T1/2 of warfarin is about 40 hours), so careful adjustment of drug dosage is required to avoid adverse reaction due to synergism of both medicines. The number of patients who underwent anticoagulant substitution was approximately 10 % of the total number of patients monitored using anticoagulants TDM.
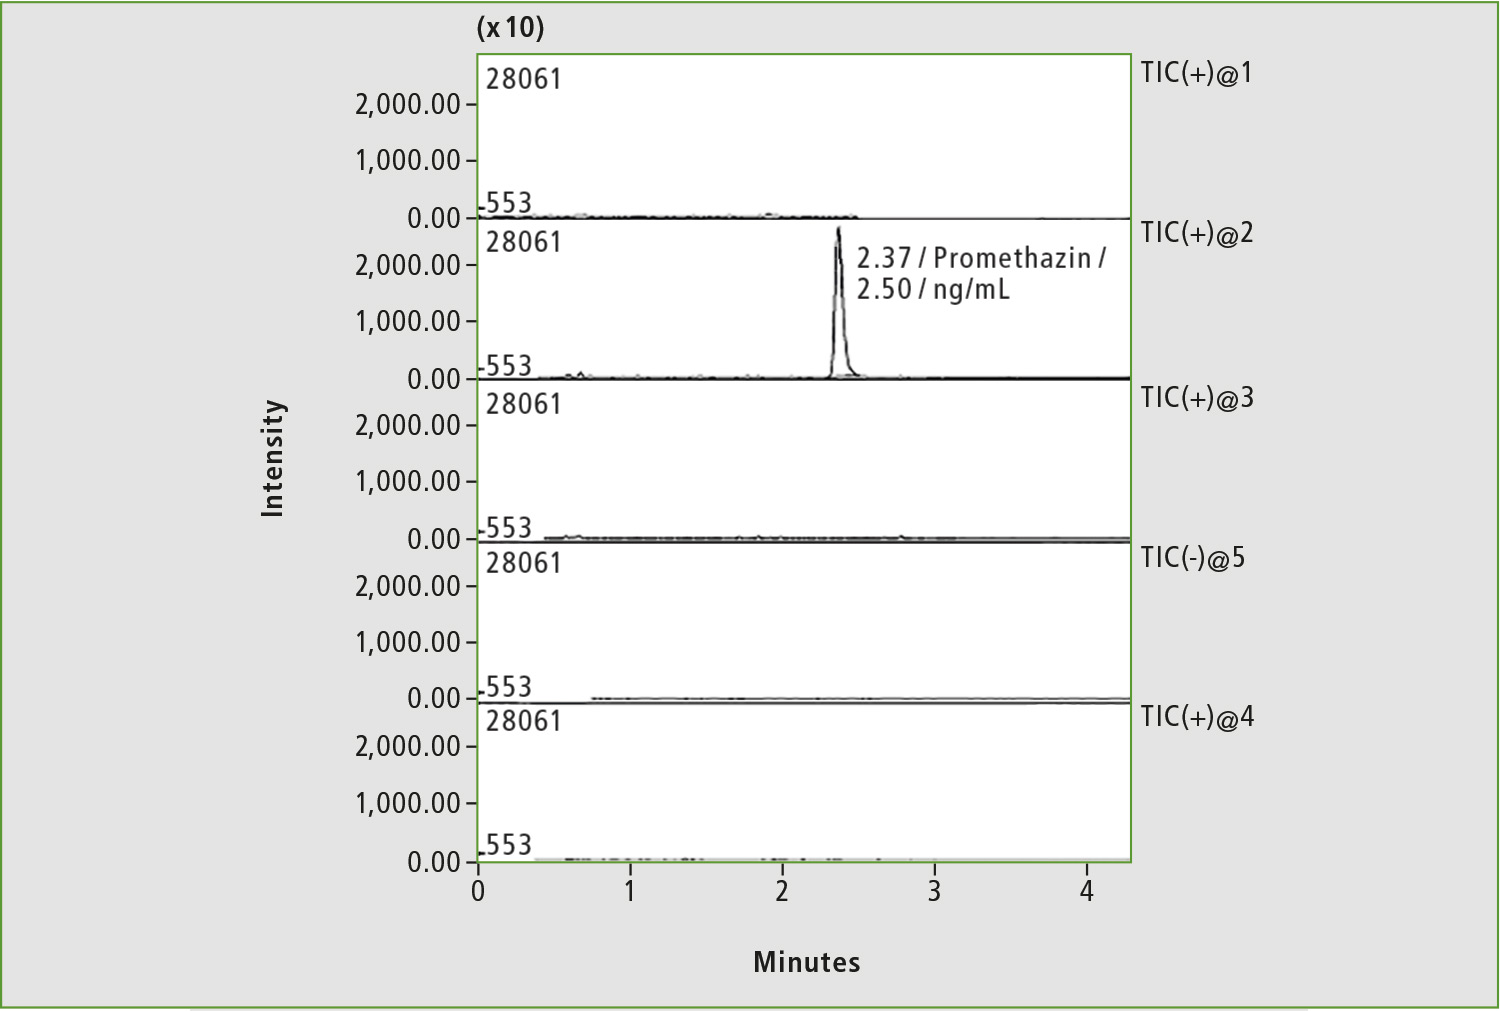 Figure 3: Chromatogram of blood sample of patient with low commitment to treatment by anticoagulants. Only the peak corresponding to the internal standard is present on the chromatogram.
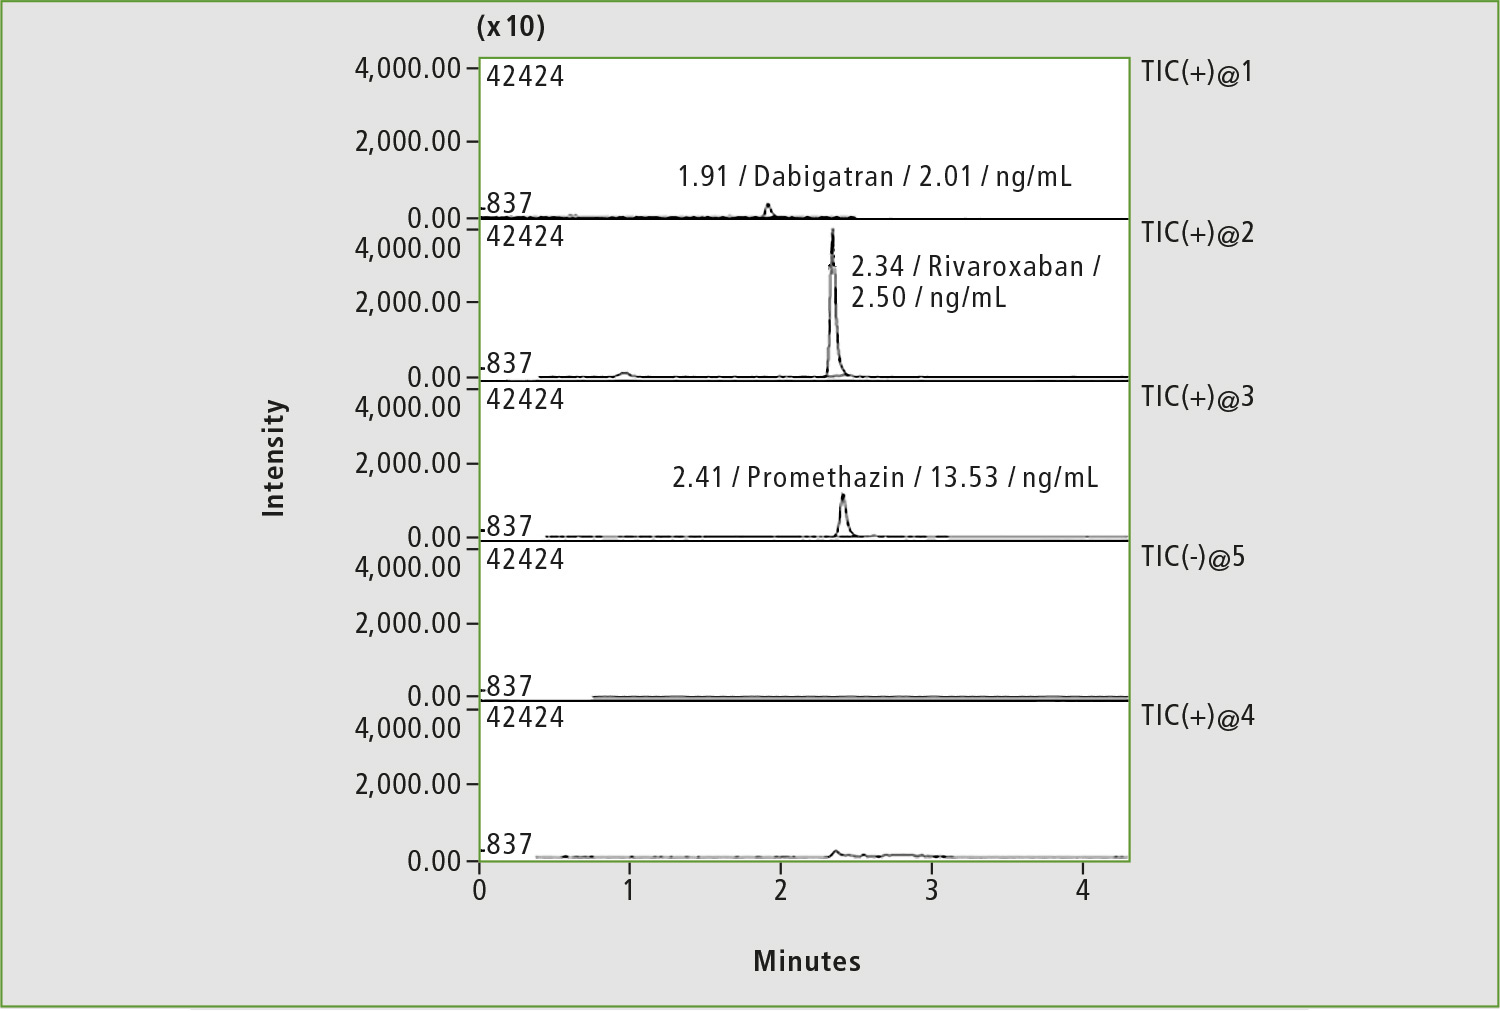 Figure 4: Chromatogram of a blood sample of patient »L« by substituting of dabigatran with rivaroxaban (before taking the drug)
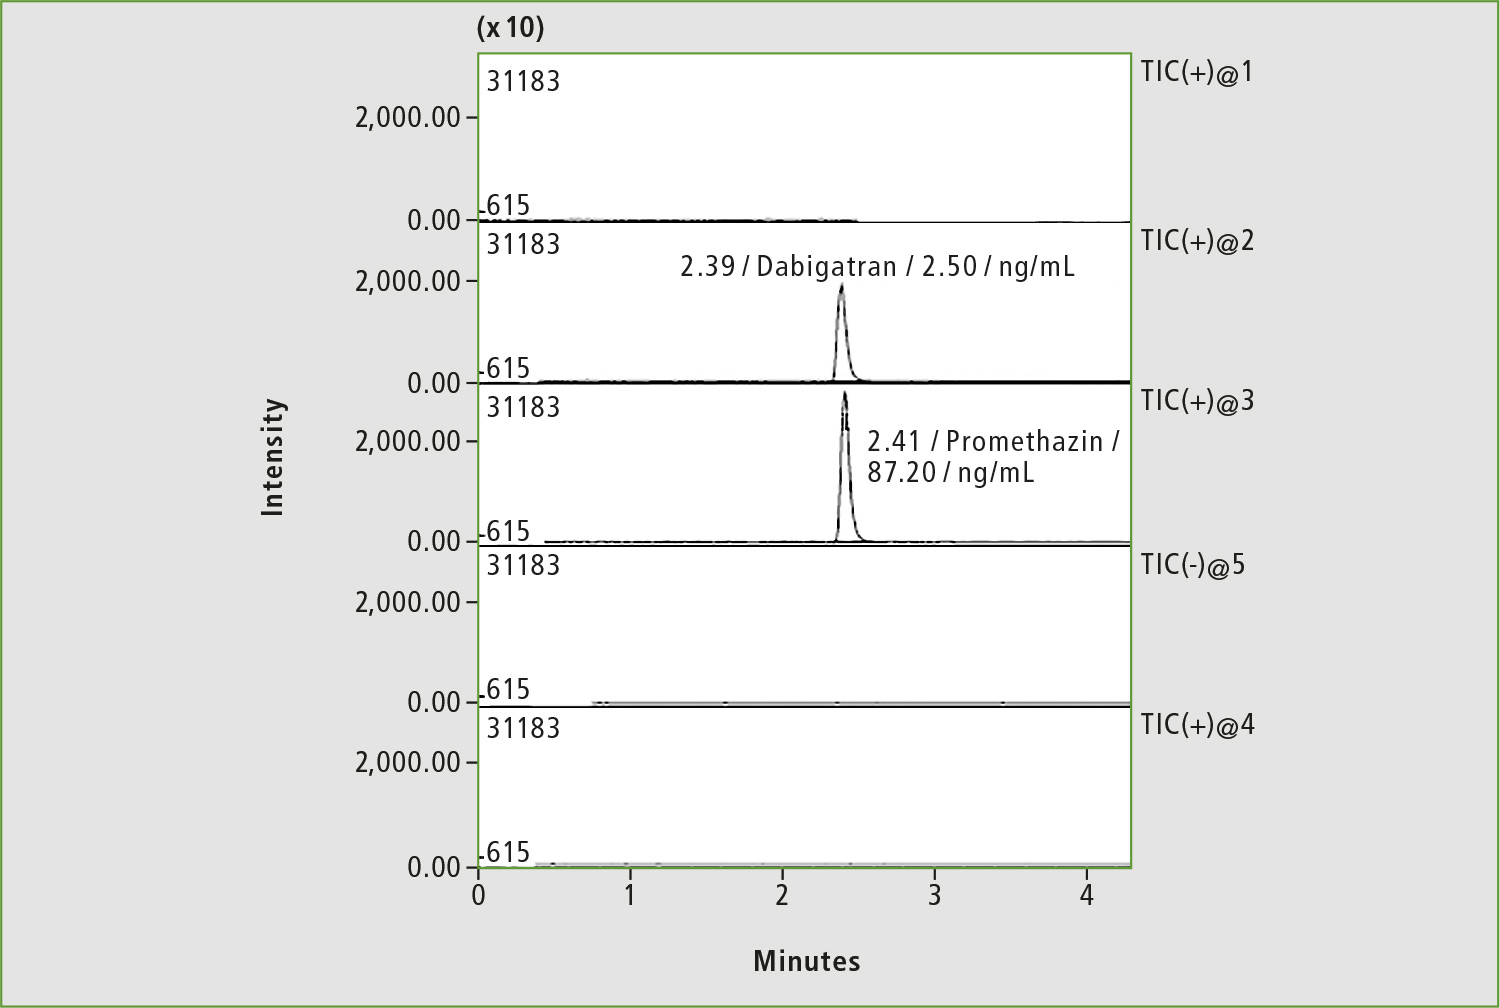 Figure 5: Chromatogram of a blood sample of patient »L« by substituting of dabigatran with rivaroxaban (4 hours after taking the drug)
Patient Z: adjusted dose stopped bleeding
An interesting case was observed for the female patient “Z”, taking rivaroxaban 15 mg twice daily to treat bilateral thromboembolism of the pulmonary artery. The patient suffered metrorrhagia against the background of simultaneous drug treatment and menstruation.
The first blood analysis was done about 19 hours after the last medication and rivaroxaban concentration was 47.7 ng/mL, a high level considering the time that had elapsed since the last medication (figure 6).
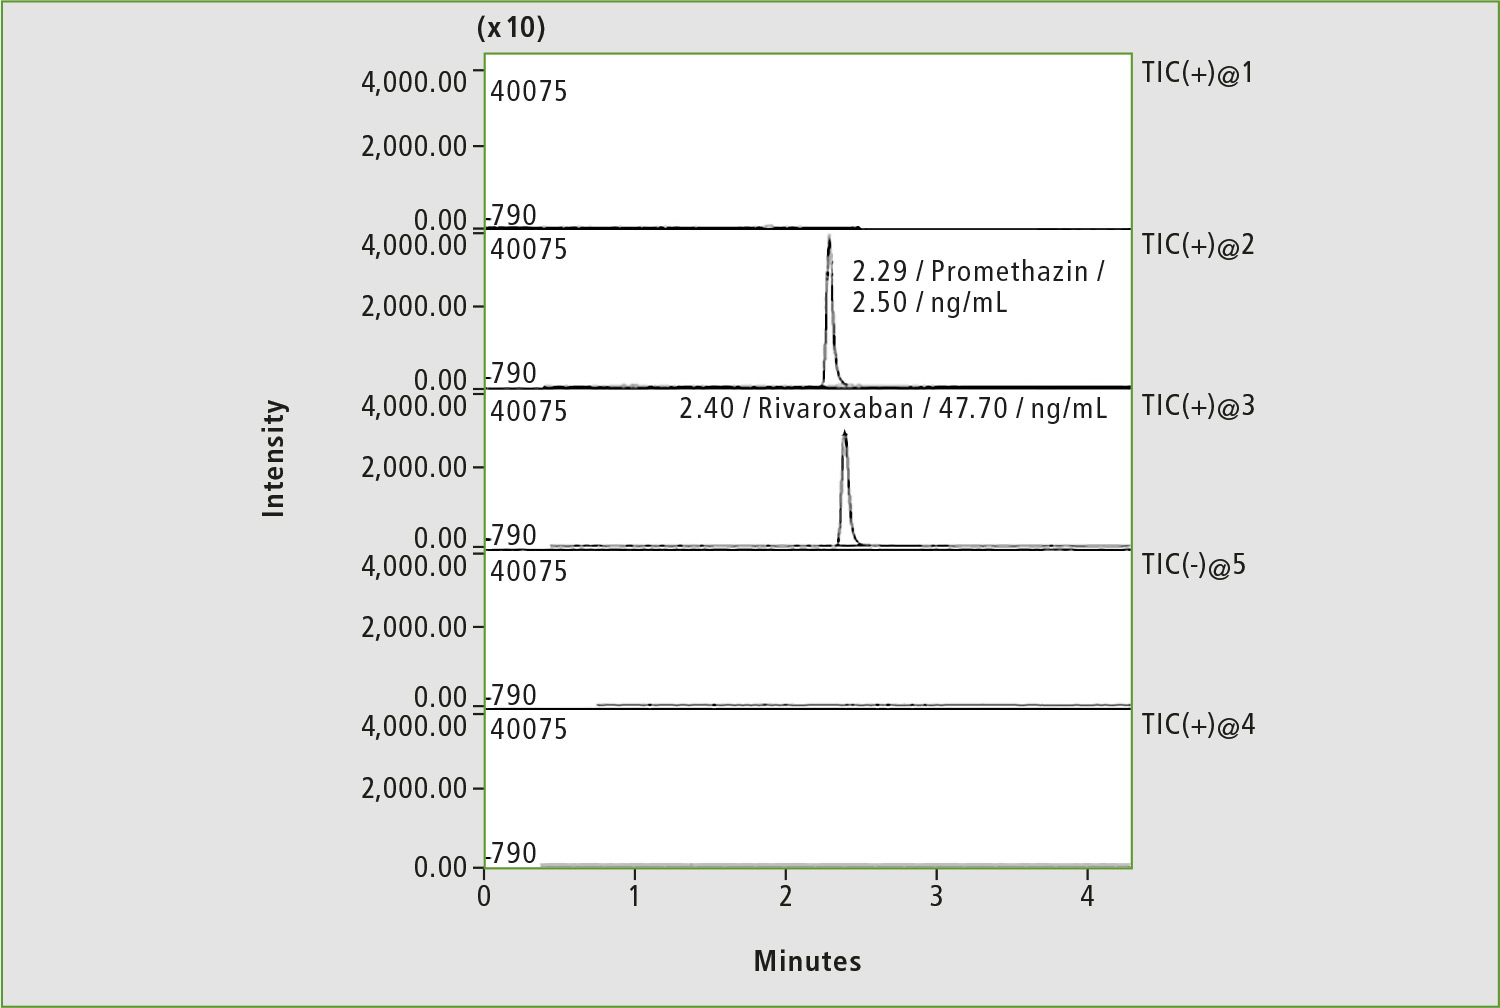 Figure 6: Chromatogram of blood sample of patient »Z« on the first day of the study of background of bleeding
 Figure 7: Chromatogram of blood sample of patient »Z« after adjustment of rivaroxaban dosage (before taking the drug)
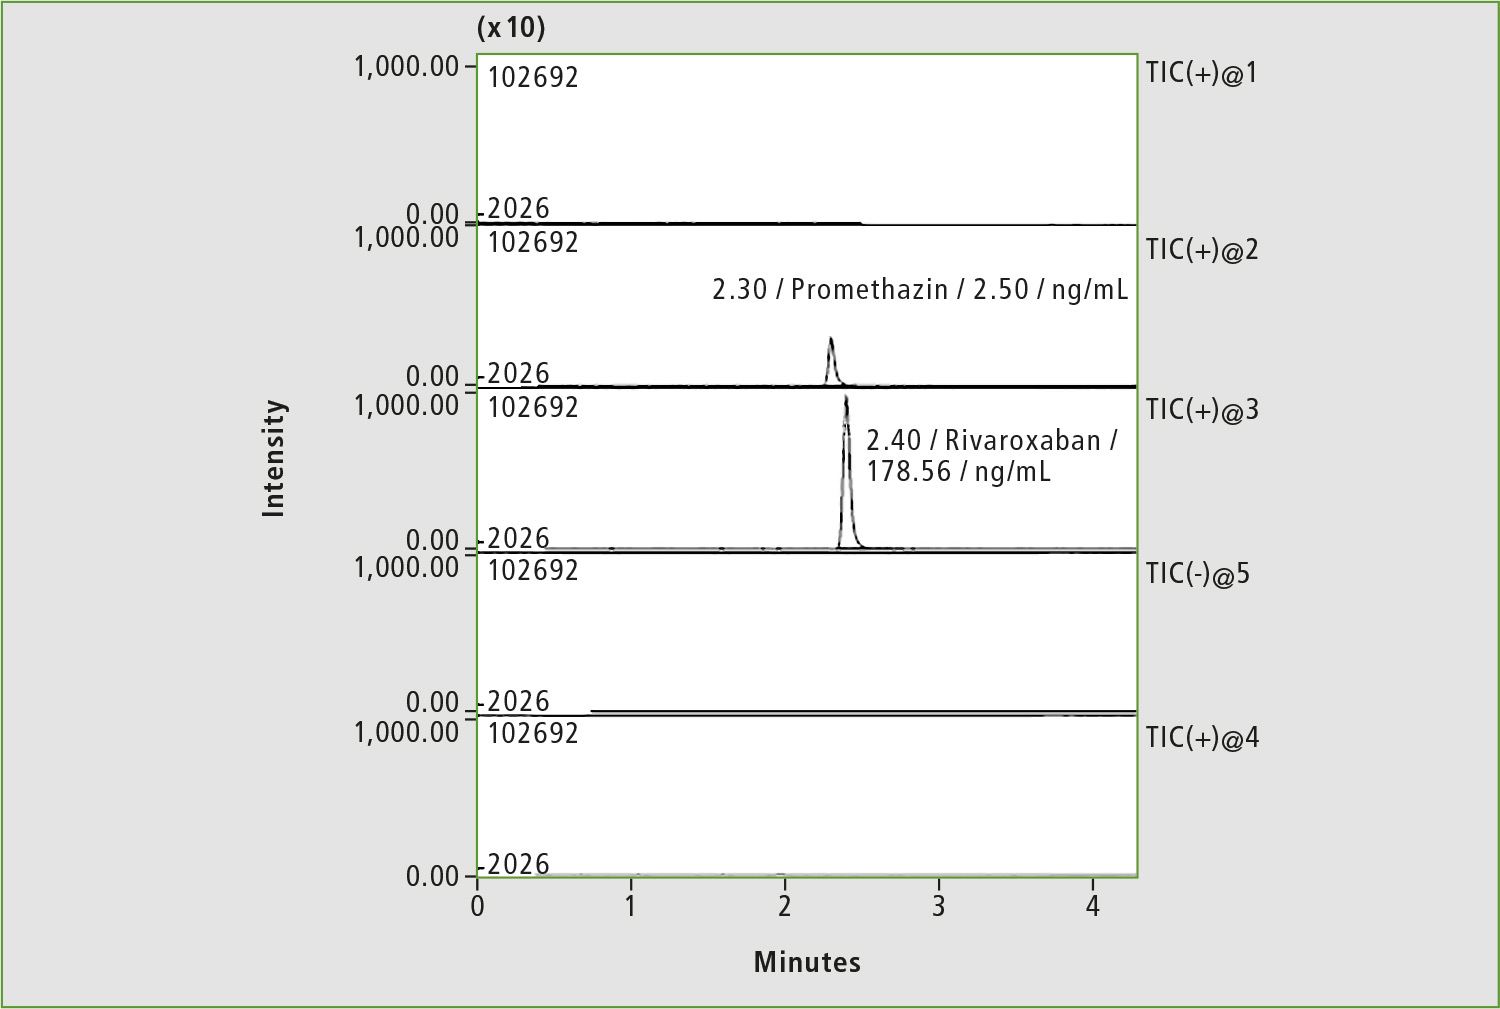 Figure 8: Chromatogram of blood sample of patient »Z« after adjustment of rivaroxaban dosage (4 hours after taking the drug)
A pharmacokinetic study was repeated two days later (the patient did not take the drug during this period), and rivaroxaban dosage was subsequently adjusted to 20 mg per day. Only traces of rivaroxaban were measured in serum before taking 20 mg of medicine (figure 7), whereas a concentration of 178.9 ng/mL was determined in the sample taken four hours after first medication with 20 mg (figure 8). The last concentration may be considered as a normal level. Adjustment of the rivaroxaban dose led to the patient no longer suffering from bleeding.
Authors
Tatiana A Rodina, PhD in Chemistry, the senior chemist, Pharmacokinetics Laboratory of the Moscow Hospital named after I. Davydovsky
Dr. Eugeny S Melnikov, PhD in Chemistry, the chemist, Pharmacokinetics Laboratory of the Moscow Hospital named after I. Davydovsky