Exact measurement of color
New software for color determination in the industrial sector with direct control using Shimadzu’s UV-VIS spectrophotometers
Color can be of decisive significance for the marketing success of a product. Especially when using natural or recycled raw materials with fluctuating chemical composition, color can vary strongly – for instance in the production of packaging glasses. Continuous and objective control of the color effect is therefore an essential precondition for an unchanging and reproducible quality.
Color measurement
Color is a not just physical characteristic of materials but rather a sensory perception that is strongly dependent on environmental conditions (especially on lighting) and the observer (human). Color is perceived, so to speak, in the eye of the observer. For objective determination of color values, the spectral sensitivity of the human eye for the three primary colors red, green and blue (there is a corresponding number of sensory cell types in the retina) was determined by empirical experiments in the 1930’s, and the CIE Color Space was published by the International Commission on Illumination. To this day, these so-called color-matching functions have been the basis for color determination according to ISO 11664 and other standards.
For the calculation of color values, a suitable spectrophotometer (for instance Shimadzu’s UV-1800) was used to record a transmission or a reflection spectrum (depending on the application) in the visible range of the electromagnetic spectrum (380 to 780 nm). This spectrum is subsequently weighted against a standardized light source (D65 for daylight or A for incandescent light) in order to take into account the influence of the illumination. Subsequently, the spectrum is successively weighted against the three CIE color-matching functions to determine the red component (X), the green component (Y) and the blue component (Z) of the spectrum. Using these three values, any color can be unequivocally characterized.
In practice, however, the tristimulus values X, Y and Z are usually not applied directly. Instead the CIELAB system, in which color perception is specified by the three values L* (brightness), a* (red-green ratio) and b* (blue-yellow ratio) has become established. These values, however, are mathematically derived from the tristimulus values X, Y and Z so that the information content is the same. Alternatively, the CIExy system in which color perception is expressed by three values DWL (dominant wavelength), S (saturation) and A (brightness) is still applied in many industrial sectors. But these values are also based on the tristimulus values X, Y and Z.
Industrial practice
In industrial production processes, color is usually determined at random on the basis of representative samples. Color measurement is often carried out in an on site laboratory, but more frequently color determination is moving closer to the production line, in order to be able to react faster in case of color deviations. Personnel, which has been specially trained for this task, is often not available at the production line, whereby the demands on the software significantly increase. The software must be easy to use, fast to operate and must be able to rule out operating errors as well as possible. In order to recognize trends quickly and to be able to immediately intervene, statistical evaluation in the form of quality control charts is indispensible. The data should, therefore, be automatically transferred to an on site data acquisition system. Ideally, the software itself features an integrated database and corresponding evaluation options.
Color measurement using Chroma
The Chroma software was developed to fulfill the above requirements in routine analysis. The principal feature of the software is the clearly structured user interface that is tailored to the workflow and user roles. All required measuring parameters for the measurement are summarized in so-called methods (figure 1). Prior to measurement, only the missing sample parameters must be added – for example the sample thickness for transmission measurements. The transformations defined in the method, such as conversion to a fixed standard thickness, are already taken into account during the measurement and the corrected spectrum is displayed in addition to the raw spectrum.
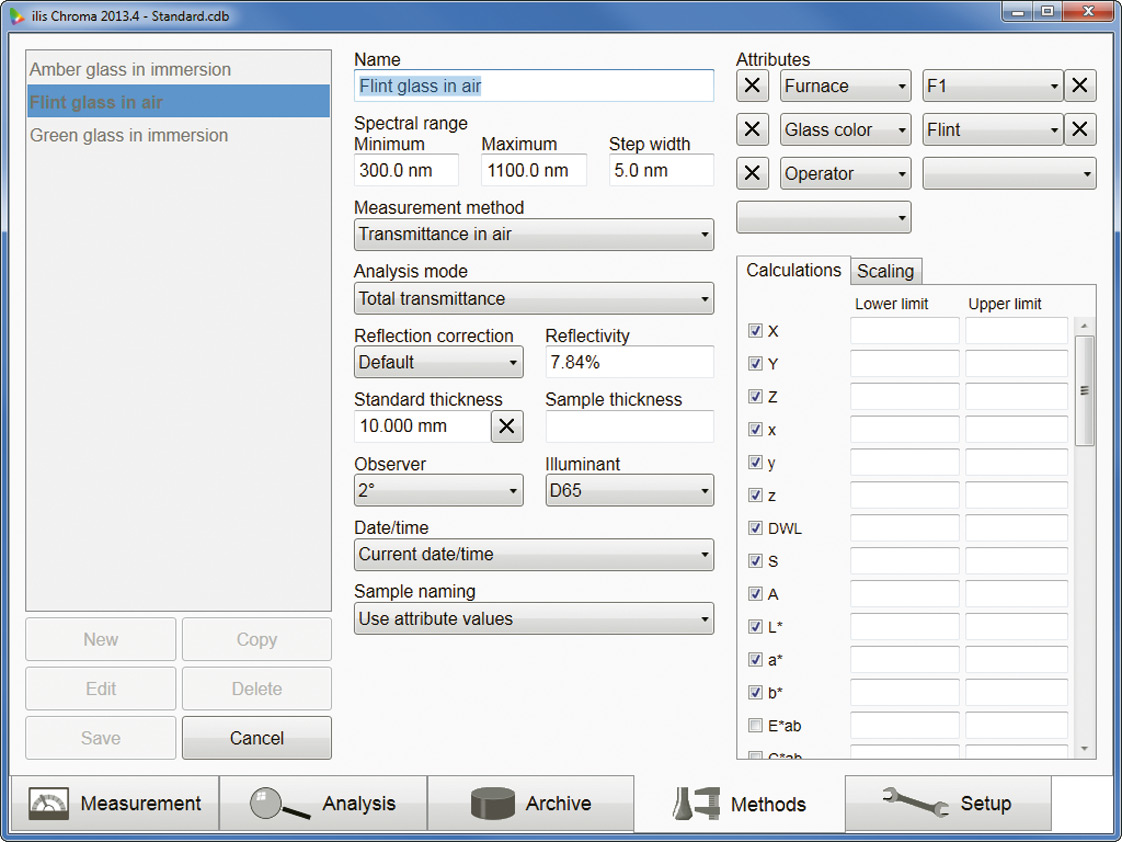 Figure 1: All measurement parameters necessary for measurement are summarized in methods
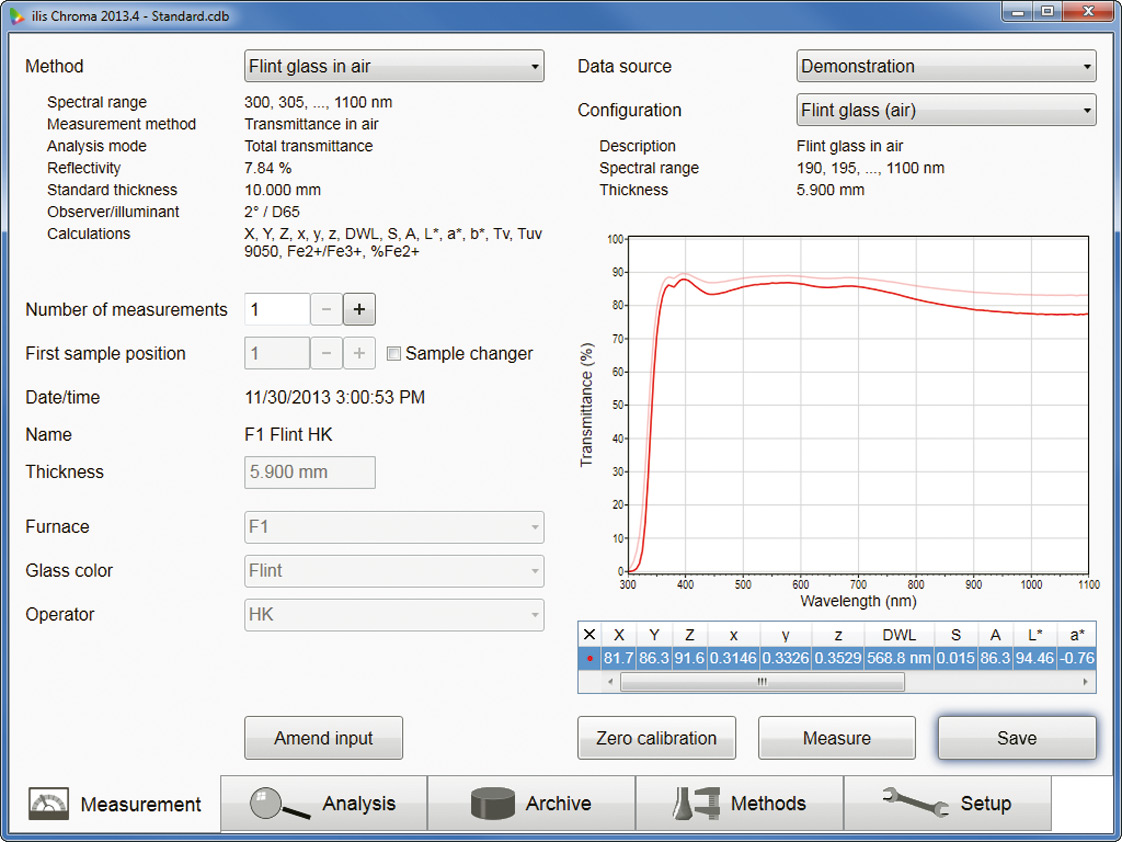 Figure 2: During measurement, the corrected spectrum is displayed in addition to the raw data
After data storage the user is automatically directed to the analysis mode, in which all results are expressed in terms of numbers and graphs (figure 3). Here, the possibility exists to print the results or to export them to other programs for additional processing. Furthermore, certain parameters can be modified later on in the analysis mode, without affecting the results that are already stored in the database.
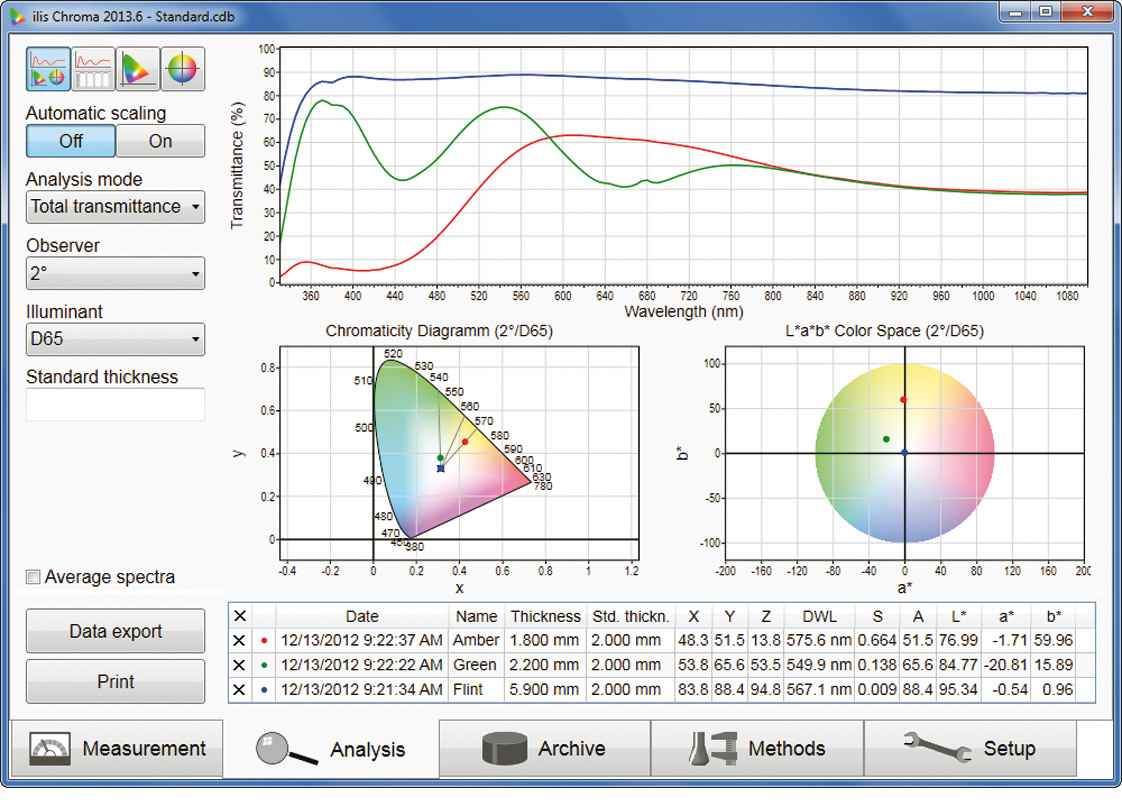 Figure 3: In the analysis mode, all results are numerically and graphically displayed in a well-organized manner
All measurement results in the Chroma software are archived in an integrated database and can be retrieved and evaluated at any time. To organize the measurements, it is possible to define any attribute according to which can be filtered in the archive (figure 4).
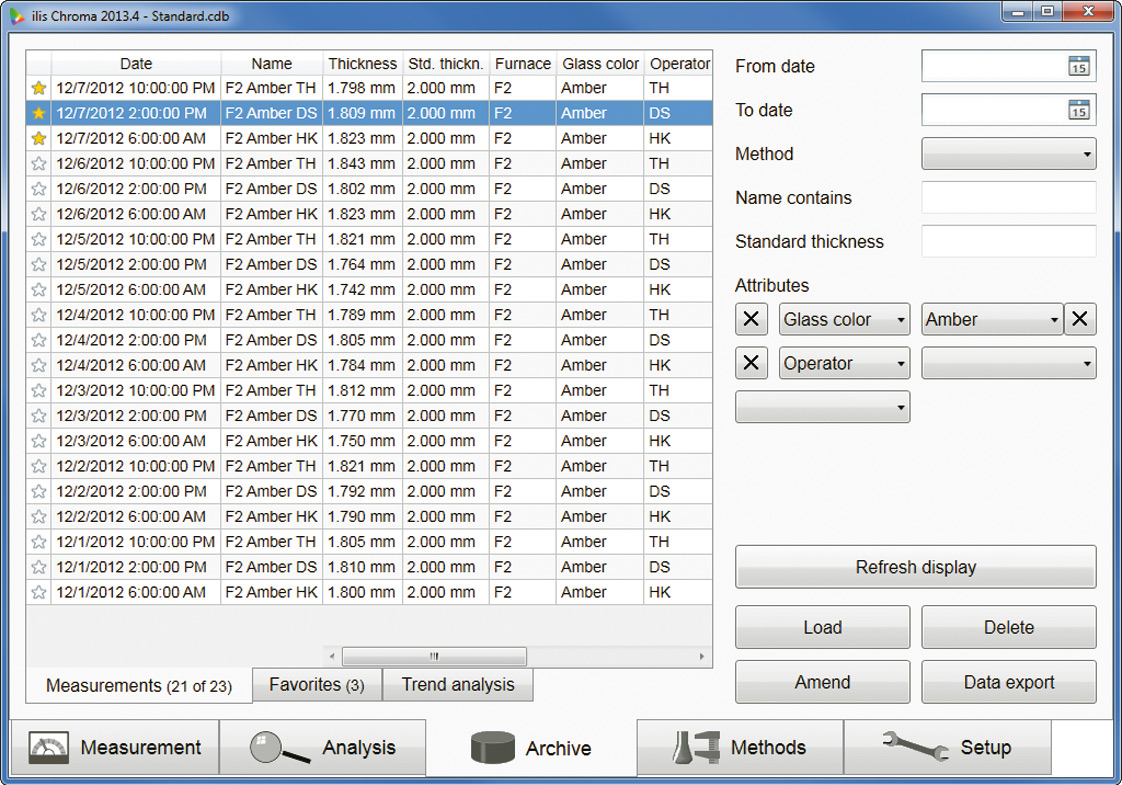 Figure 4: All measurement results are archived in an integrated database
Alternatively to display in tabular format, the data can also be graphically displayed in the form of trend diagrams (figure 5). This way, it is possible to easily recognize trends in the development of certain color values and to take suitable measures.
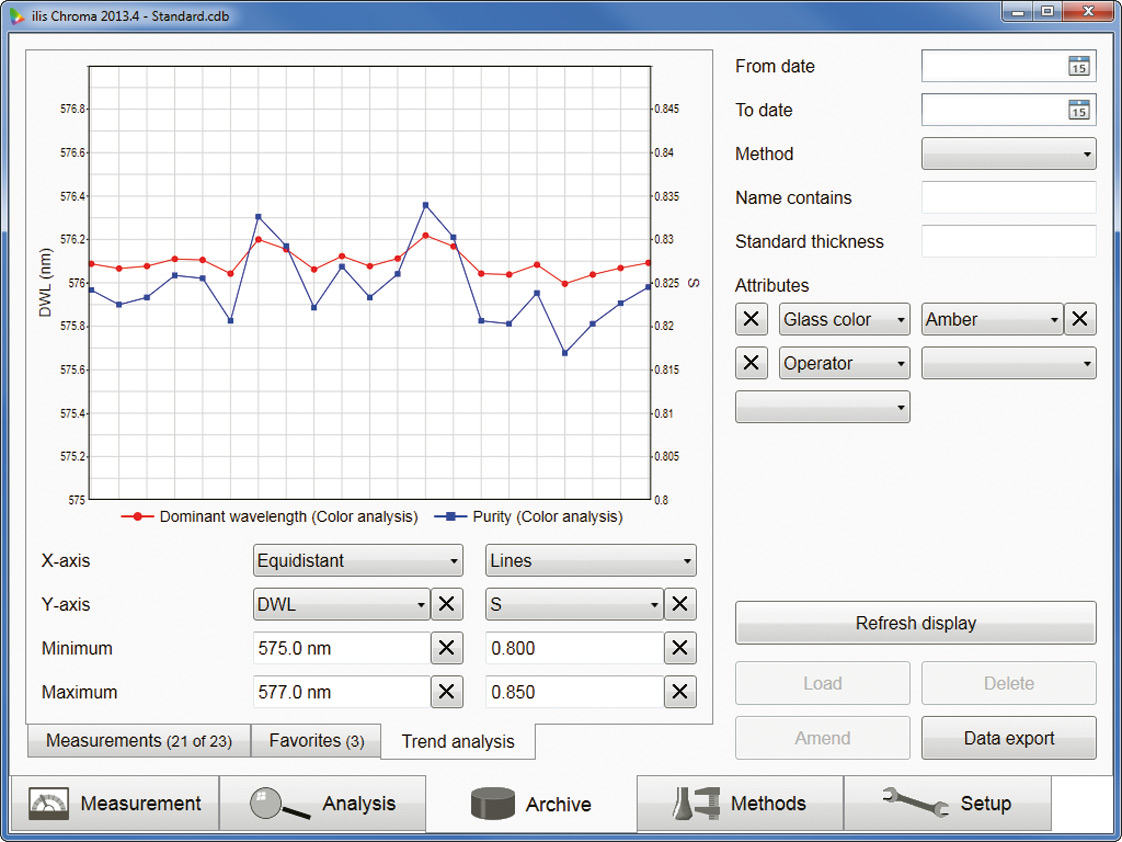 Figure 5: The trend view shows the development over time of a selected color value
Summary
Using the Chroma software package and a Shimadzu UV/VIS spectrophotometer, spectral characteristics of glasses and other materials can be accurately determined and color values can be calculated and graphically displayed. Chroma combines measurement and evaluation with a high-performance database in which all results are stored in a structured manner. Chroma fulfills the requirements in routine analysis and quality control and meets the highest demands in research and development through its flexible evaluation options and statistical functions. Chroma is always intuitive, simple and reliable to use.
Author:
Henning Katte, ilis GmbH Erlangen