The glowing lemonade
Quantitative fluorescence analysis of quinine flavor in various preparations
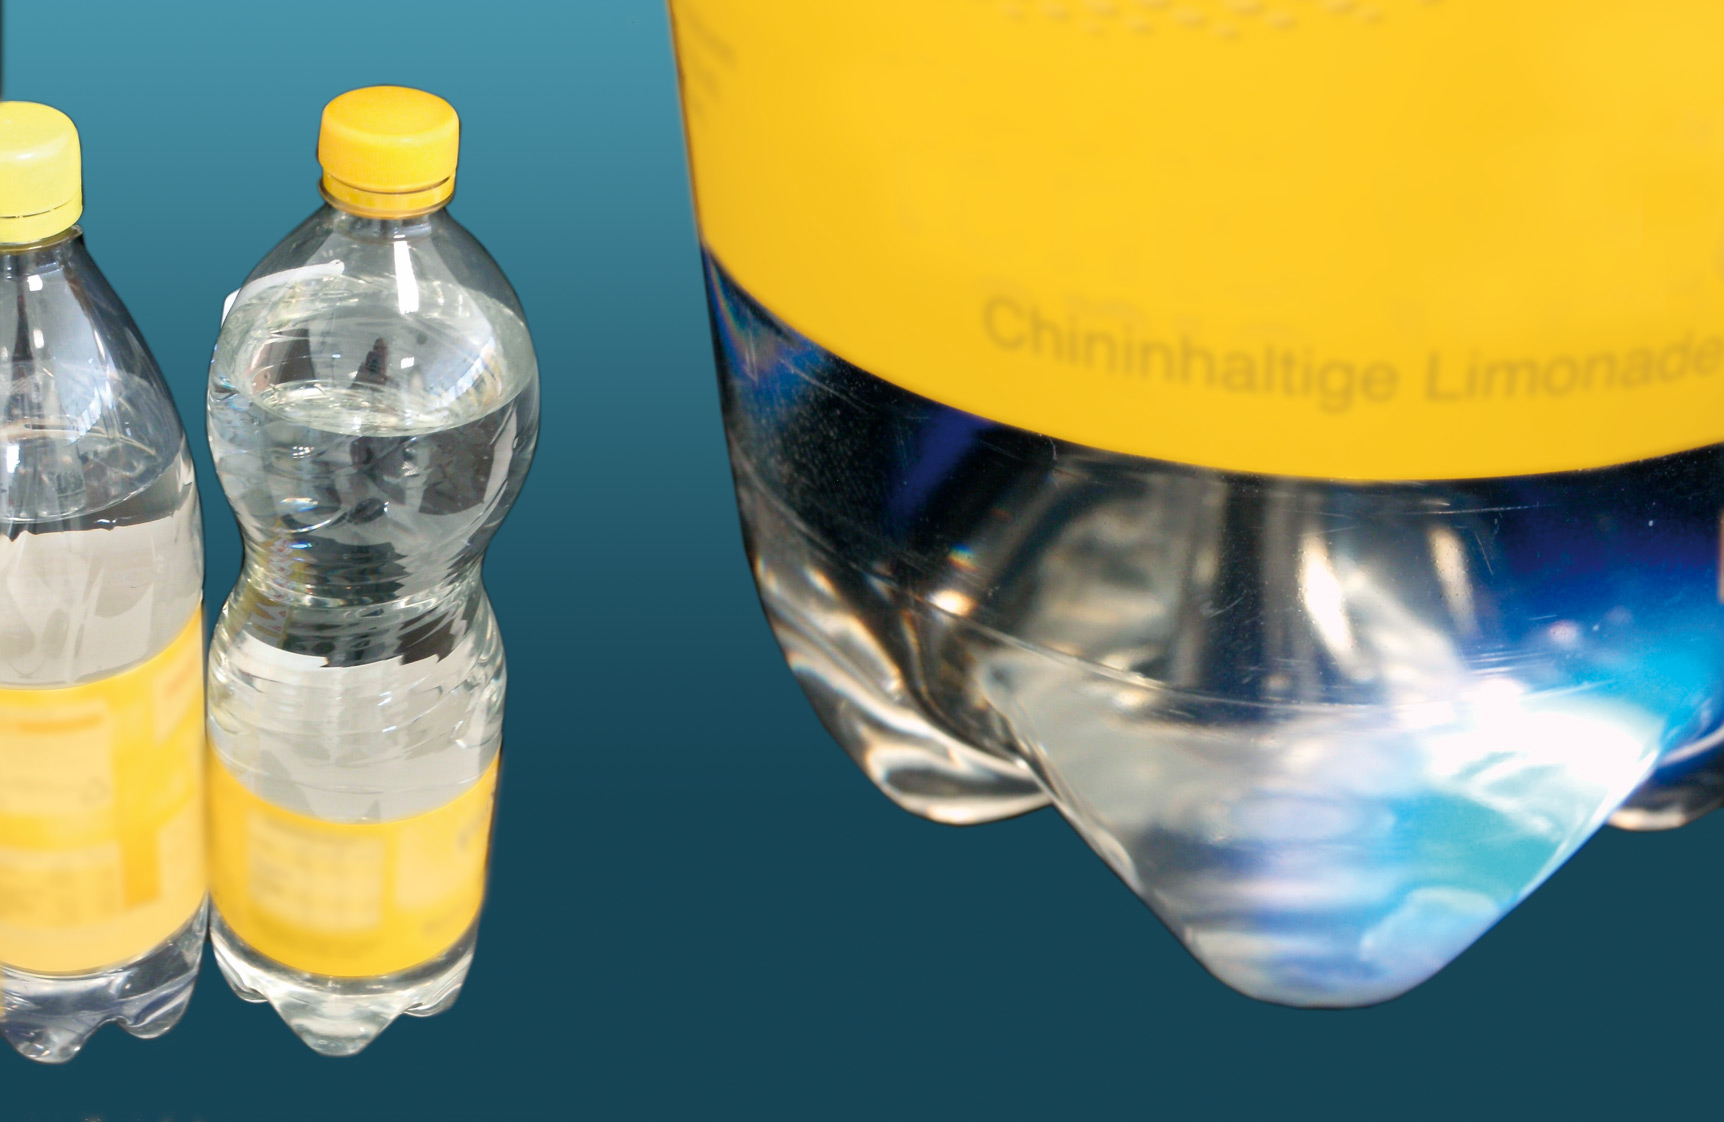 Figures 1a and 1b: Bottles of tonic water under normal light conditions on the left, and a bottle showing fluorescence phenomenon
The classic of fluorescence spectroscopy, which almost everyone has seen, is a drink that glows in black light. This glow of tonic water or bitter lemon sodas can be attributed to quinine. Its luminosity, the fluorescence, is so intense that it can be used as a fluorescence standard.
What is quinine?
Chemically, it is an alcohol 1-(6-methoxyquinolin-4-yl)-1-(5-vinyl-1,4-ethanopiperidin-2-yl)methanol having the empirical formula C20H24N2O2. The corresponding structure shows a ring system with an aromatic part that is, among other things, the cause of fluorescence. In simple terms, the ? electrons of the double bonds can be stimulated with a high-energy light source (short wavelength – UV radiation). With the energy absorbed, the electrons leave their energetic ground state and after a short time they return to it, emitting the absorbed energy (fluorescence).
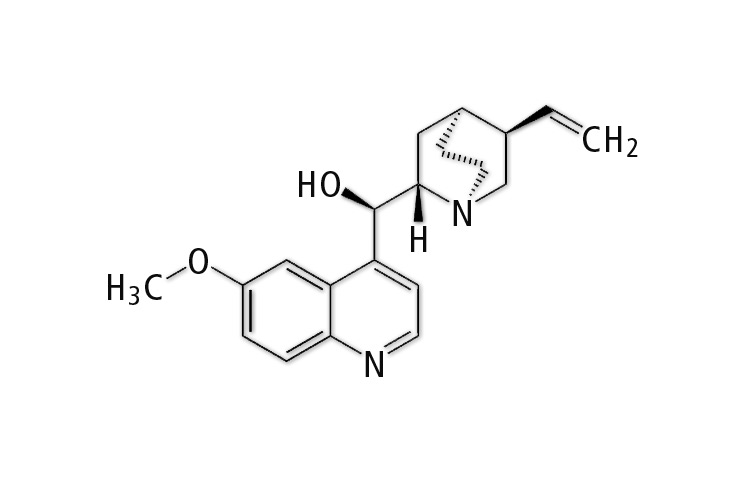 Figure 2: Sketch of the quinine structural formula
This white crystalline solid – quinine for short – was discovered in the 17th century as a medicine to treat malaria. Since that time, about 300 mg of quinine has been and continues to be used for a medical dose.
Historically, the colonialists working in malaria areas created „tonic“ water or „bitter lemon“ beverages to proactively protect from malaria. These drinks are still offered today. For example, an average of 70 mg/L quinine is used for tonic water and 30 mg/L for bitter lemon.
Much like the taste of a grapefruit, quinine brings the bitter/harsh taste to the drink. Due to changes in consumer behavior, the self-production of beverages is a way for consumers to come into contact and work with quinine. This flavor, bottled in small vials, is available on the market.
Fluorescence behavior of quinine
In this application, it will be shown how the fluorescence behavior of quinine under different fluid environments can be changed and quantified.
Fluorescence spectroscopy is selective. A substance can be determined out of a mixture. Nevertheless, the environment of the mixture (here: solution) to be determined needs to be taken into account. The fluorescence of liquids depends on the temperature, the concentration of the fluorophore, the solvent and the pH of the solution [1]. Bitter lemon and tonic water from the supermarket, declared as quinine-containing drinks, and a tonic water flavor for making sodas were analyzed.
The tonic water flavor used is said to contain 6 % quinine, water, alcohol, aroma extract and natural flavors. Due to the high concentration of quinine, the flavor was diluted 1:50,000.
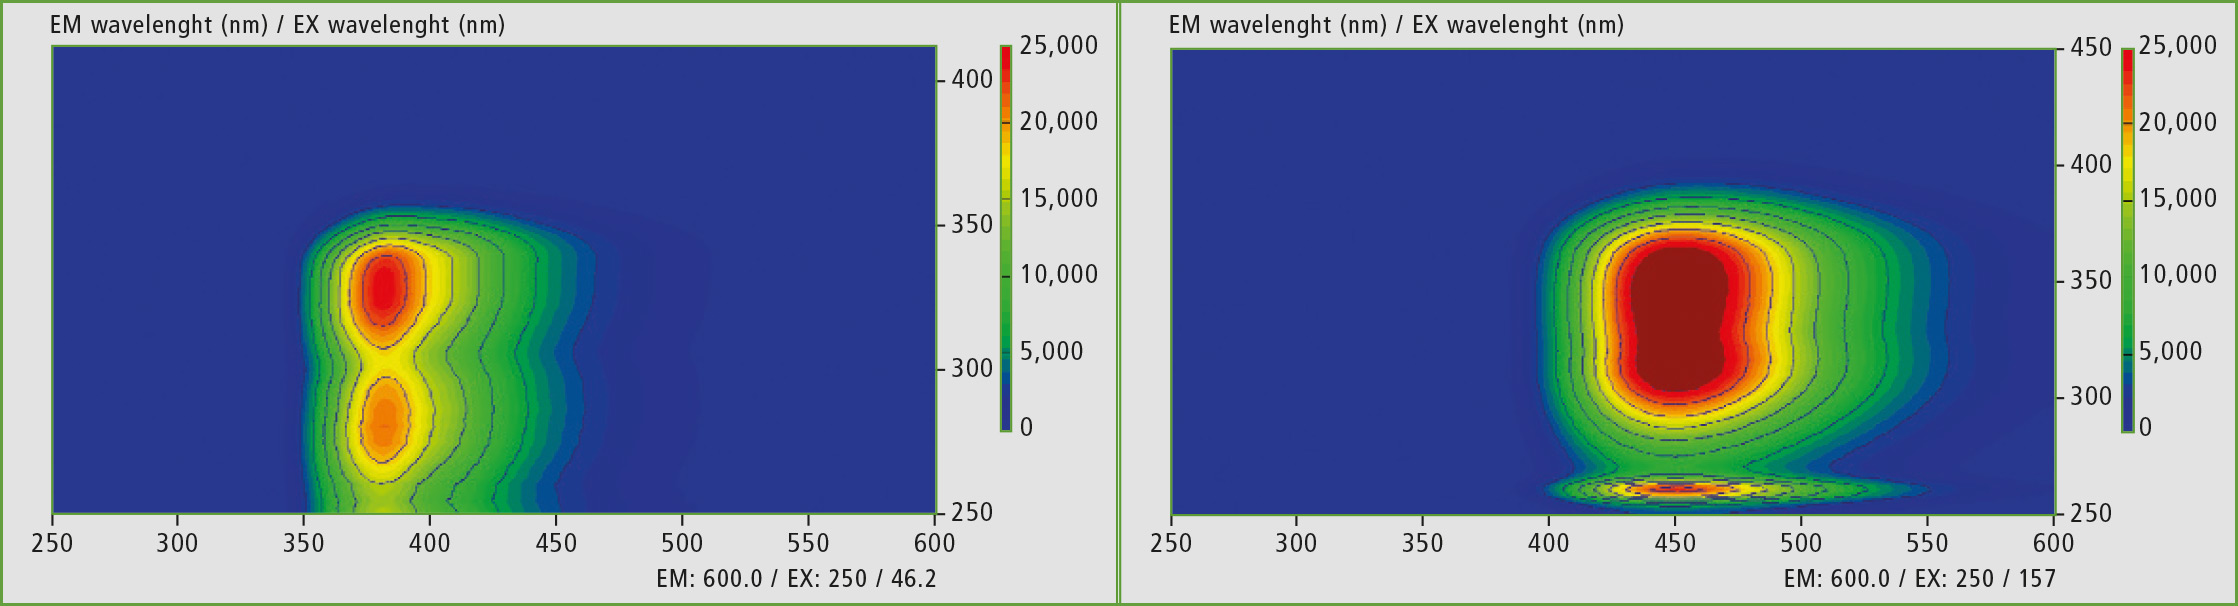 Figures 3a and 3b: EEM or excitation emission matrices of quinine in distilled water (above pH 5 and acidified below pH 2-3).
Influence of pH on the analytical wavelengths
As a reference material, chemically pure quinine was dissolved in distilled water. This solution had a pH of 5. By comparison, the carbonated acidified sodas have a pH of 2-3. In this experiment, the tonic water flavor was mixed once with distilled water (pH 5) and once with water acidified with sulfuric acid (pH 2-3). Measurements were taken on the Shimadzu RF-6000 Fluorescence Spectrophotometer with a standard fluorescence-free cuvette.
Both solutions were characterized by the fluorescence measurement. For comparison, the solutions were measured in an EEM (Excitation Emission Matrix), where the fluorescence-active regions are recognized. With the same scaling, it is obvious that the acidified matrix is shifted towards the long-wavelength range. At pH 5, the analytical wavelength pair (excitation/ emission) is 275/375 (region 1) and 325/375 (region 2) nm, and shifts at pH 2-3 to 325/450 (region 1) and 350/450 (region 2) nm. The influence of pH on the excitation and emission of fluorophores is known [1].
Quinine content checked
To check the quinine content, a calibration series of 22 standards (table 1, acidified, pH 2-3) was prepared, covering a wide concentration range (0.05 to 25.74 mg/L) with the same measurement parameters (excitation at 345 nm and emission at 449 nm). Figure 4 shows the calibration curve of the experiment.
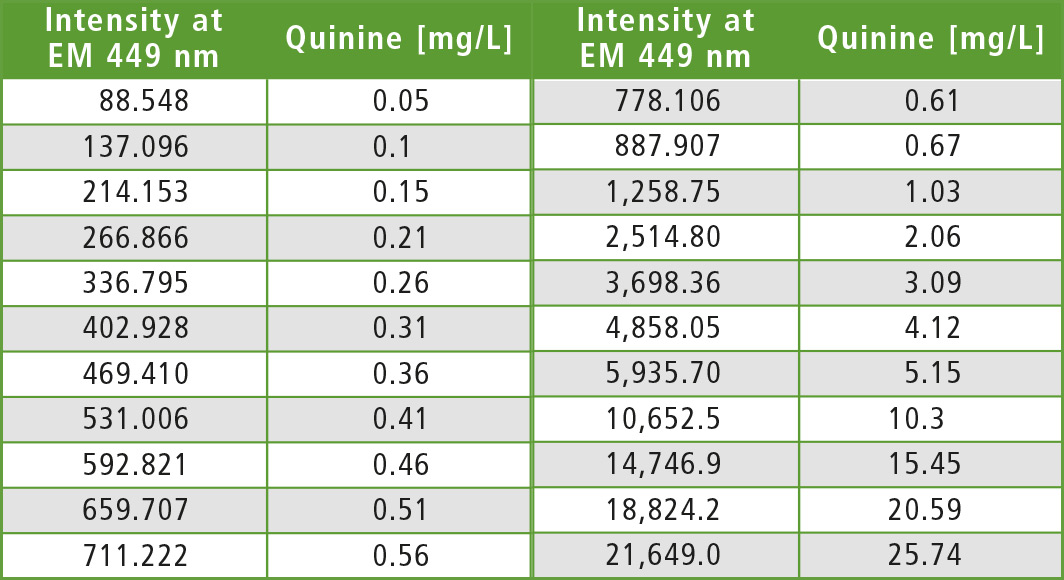 Table 1: 22 standards prepared from acidified quinine solutions, concentrations and fluorescence of the analytical wavelength pair
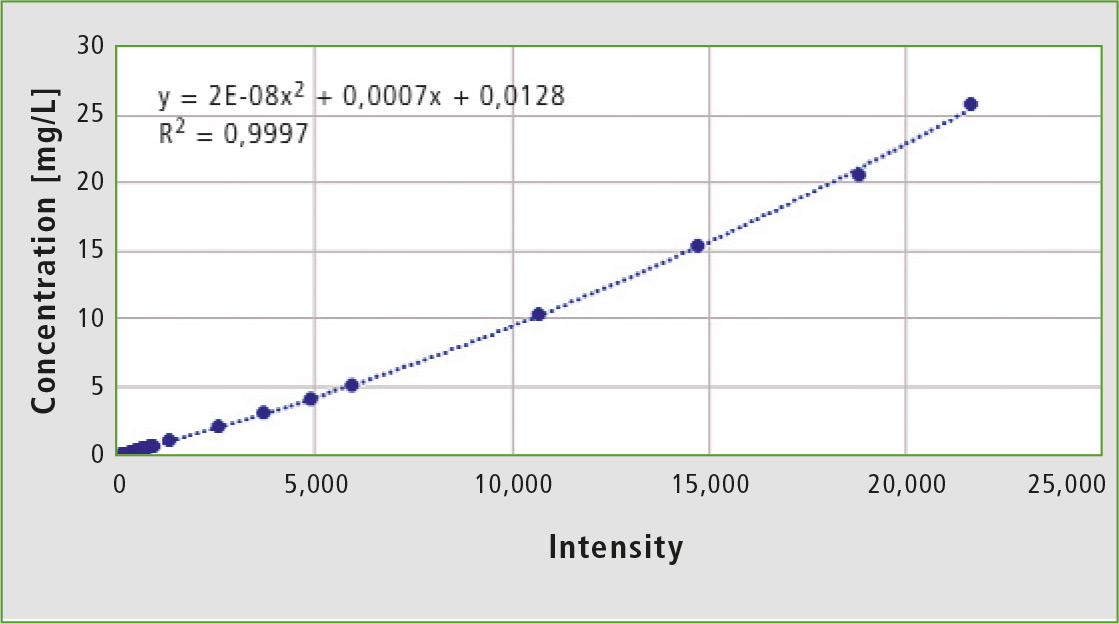 Figure 4: Calibration curve formed from 22 standards of quinine in concentrations from 0.05 to 25.74 ppm
The fluorescence intensity of the standards at 449 nm and their quinine concentration can be connected by a polynomial calibration curve of the second degree. The compensation calculation gives a correlation of 0.9997, where 1 would be the ideal state. This calibration was chosen to demonstrate the dynamic range of the device.
For analysis, conventional sodas in PET bottles from various suppliers as well as one flavoring were obtained. Exemplary measurements with tonic water and the tonic water flavoring are shown.
In order to demonstrate the selectivity of the fluorescence and the dynamic range of the device, a variety of dilutions were used. In the case of the tonic water flavor, the measured intensity and the ensuing calculated concentration of about 55 g/L correlates with the information provided on the bottle (6 % quinine corresponds to an amount of 60 g/kg). For the brand-name lemonade, the measured intensity and the subsequently calculated concentration of about 77 mg/L correlates with the information found in the literature (about 70 mg/L quinine). By comparison, quinine in the discount goods was less well-dosed. Both lemonades fulfill the permitted quinine concentrations according to the flavor regulation [2], because they are below the limit of 85 mg/L.
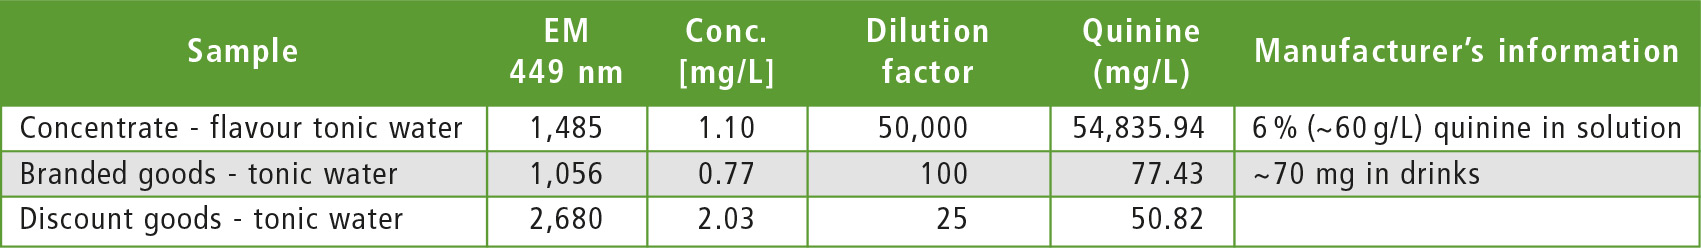 Table 2: List of samples, their dilution, fluorescence intensity and calculated quinine content
Conclusion
Quinine in lemonade and flavoring concentrate can be determined reliably with this method. A calibration from low to high concentration can be made with quinine and could be carried out without changing the measurement parameters with respect to detector sensitivity and grating adjustment. An optimization of the calibration can be achieved by smaller concentration ranges and adapted device parameters.
Literature
[1] Principles of Fluorescence Spectroscopy, J.R. Lakowicz, 3rd Edition, 2010, Springer
[2] Aromaverordnung