Everything styrene?
Material testing and infrared spectroscopic identification of plastics in recycling
Plastic recycling is becoming ever more important – especially considering that mineral oil as a source of polymer raw material will not be available in this volume in the long run. The resources of the Earth and its atmosphere are finite. Among other things, “fresh“ polymer is produced from naturally occurring mineral oil. Depending on the intended use, different additives are added to support its product life. And at its end, the plastic ends up in the waste cycle. Under ideal conditions, the polymer is recycled and converted into new forms with new properties, such as when a plastic with UV stabilizer and a plastic with plasticizers meet. After the recycling process, both polymers are fused and show new characteristics.
A complex task for recycling companies is to analyze and identify plastic waste and determine its mechanical properties. Based on these results, the plastic is separated into different categories in order to be able to further process it in a targeted manner. The mechanical properties of the plastic are important for the end product. The specification for examination is based on ISO 527-1/2 [1]. By way of example, the challenges of polystyrene are considered in this article. This plastic group belongs to the family of styrene polymers.
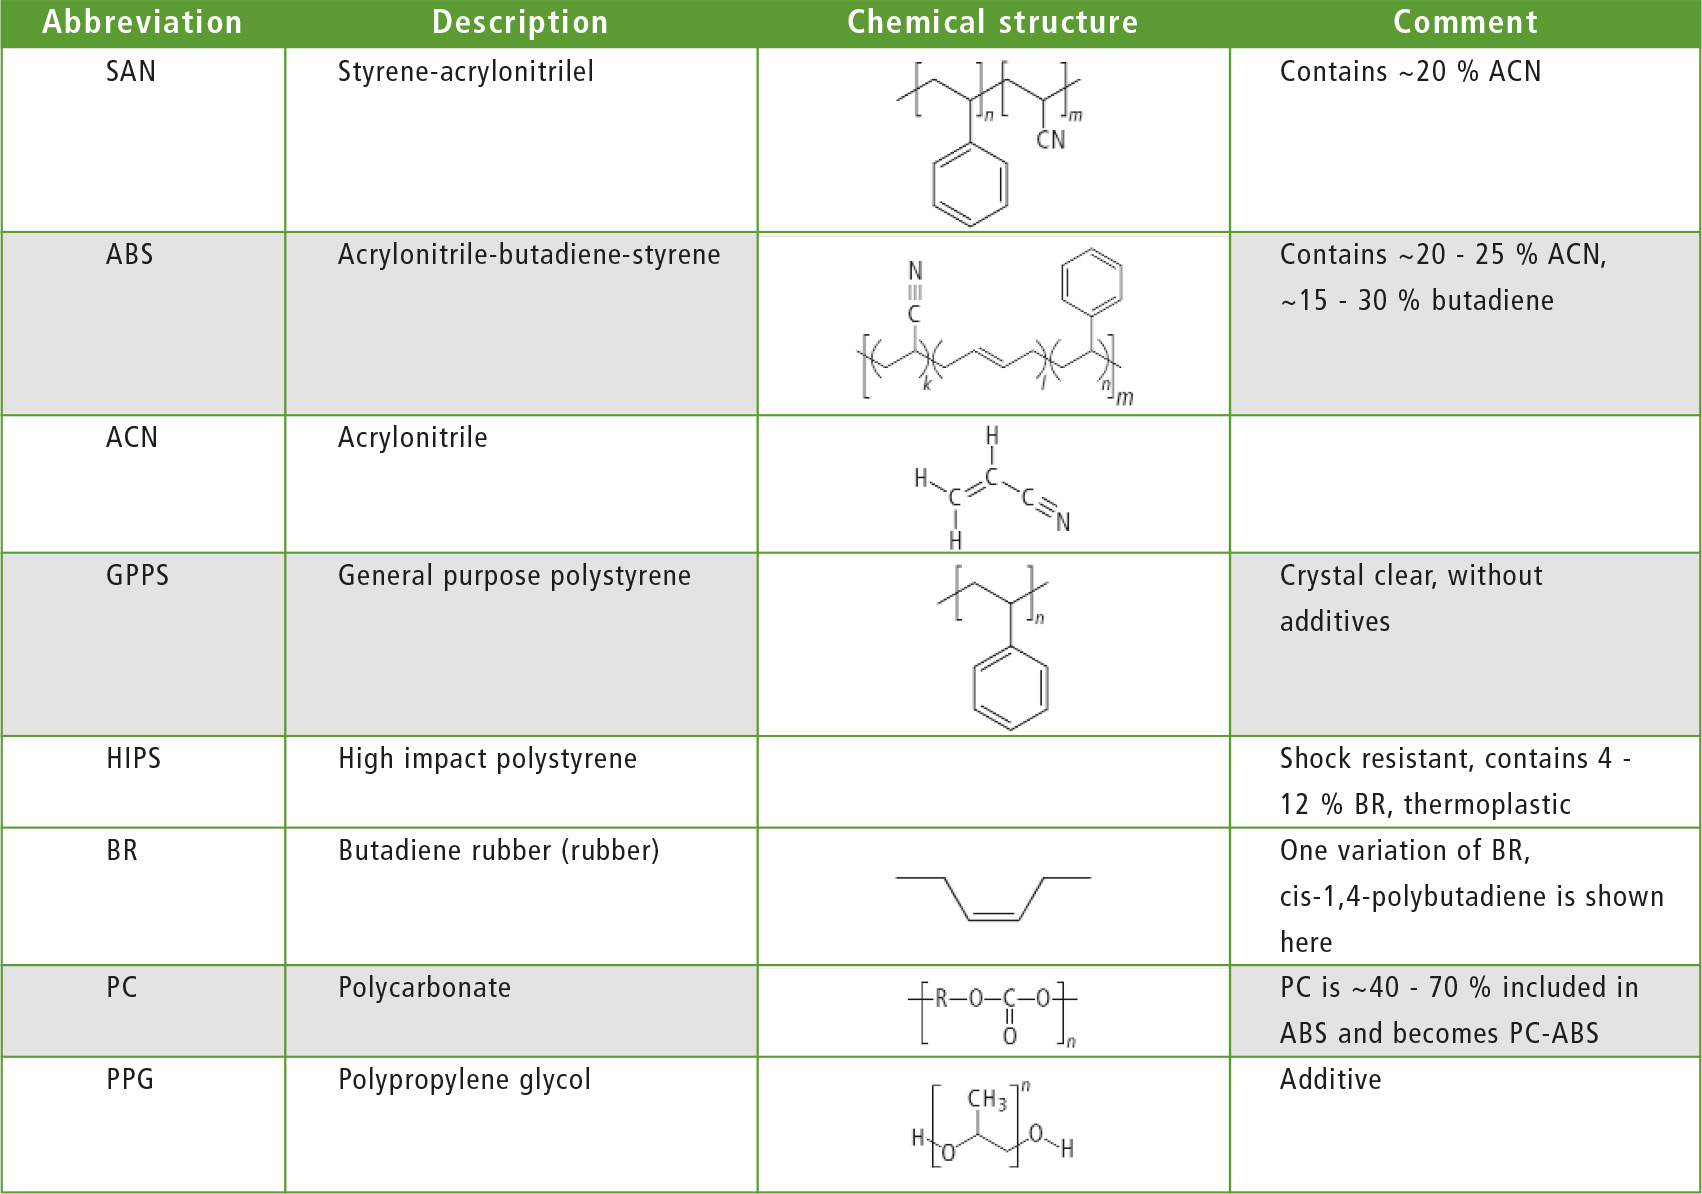 Table 1: Explanation of the plastic abbreviations, structural chemical formula and properties of the styrenes considered
Analysis of polystyrene
In this refining, polystyrene is considered as GPPS (General Purpose Polystyrene). As a homopolymer, it is very brittle. To reduce the brittleness, small amounts of BR (butyl rubber) can be added, resulting in an impact-resistant GPPS: HIPS (High Impact Polystyrene). The disadvantage of both is the low chemical temperature resistance.
This property can be improved by adding acrylonitrile to GPPS. The result is SAN, a styrene-acrylonitrile copolymer. Acrylonitrile influences the strength, toughness and durability of polystyrene. In addition, butadiene can be added to improve the properties of SAN resulting in ABS (acrylonitrile-butadiene-styrene copolymer). ABS is considered to be impact-resistant when compared to the precursors.
In the recycling sector, there are already plastics with corresponding additives and co-polymers in bulk. For further processing, it is important to know what can be improved in terms of content in order to achieve the desired properties.
Samples for testing according to ISO 527-1/2:
Test specimens were produced by injection molding. The bodies are shown in figure 1. On the left, sketches show the test positions in the clamping tool and on the right, the real samples can be seen.
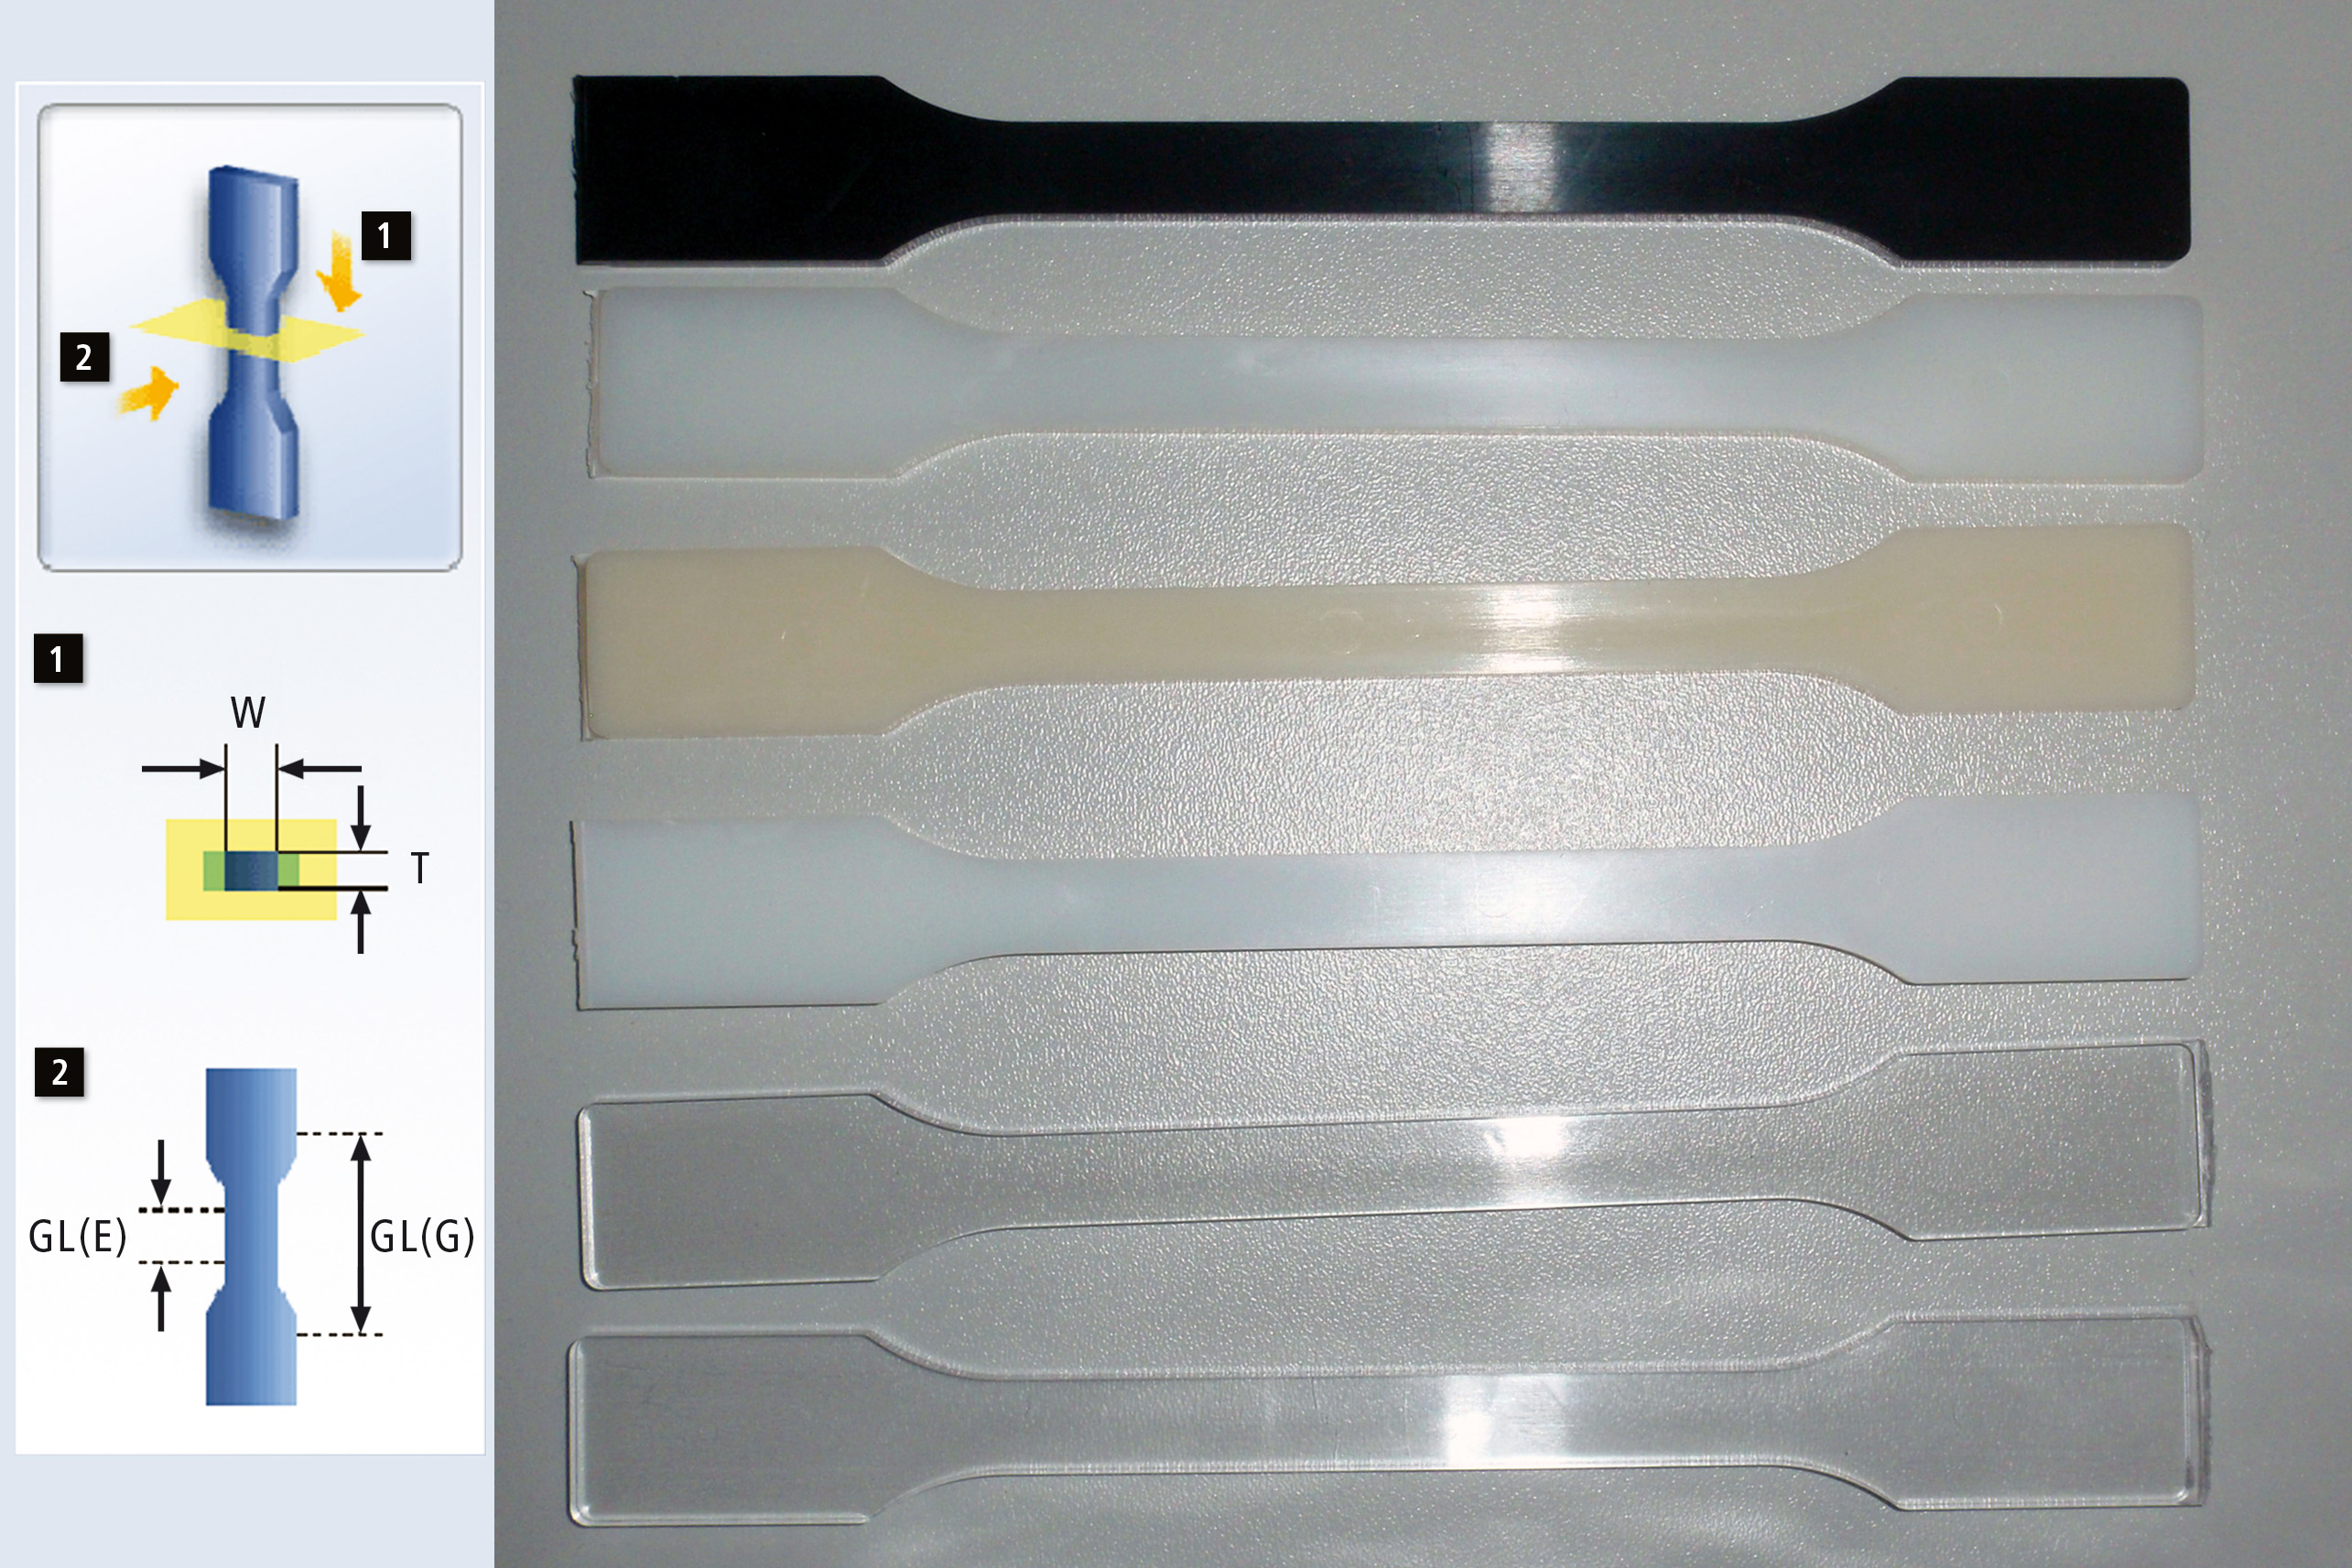 Figure 1: A test specimen in the sketch on the left, as deposited and clamped in the Trapezium software for ISO-527-1/2, where W (width) and T (thickness), GL (G) distance of the clamping tools and GL (E) are the distance of the markers for the video extensometer.
Real samples on the right (photo from bottom to top: GPPS (transparent), SAN (transparent), HIPS (milky), ABS (yellowish), ABS Magnum (milky) and ABS recyclate (black) with dimensions W = 10 mm, T = 4 mm, GL (E) = 50 mm and GL (G) = 115 mm)
Identification
Infrared spectroscopy can be used to identify the polymer by rapid screening. Measurement takes place within seconds with the help of ATR spectroscopy. For this purpose, an IRSpirit-T FTIR instrument was used, equipped with the integrated QATR-S and accessory detection.
The specimen is clamped in the ATR with reproducible pressure. Infrared radiation can penetrate into the sample surface according to the rules of attenuated total reflection. This reacts to the IR heat with vibrations that are characteristic of the polymers.
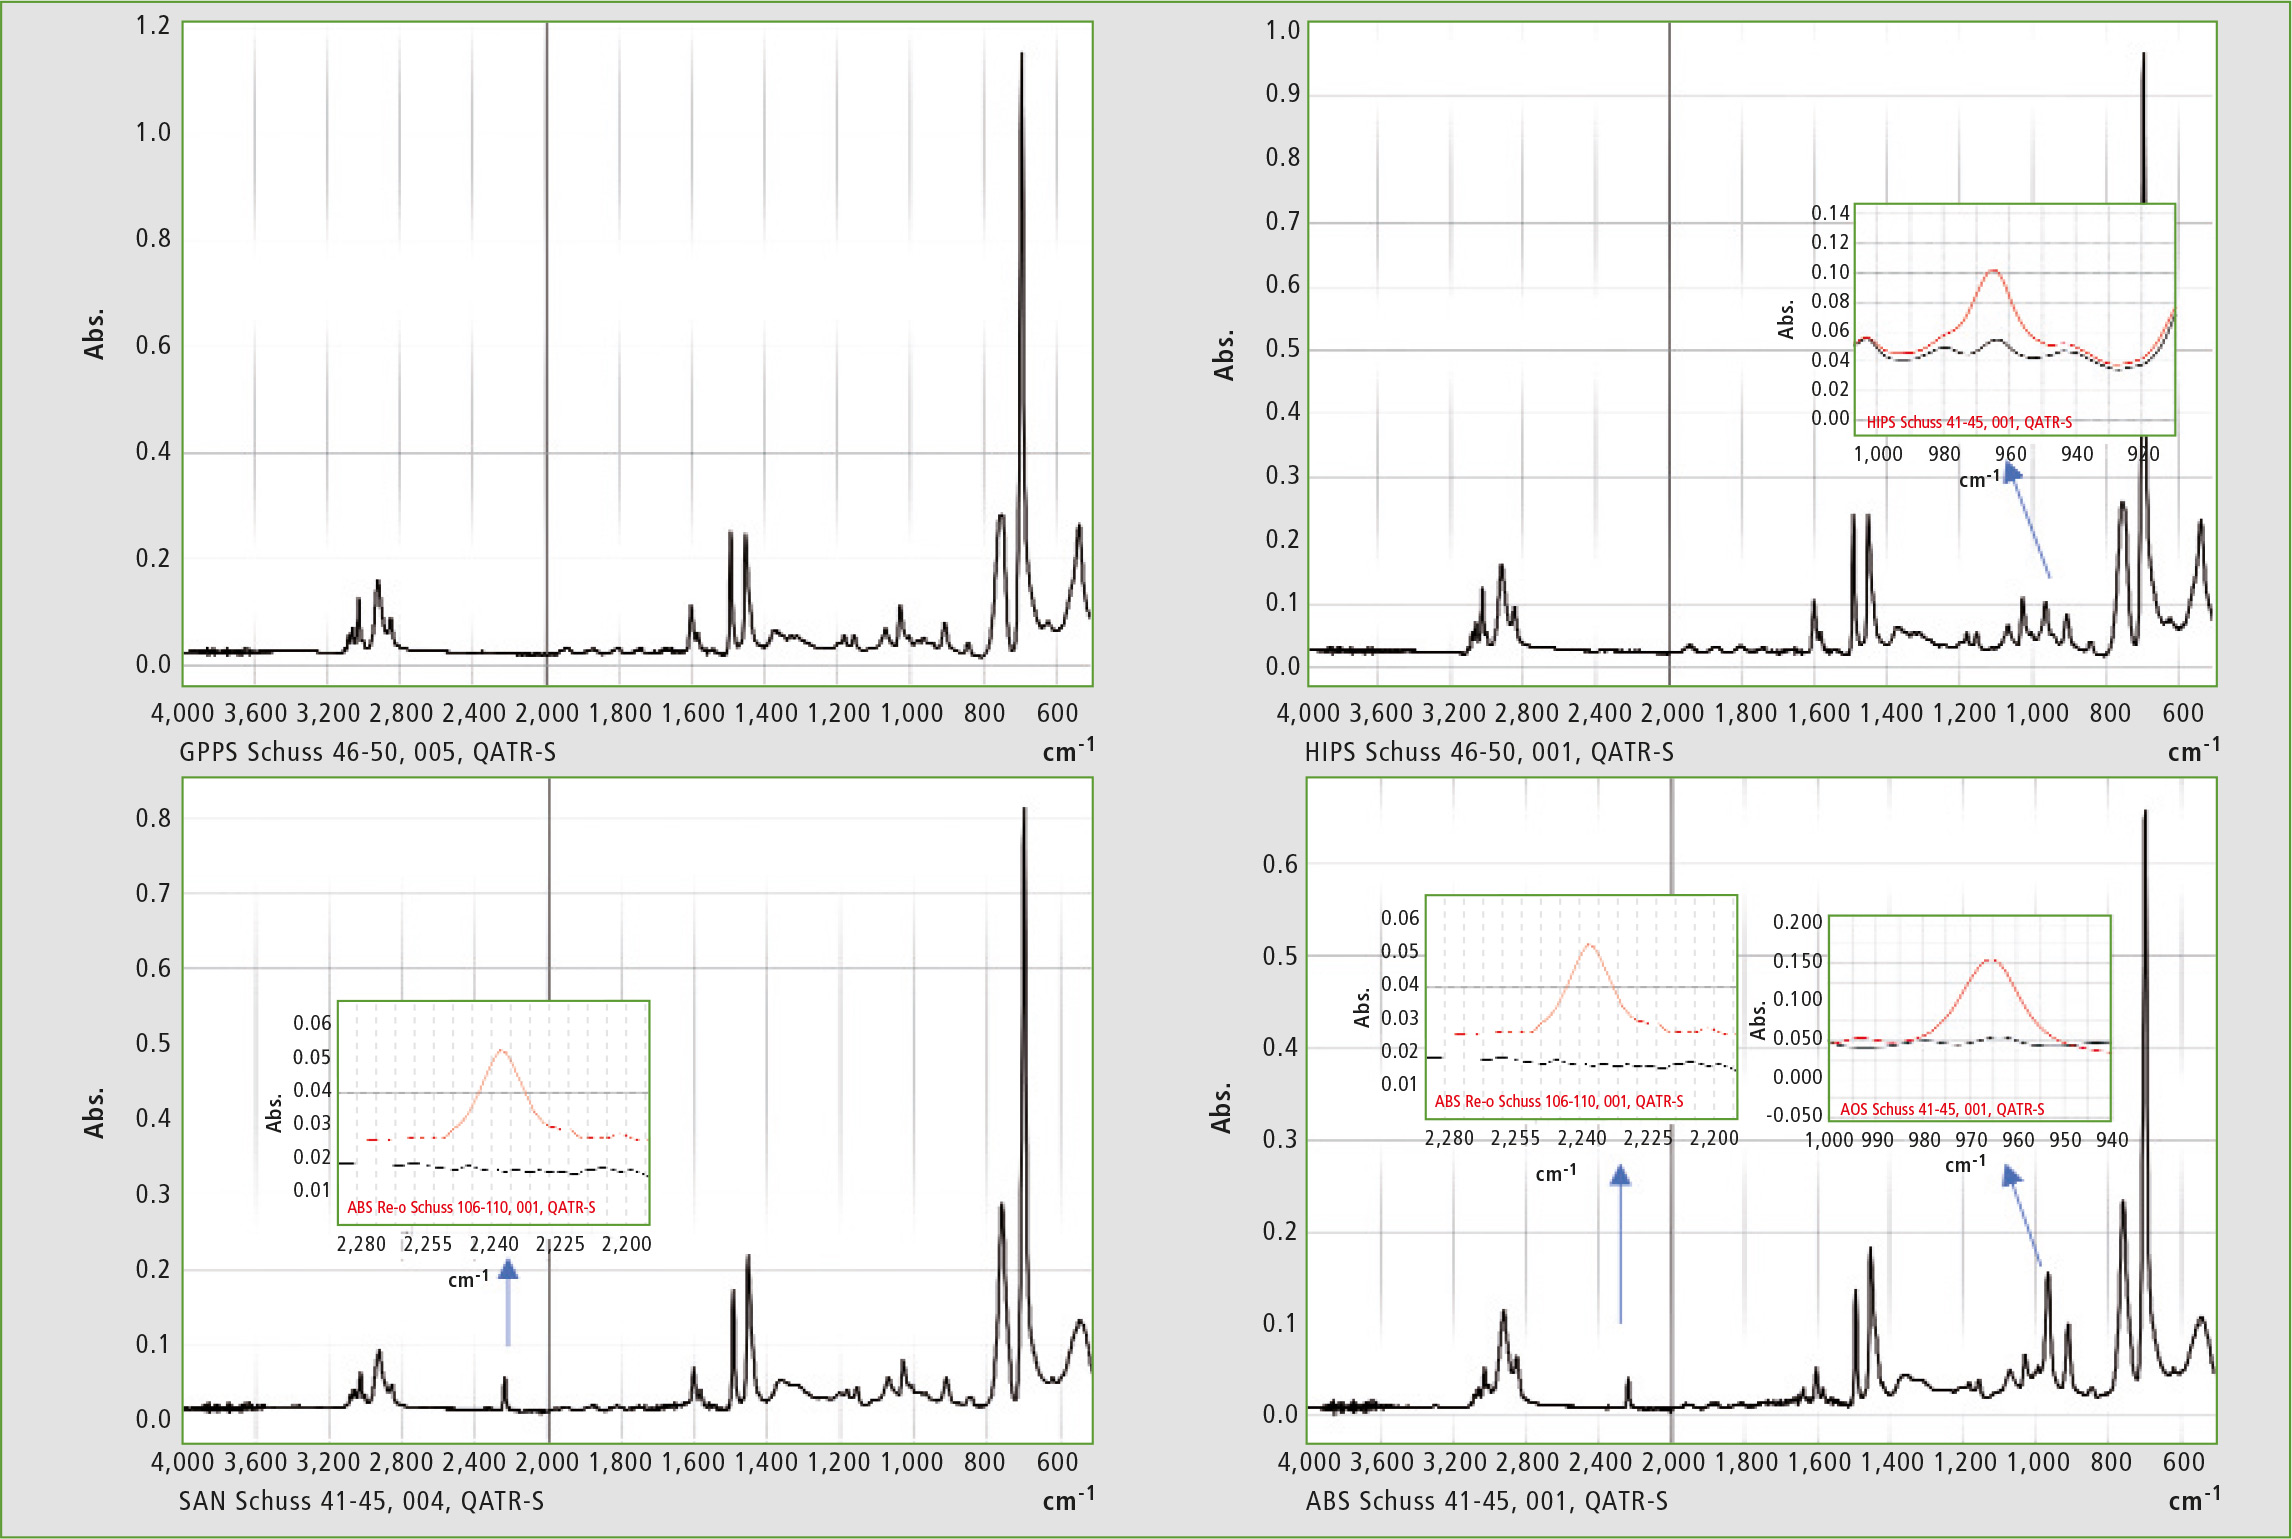 Figure 2: Infrared spectra of the examined polystyrenes and comparison to the GPPS spectrum, top right HIPS with 965 cm-1 by BR-shares, bottom left SAN with the nitrile-part at 2,237 cm-1 and bottom right the target to produce an ABS: here in the polystyrene spectrum at 2,237 cm-1 the nitrile signal is visible and at 965 cm-1 the signal of butadiene is visible.
Identification of the polymer is supported by the LabSolutionsIR software in combination with libraries. Since the styrene polymers have related spectra, attention must be paid to specific vibrations in the infrared spectrum, which differentiate these possible mixed variants.
Different variants of polystyrene have been investigated. In order to test the quality of the surface of a sample (figure 1), they were tested with a 10-fold determination. Five measuring points were measured in each case on the two flat sides of the test piece.
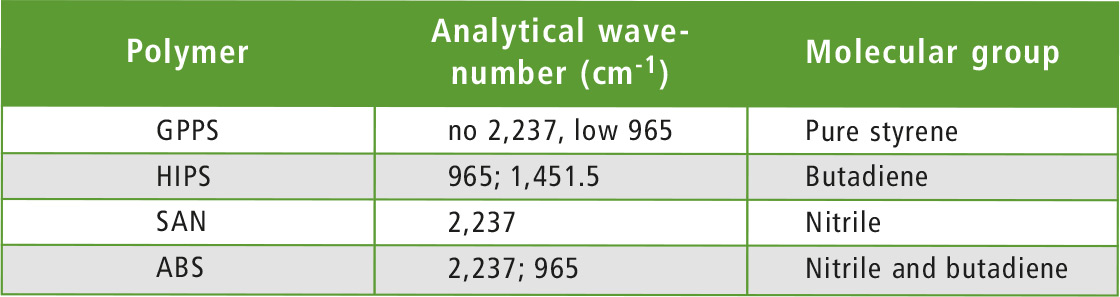 Table 2: Differentiation of the styrene polymers based on IR vibrations
With this in mind, ABS blends were analyzed – an ABS recyclate and an ABS with BX declared sample. According to the infrared spectrum (figure 3), the ABS recyclate is a mixture of ABS with a high content of styrene, PC and methacrylate. By contrast, the ABS with the BX logo represents a mixture of ABS with a high content of styrene and polypropylene glycol (PPG, plasticizer). With the help of a library search and subtraction spectroscopy, the different components could be found in the mixtures.
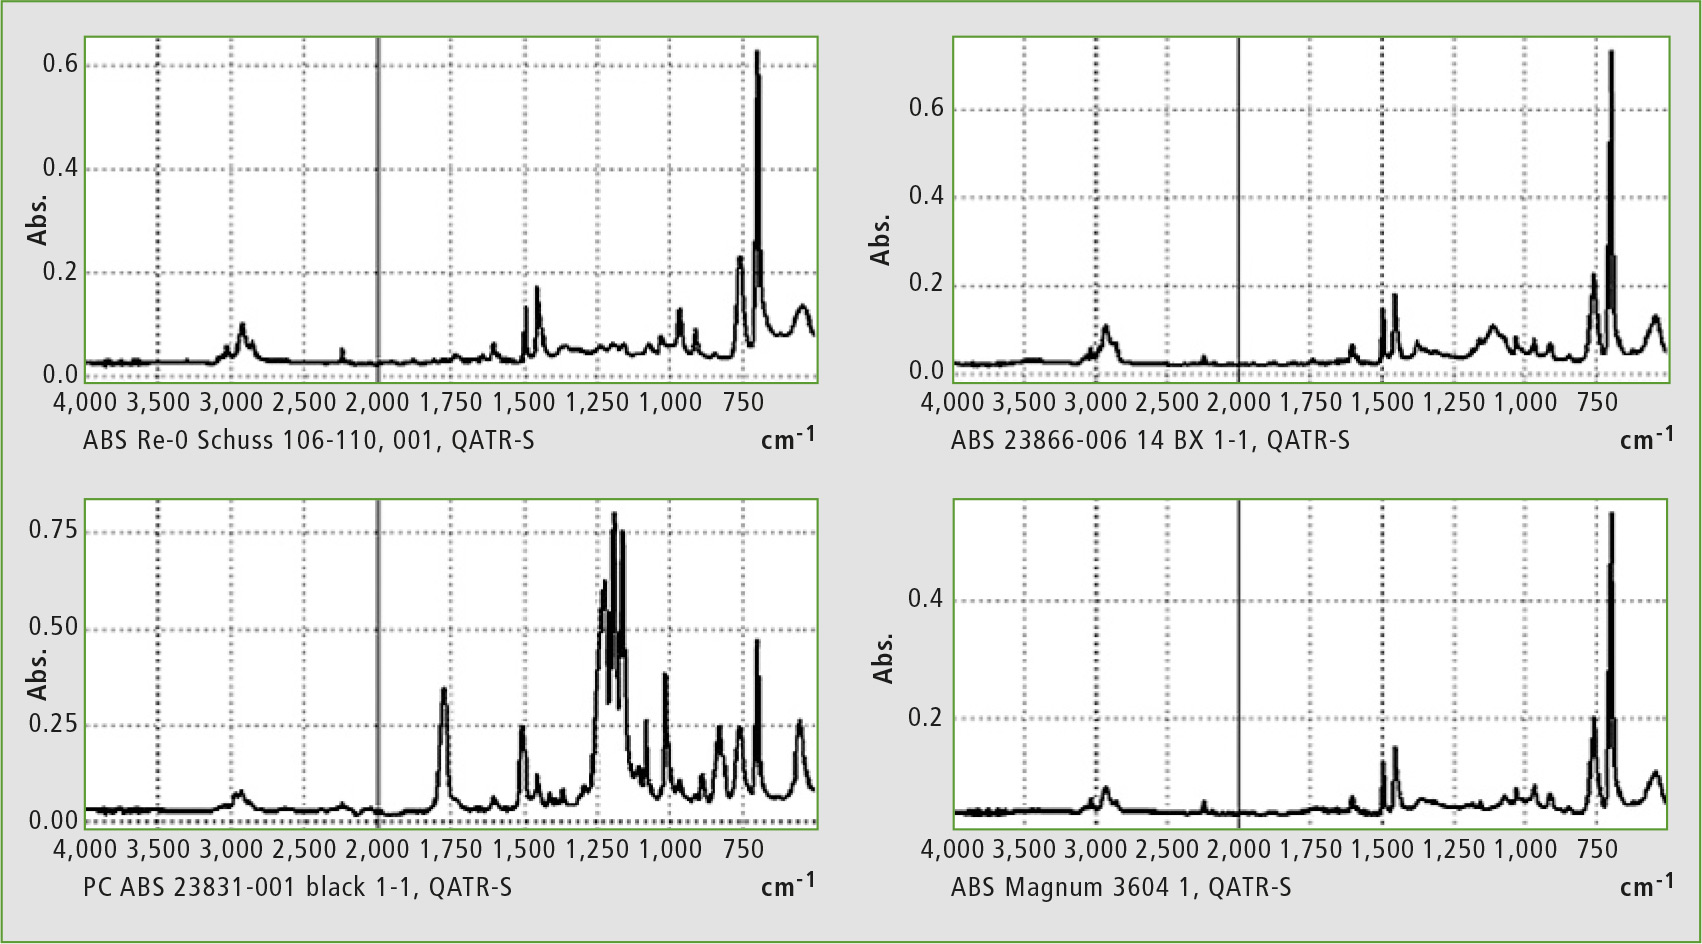 Figure 3: Infrared spectra of four samples, which contain not only the polymers of table 2. On the bottom right is an ABS, bottom left is the mixture of PC and ABS, top left is a recycled material with ABS and parts of PC (structure around 1,240 cm-1) and on top right is an ABS with parts of PPG (1,110 cm-1).
To assess the quality of the mixtures, the nitrile and styrene/butadiene bands in the IR spectra were selected for analysis. In each case, 50 measurements (five test pieces with ten measurements each) were evaluated. Standard deviation of the results showed the maximum of the signal positions to be 0.00x absorbance units. This is excellent quality for the test specimens on the surface (table 3).
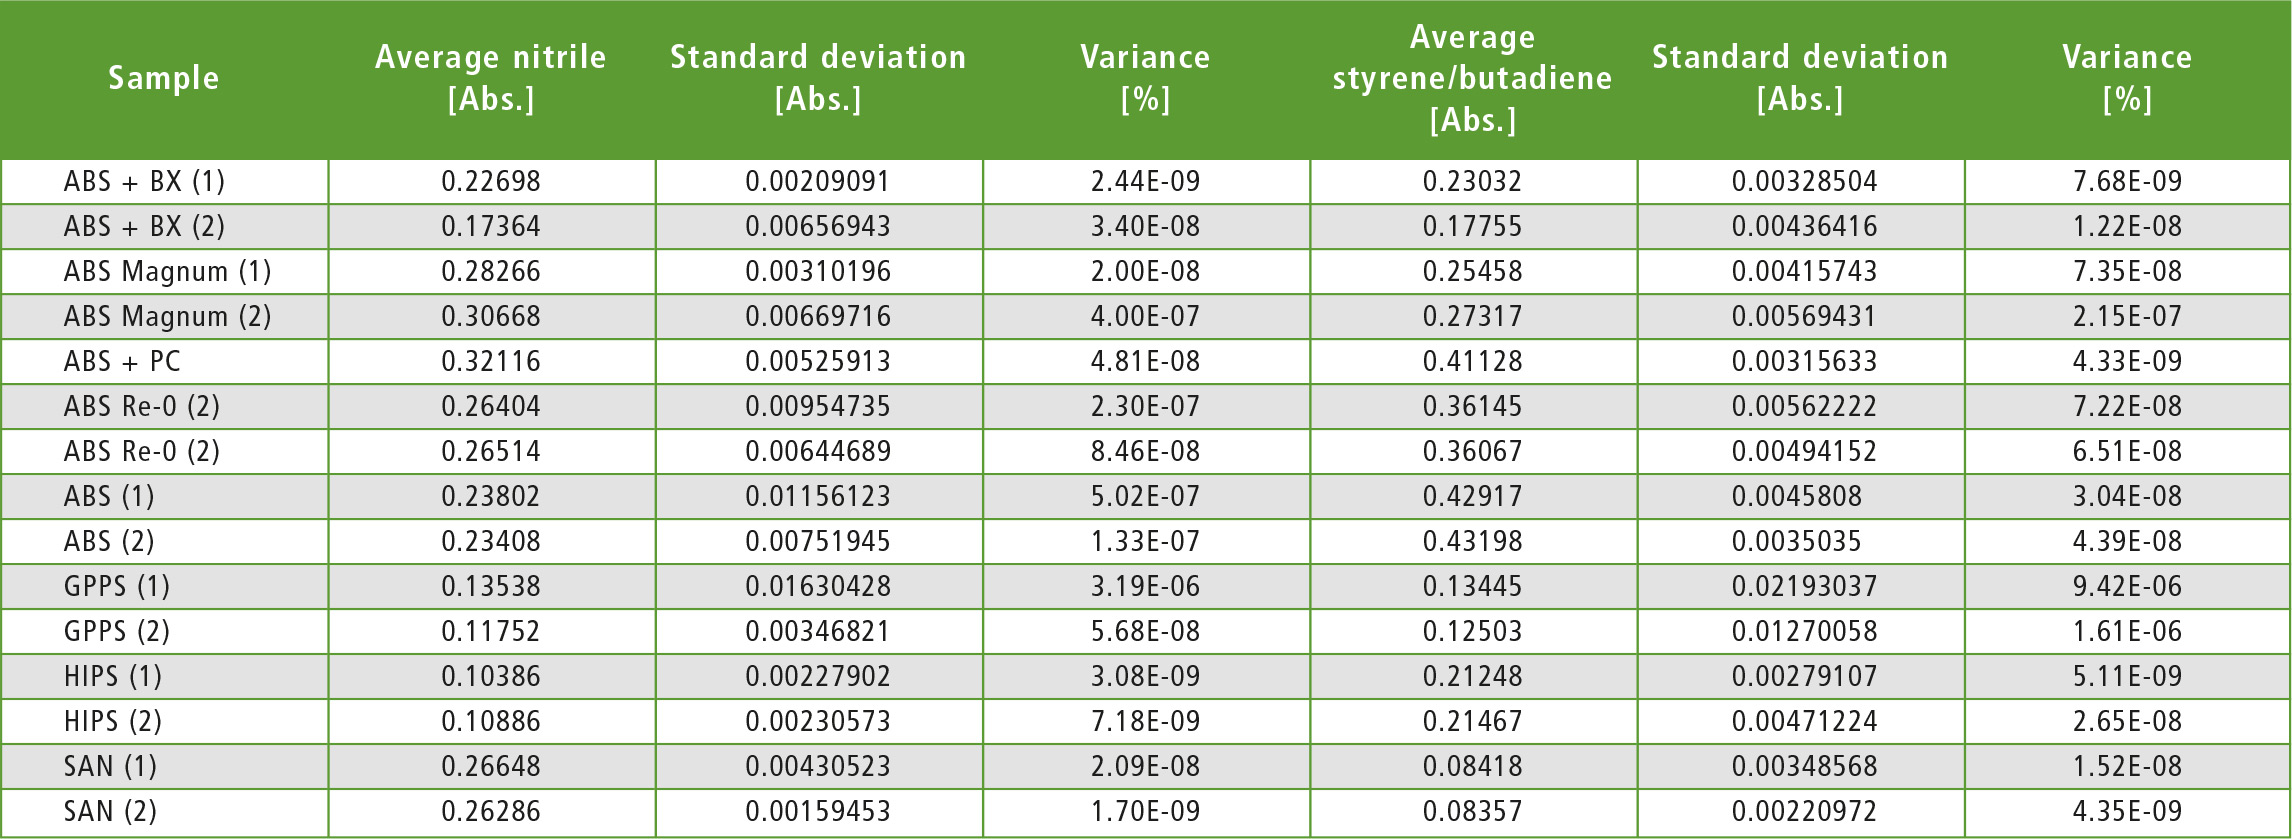 Table 3: Quality Control by FTIR at selected analytical wavelengths for determining the height of the nitrile signal (2,230 cm-1) and styrene / butadiene signal (965 cm-1), mean value of 50 measurements per test lot of five specimens including standard deviation and variance
Mechanical test according to ISO 527-1/2 with the AG-Xplus universal testing machine
Infrared spectroscopy was used to investigate the surface of the samples with regard to identification of the plastics and testing of the homogeneity at the surface. A layer thickness of approximately 4 µm of the 4 mm thick specimens was detected from the outside. To assess homogeneity with respect to the whole layer thickness, a mechanical test can complement the FTIR measurement results. To compare the samples, the elasticity of the polymers according to ISO 527-1/2 was evaluated.
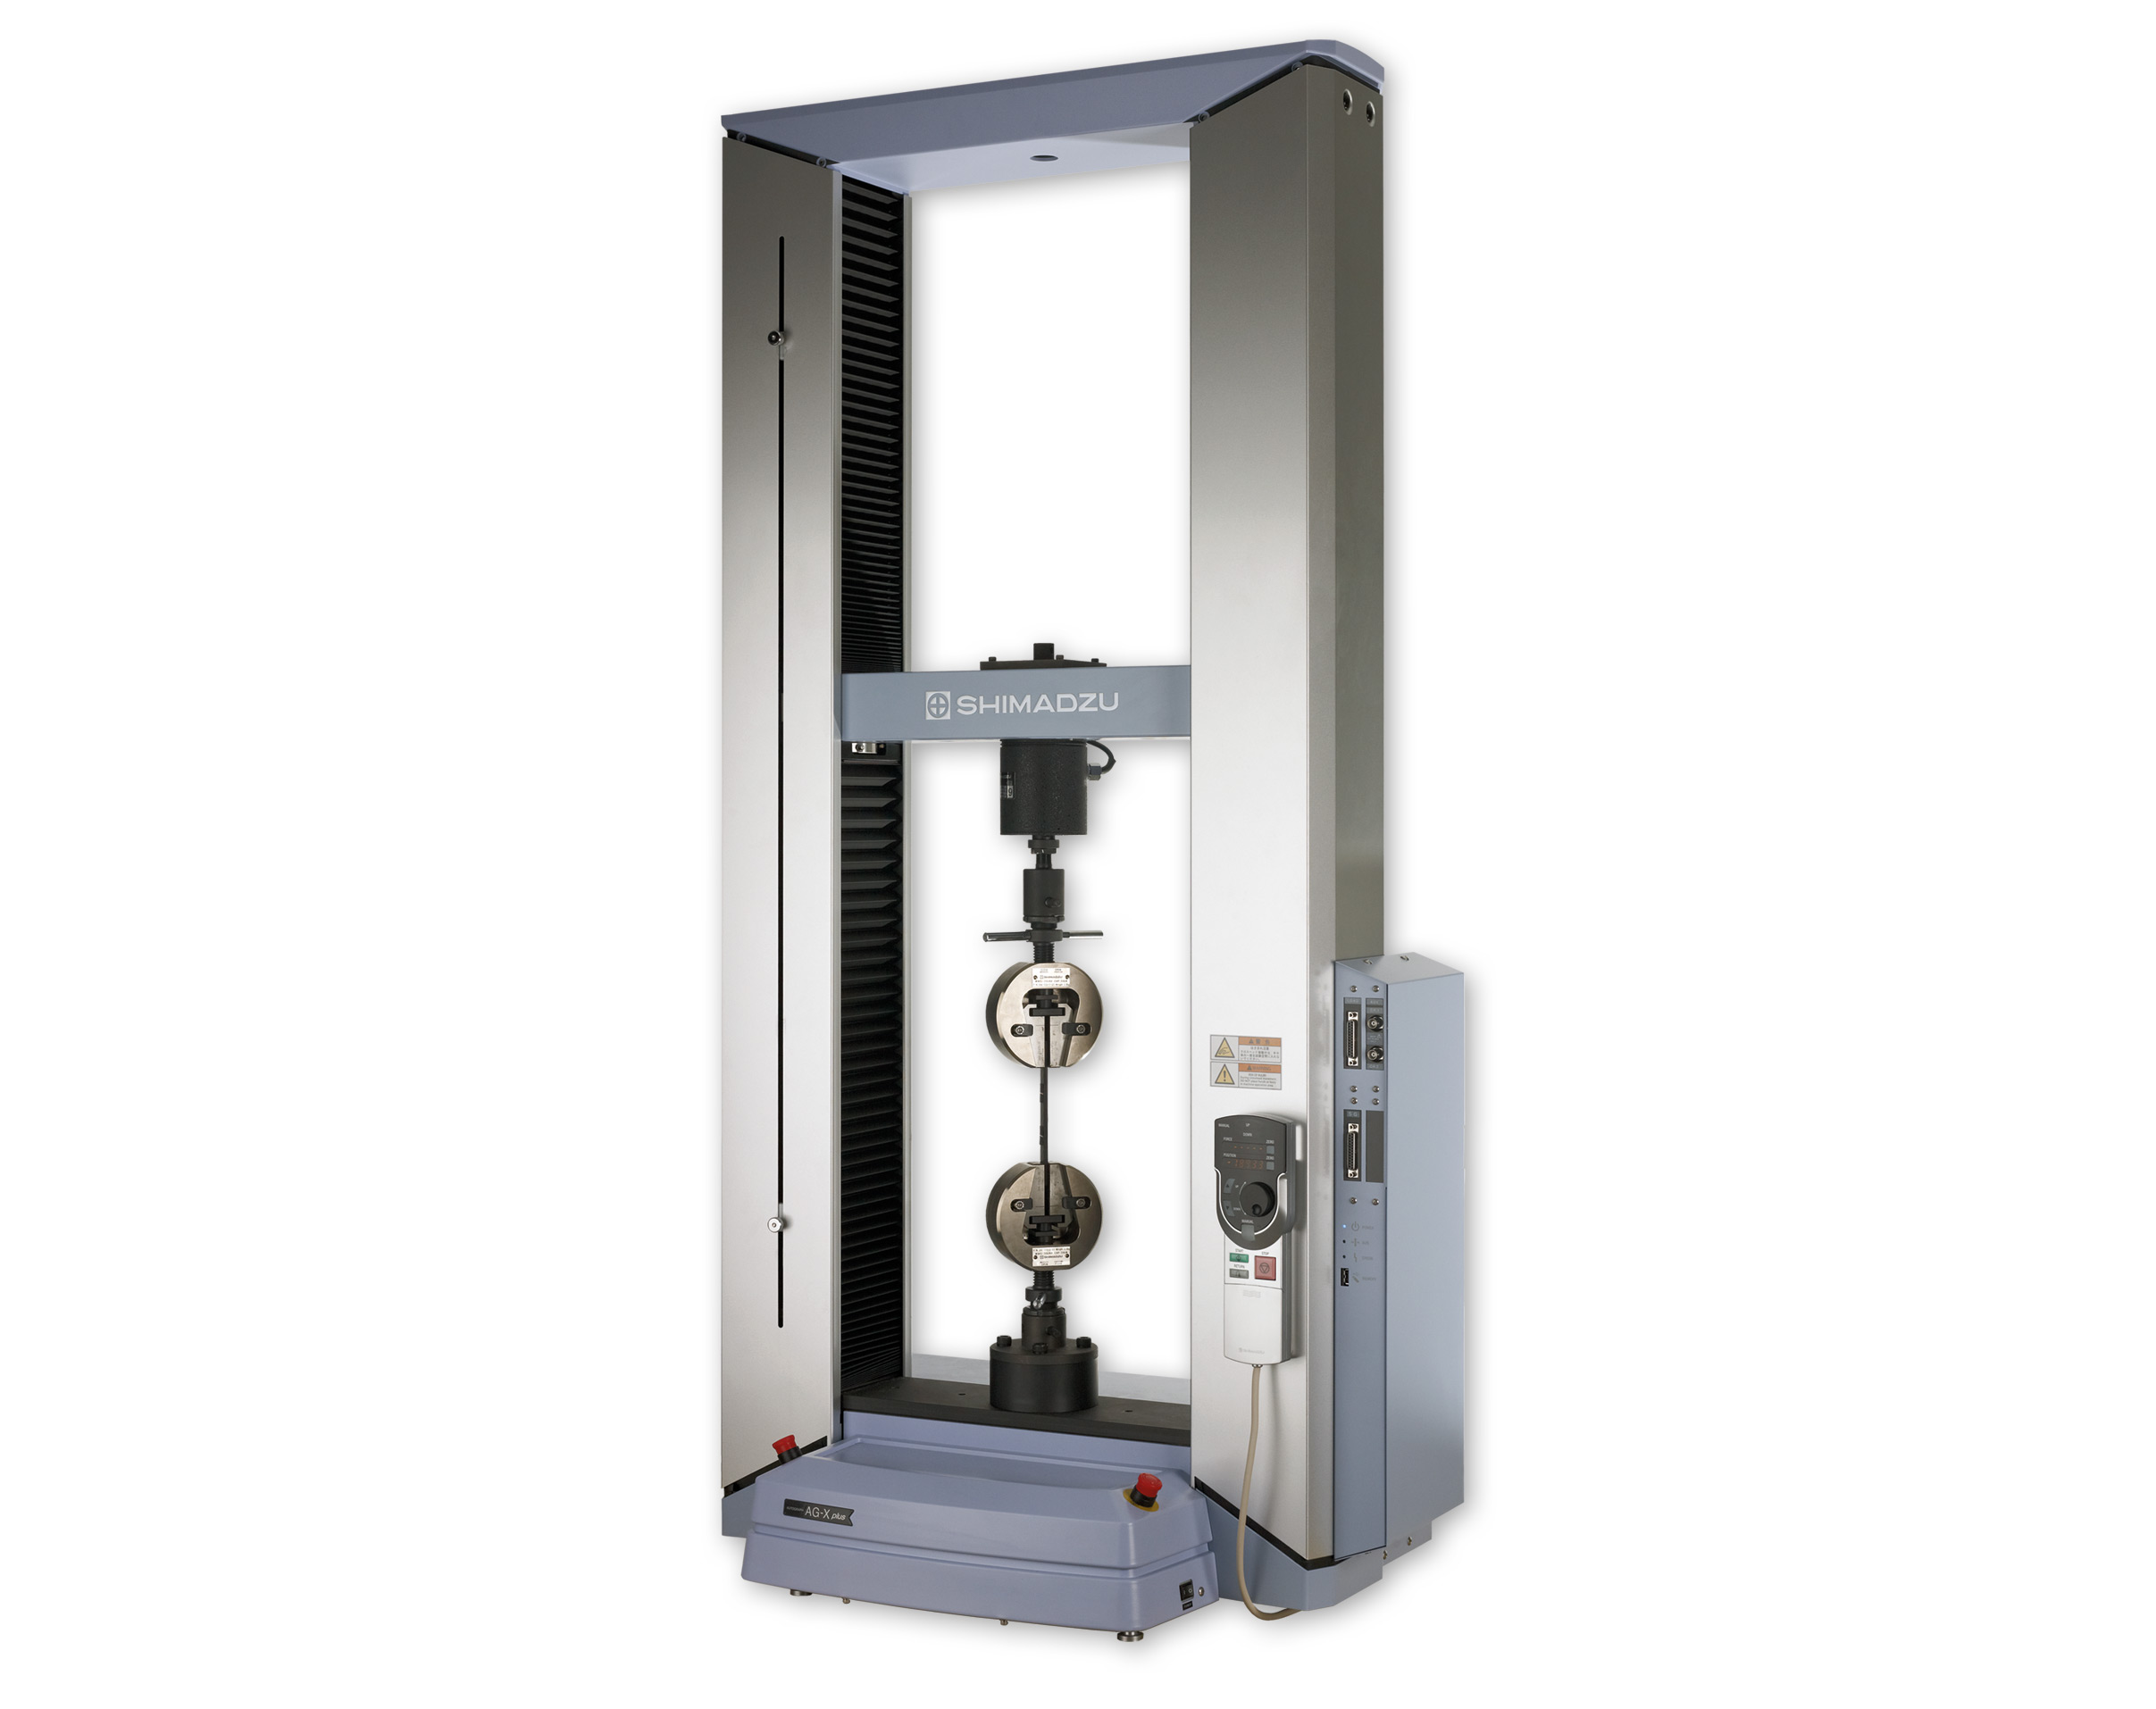 Universal testing machine AG-Xplus
Elasticity was measured using a non-contact extensometer with a TRViewX Video Extensometer. It can determine the yield strength with high accuracy. With the accompanying TRAPEZIUM software, the measurement conditions and video monitoring can be set up.
The sample was clamped with a preload of five N. For video surveillance, the test specimens were provided with markers which were placed at a distance of 5 cm. By using the video camera, the test area was detected and the middle part of the test specimen was set up in the digitally specified marking.
The ISO prescribes at least five test pieces, which were measured accordingly in this test series. The polymers with “soft“ characteristics were tested with a tension of 20 mm/min, while the “brittle“ specimens (GPPS, HIPS) were tested at 2 mm/min.
Figure 4 shows the typical curves of Newton’s force versus “Millimeter distance“ for the five lot samples. Except for one partial sample, all test specimens showed good reproducibility. Results of the other lots were reproducible. The ABS Magnum lots showed greater deviations in the elasticity measurements while the force-displacement curves were reproducible (figure 4).
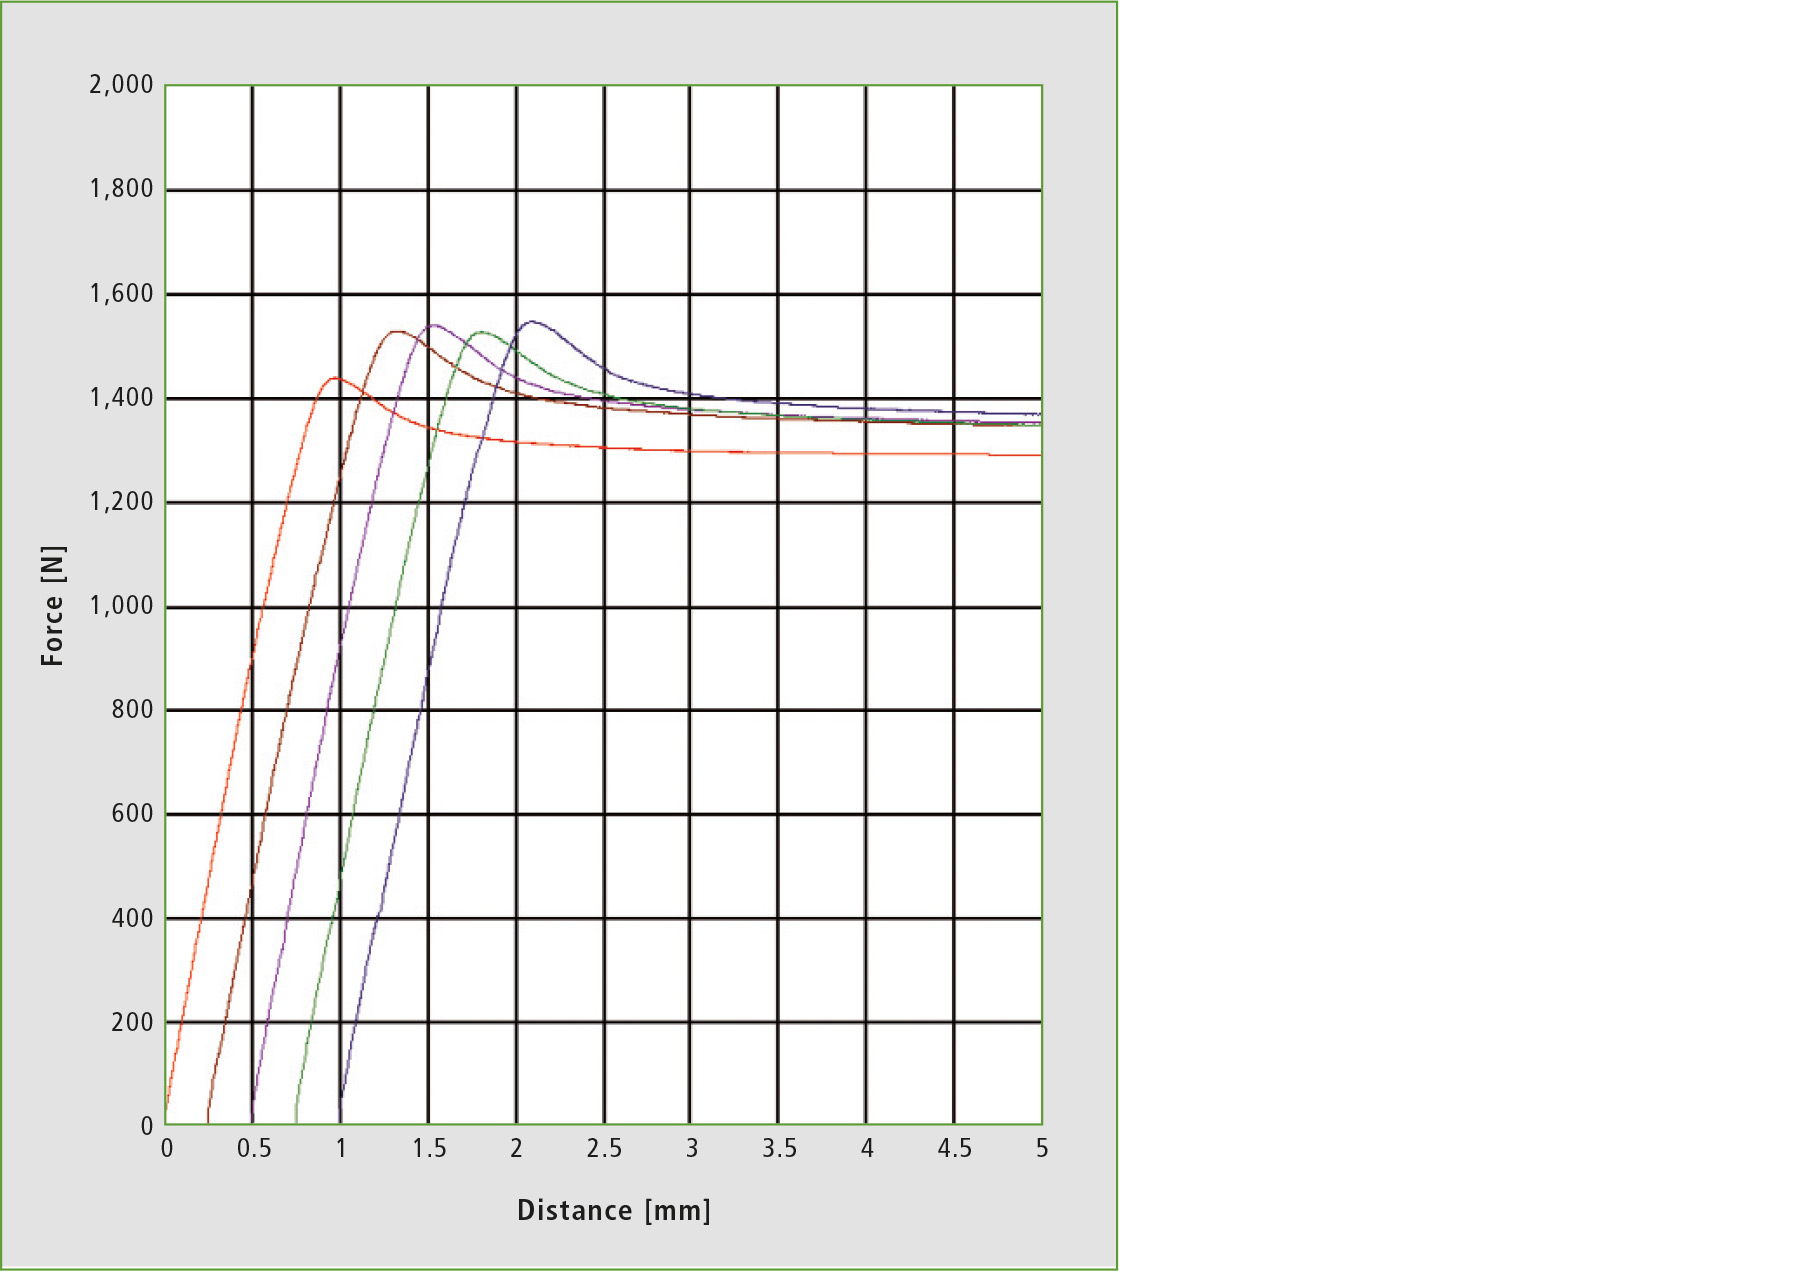 Figure 4: The five force-displacement curves of the sample ABS Re-O (1) in the representation ‘force’ versus ‘distance’
Conclusion
With non-destructive infrared spectroscopy, polymers in the form of test specimens (as per ISO 527-1/2) can be identified and tested for homogeneity on the surface. Standard deviations in the order of magnitude of less than 0.01 ABS units at selected signal positions are due to the noise of the equipment and accessory combination and indicate a good reproducibility of the test specimens.
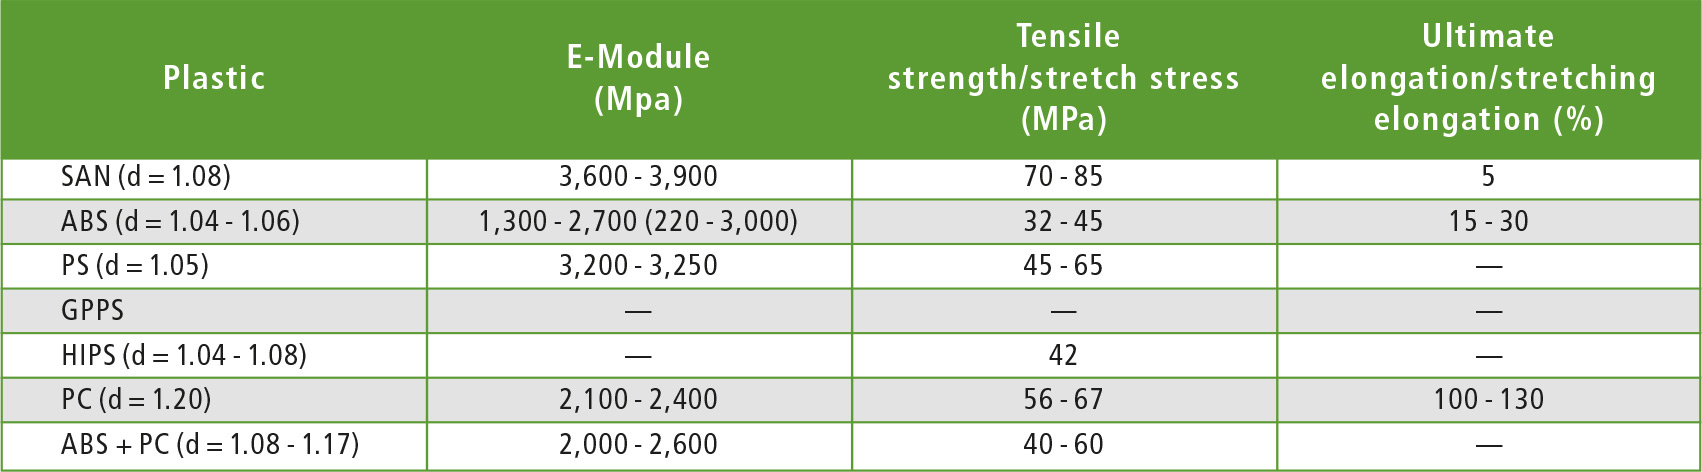 Table 4: Properties [2] of selected plastics after the plastics test ISO 527-1/2
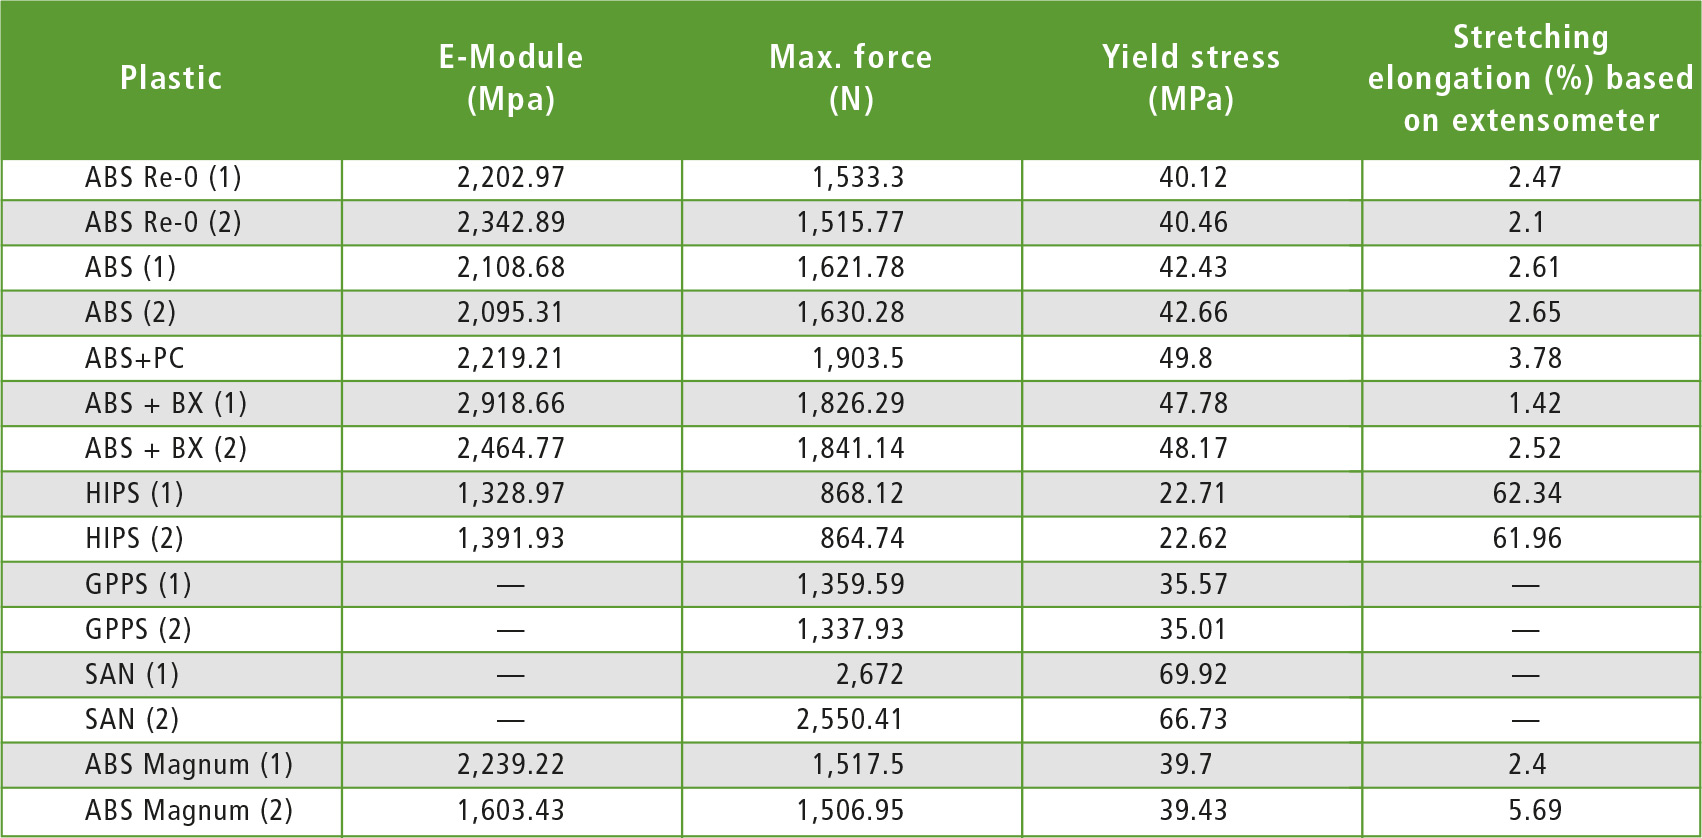 Table 5: Results of measurements with AG-XPlus in combination with TRViewX according to ISO-527-1/2 for the plastic samples (average of five test specimens of one lot)
This was confirmed for the complete layer thickness by tensile testing (ISO-527-1/2) of the materials. For the plastics recycling industry, this analysis is indispensable for determining properties of the plastic polymers of the styrene family.
Acknowledgments
Many thanks to Carat GmbH (Bocholt, Germany) for advice on the subject and provision of the plastic samples. The application was developed in collaboration with Erwin Jansen and Albert van Oyen (both Carat GmbH).
Literature
[1] “Plastics – Determination of tensile properties”, DIN EN ISO 527-1/2
[2] “Saechtling Kunststoff Taschenbuch“, 31. Auflage, Hanser Verlag, 2013