Monitoring of total aromatics in gasoline
GCMS-QP2020 applied to ASTM D5769-04
In 1990, the American Congress amended the Clean Air Act, mandating the Environmental Protection Agency (EPA) to introduce reformulated gasoline with lower aromatics in polluted areas. This helped reduce vehicle emissions of toxic and ozone-forming compounds [1].
Certifying that a fuel complies with the standards for reformulated gasoline requires monitoring of its emission performance, calculated using equations derived from the “Complex Model” mandated after January 1, 1998. It requires input of a number of fuel parameters, one of which is the total aromatics content of the fuel. A standard test method was therefore developed by petroleum industry scientists and adopted by the ASTM as ASTM D5769 [1]. In this standard, 23 known aromatic compounds are monitored while provisions are made for unknown aromatics which may be present in the sample [2].
Instrumentation, method parameters and sample preparation
Gas Chromatograph/Mass Spectrometer:
Shimadzu GCMS-QP2020 with AOC-20i Split/Splitless Injector
Capillary column:
MEGA-1 MS, 60 m x 0.25mm, 1 µm, part number: MS-1-025-10-60

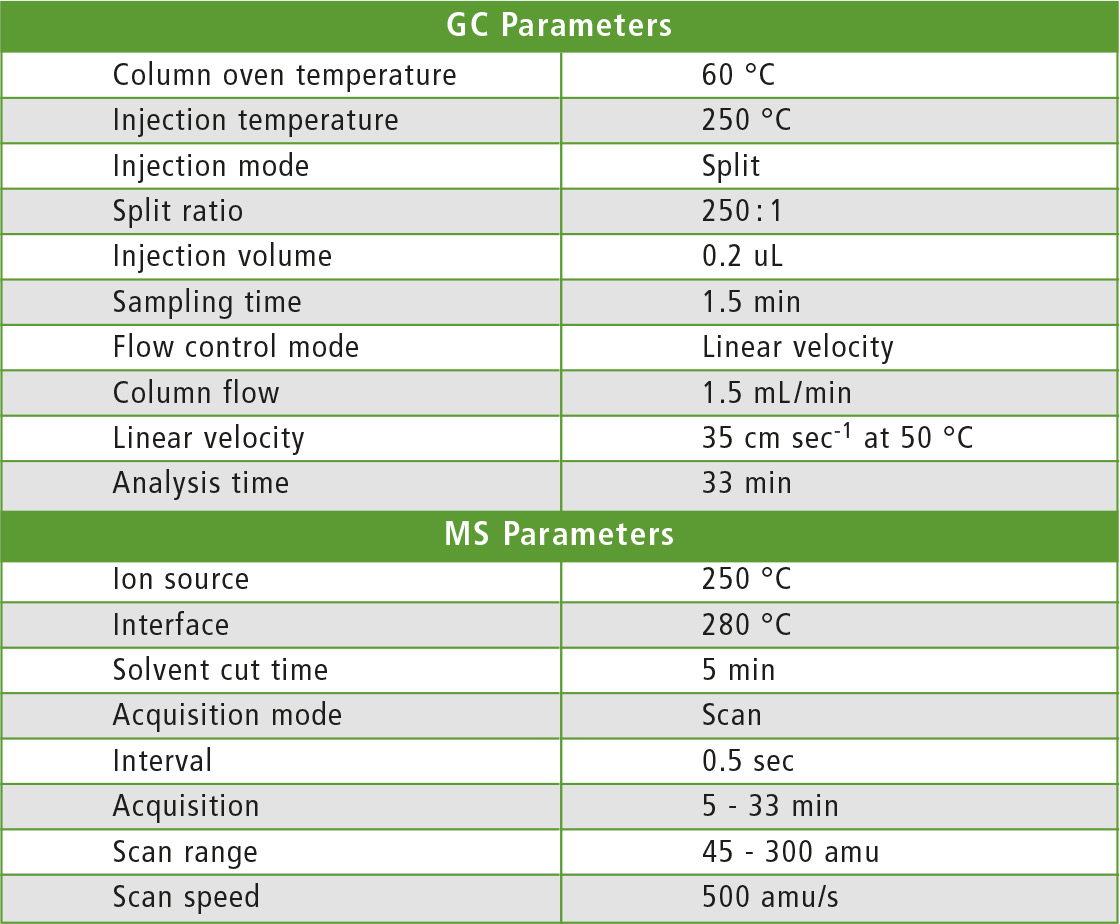 Table 1: Method parameters for GC-MS
Analytical method parameters are described in tables 1 and 2. With respect to sample preparation, the sample container was chilled upon reception in the laboratory, after which 1.0 mL of gasoline was transferred to a 1.8 mL vial. 120 uL of internal standard mixture were subsequently added. Both masses were recorded to calculate the exact %w/w concentrations of the internal standards in the test solution and the dilution that the sample underwent upon addition of the internal standard amount.
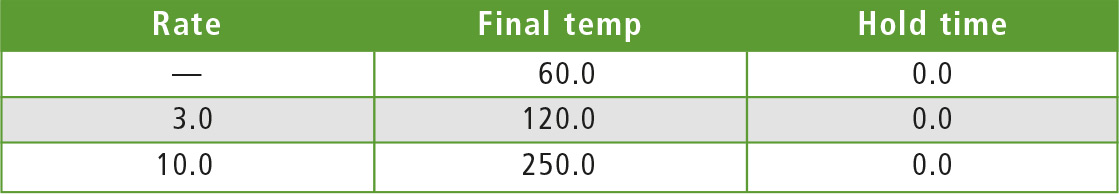 Table 2: Gradient program
ASTM D5769-04 acceptance criteria
The standard enforces strict acceptance criteria to ensure the quality of the results. Acceptance criteria were divided into four categories: Calibration curve, Gas Chromatography/Mass Spectrometry, QC sample, unknown samples.
Calibration curve:
- A multipoint calibration curve consisting of at least five levels should be obtained.
- For toluene, at least three points of the calibration curve should be higher than 50 % of the concentration range.
- Deuterated analogs of benzene, ethylbenzene and naphthalene should be used as internal standards.
- r2 ≥ 0.99 for the calibration curves of all compounds.
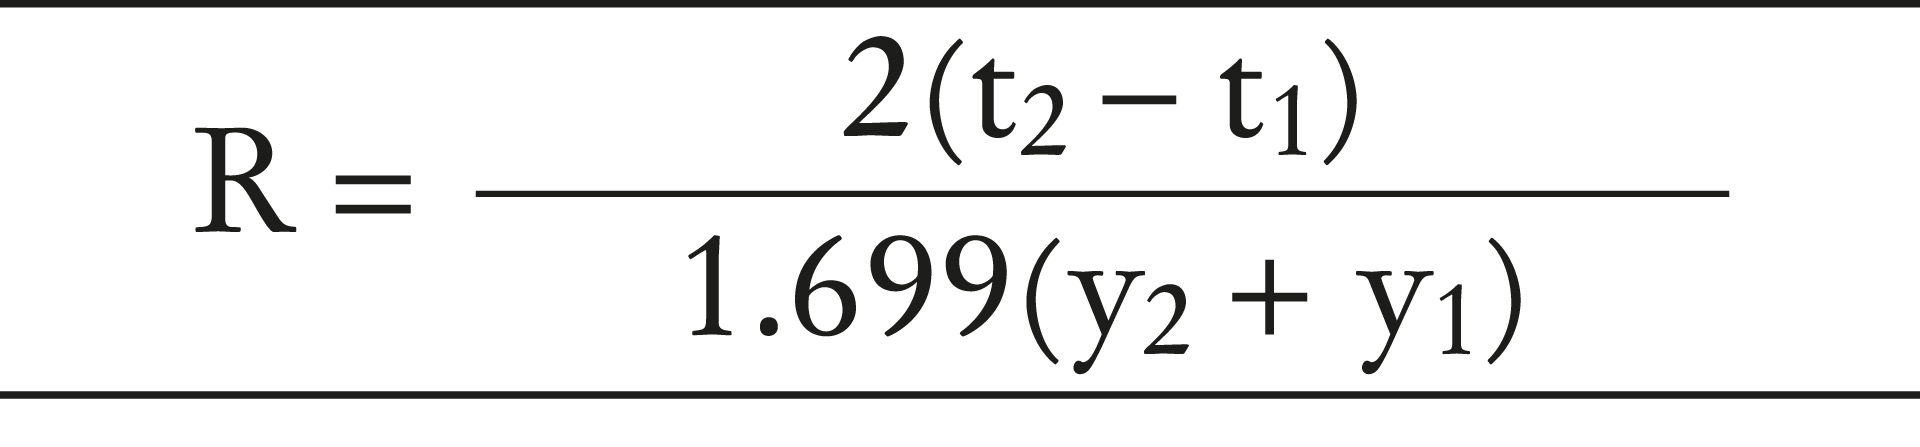 Figure 1: Calculation formula for resolution
Gas Chromatography/Mass Spectrometry
- Resolution between the peaks of 1,3,5-trimethylbenzene and 1-methyl-2-ethylbenzene each at the mass of 3 % level should be equal to or greater than 2.0. Resolution should be calculated according to the formula presented in figure 1, where:
R = Resolution
t2 = Retention time of 1,3,5-trimethylbenzene
t1 = Retention time of 1-methyl-2-ethylbenzene
y2 = Peak width at half height of 1,3,5-trimethylbenzene
y1 = Peak width at half height of 1-methyl-2-ethylbenzene - The system should be able to analyze repeatedly 0.01 % w/w 1,4-diethylbenzene with a Signal-to-Noise ratio of at least five.
- Scan speed should ensure at least five spectra in the FWHM for the peak of toluene at 1-3 %.
- A standard containing 1,2,3-trimethylbenzene (3 % w/w) should be injected, and the following relative intensities should be obtained: m/z 120: 30-60, m/z 105: 100, m/z 91: 7-15.
QC sample
A synthetic quality control mixture should be used to monitor the performance of the calibrated GCMS system. This QC sample should contain eight analytes in the levels described in table 5.
Apart from the analytes, the QC sample should also contain the following solvents: hexane (12 % w/w), heptane (17 % w/w), octane (17 % w/w), decane (12 % w/w), dodecane (5 % w/w) and 2,2,4-trimethylpentane (12 % w/w). The QC sample should be analyzed before each batch of samples.
Unknown samples
- Relative intensities of the monitored ions should comply with the acceptance criteria described in table 5, when compared to the values obtained for a calibration standard containing the compound at approximately the same concentration.
- Retention time at the maximum intensity scan should be within ± 15 s of the retention time of the respective calibration standard.
Results and discussion
A six-point calibration curve was obtained for all compounds, and one QC sample and one unknown sample were injected once. Acceptance criteria for the calibration curve, the GC-MS, QC sample and unknown sample were fulfilled. The chromatograms of a calibration standard and a sample of gasoline are presented in figures 2 and 3.
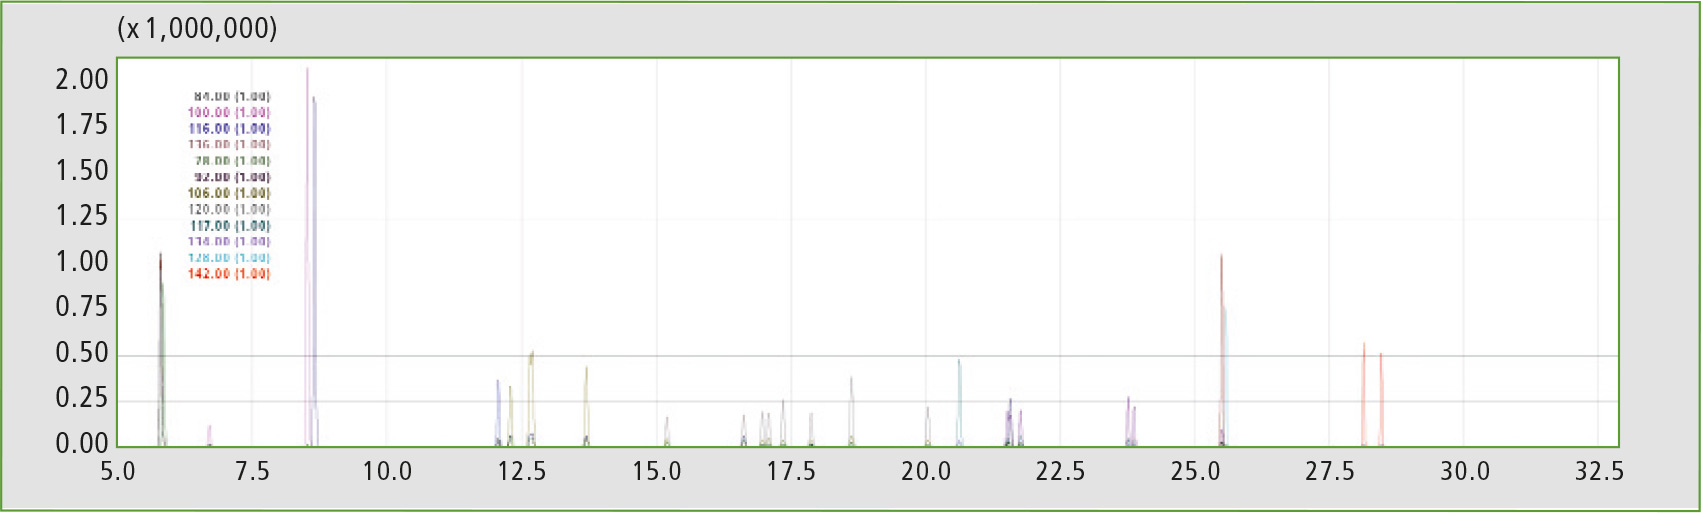 Figure 2: Chromatogram of a calibration standard (Cal-3)
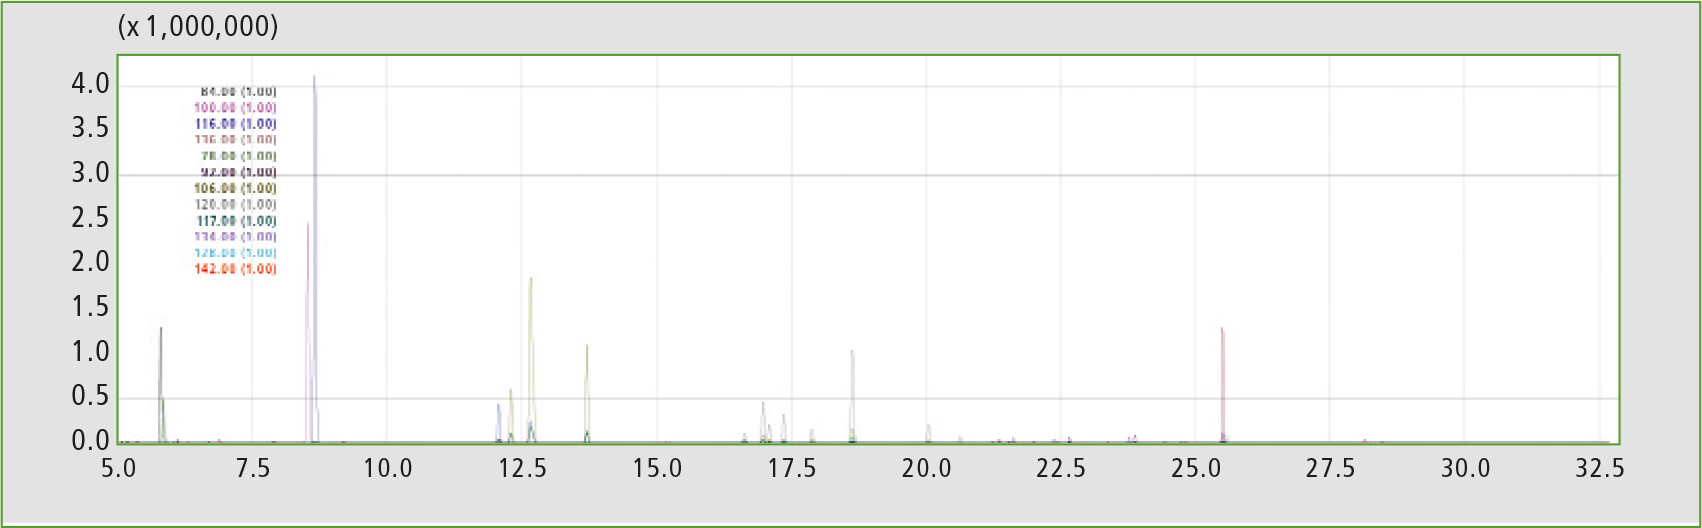 Figure 3: Chromatogram of a sample of gasoline
Calibration curve
- A multipoint calibration curve with six levels was obtained for each compound.
- For Toluene, three points of the calibration curve were higher than 50 % of the concentration range.
- Benzene d6, ethylbenzene d10, naphthalene d8 and toluene d8 were used as internal standards
- r2 was >0.995 for all compounds, as shown in table 3
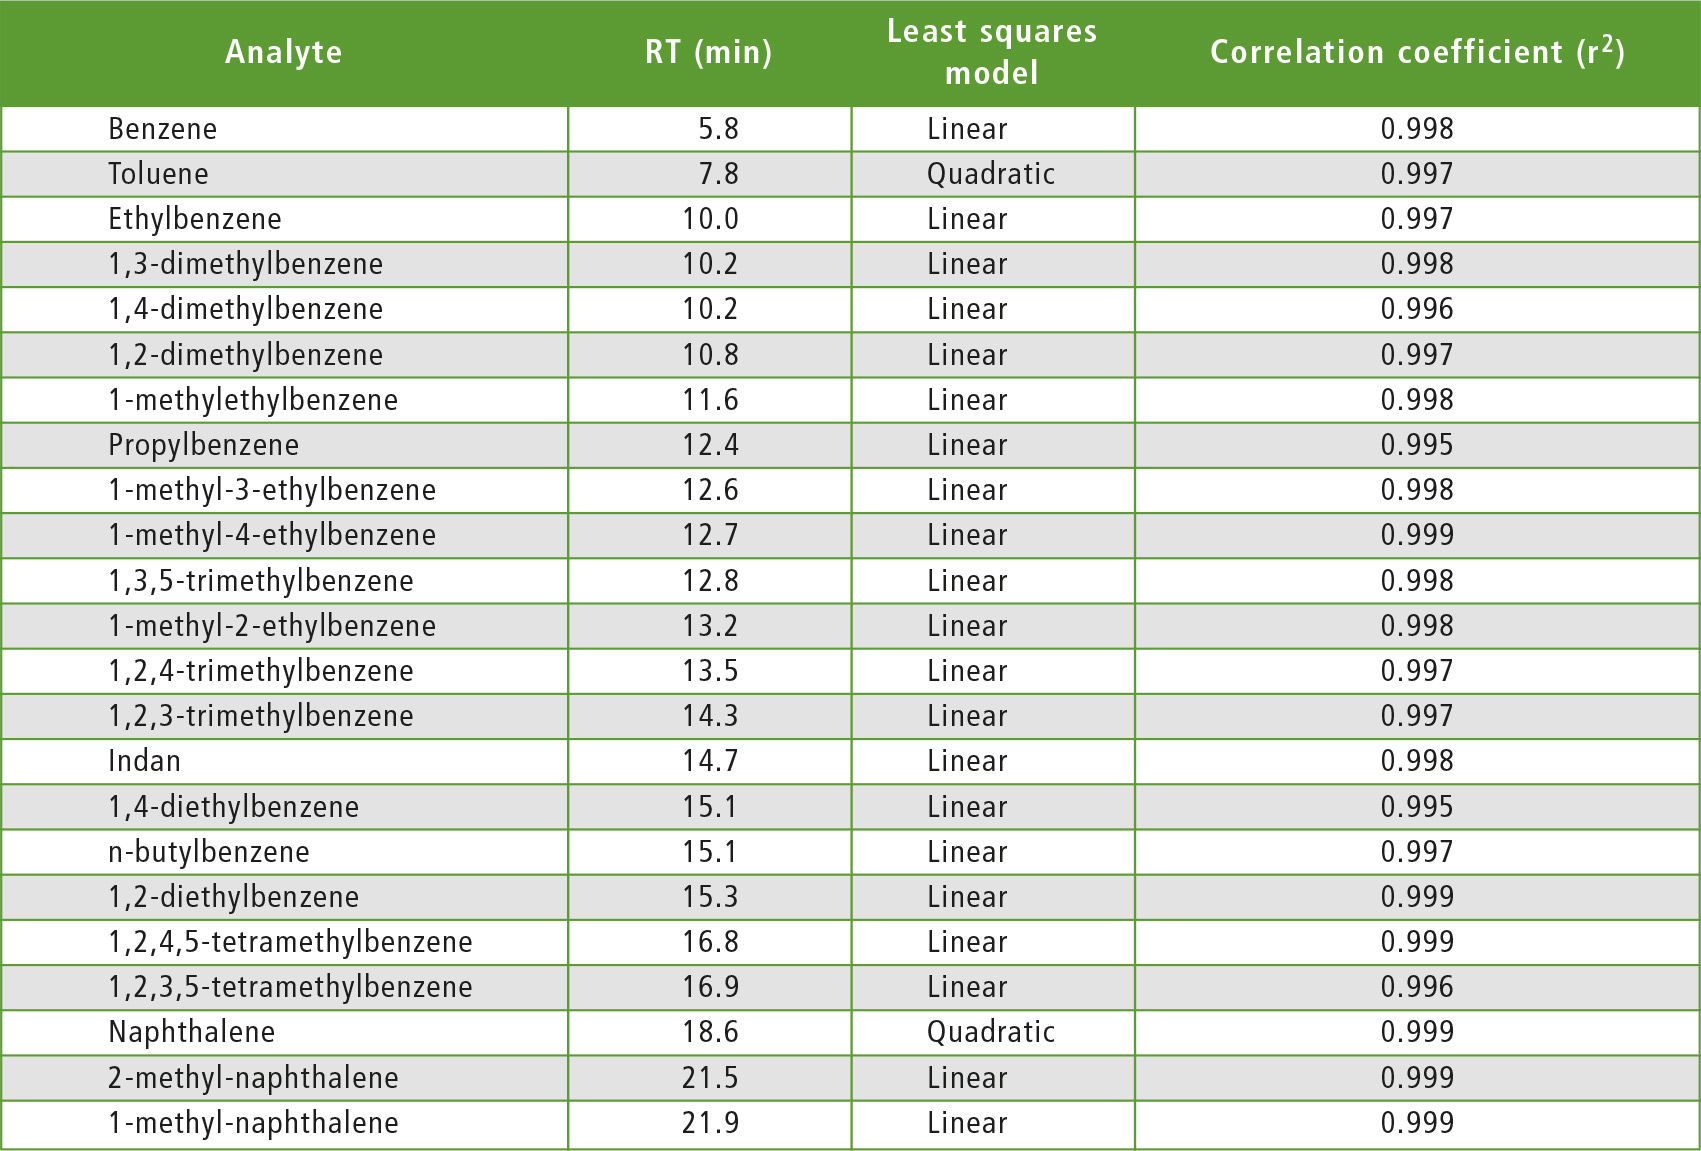 Table 3: Regression data
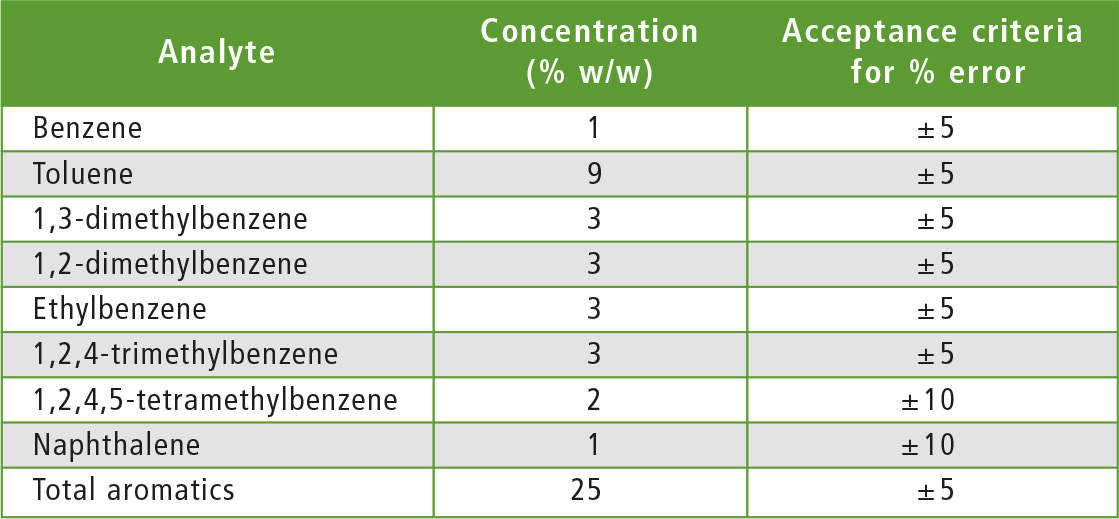 Table 4: Composition and acceptance criteria for the QC sample
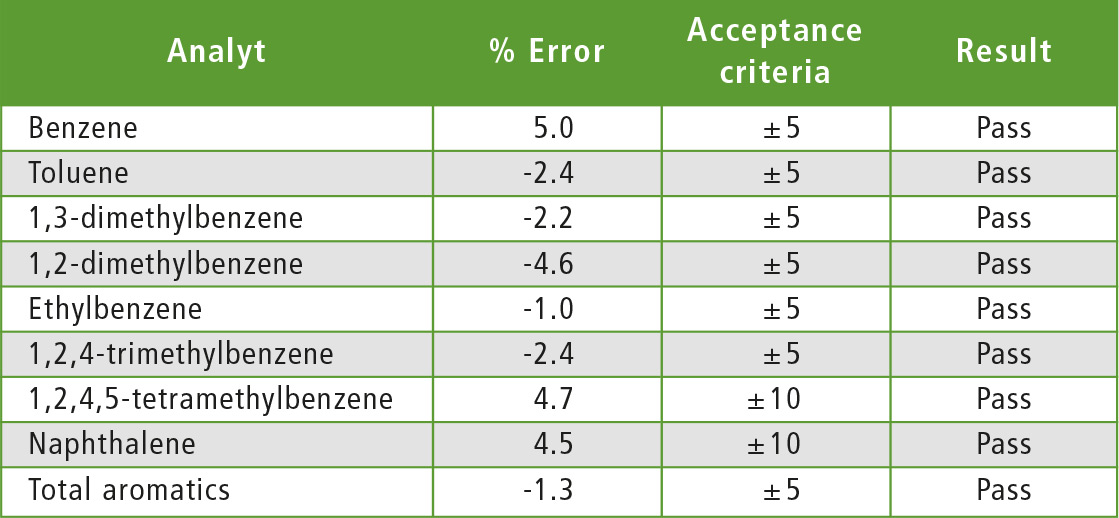 Table 5: Acceptance criteria for the relative intensities of the ions monitored
Gas Chromatography/Mass spectrometry
- Resolution between the two peaks at the mass of 3 % level was 3.5 (Specification: > 2.0).
- Signal-to-Noise ratios of 175.1 and 230.8 were obtained for 1,4-diethylbenzene 0.01 % w/w at m/z 134 (Specification: > 5)
- Scan speed ensured six spectra in the FWHM for the peak of toluene 1-3 %.
- The following relative intensities were obtained: m/z 120: 47.3 (Specification: 30-60), m/z 105: 100 (Specification: 100), m/z 91: 8.0 (Specification: 7-15).
QC Sample
- Accuracy of results is shown in table 6.
Conclusion
- Relative intensities of the ions monitored complied with the acceptance criteria described in table 5.
- Retention time at the maximum intensity scan was within ± 15 s of the retention time of the respective calibration standard.
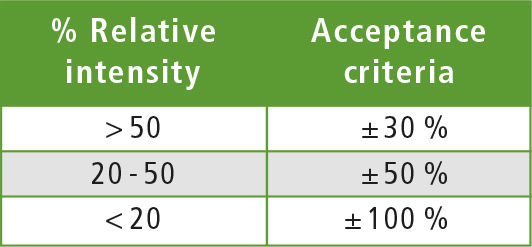 Table 6: Accuracy of results for the QC sample

Authors
Dr. Gerasimos Liapatas
Fotis Fotiadis
Georgia Flessia
Dr. Manos Barbounis
Applications Department of N.Asteriadis S.A.
31 Dervenion Str. & Poseidonos Str., 144
51 Metamorfossi Athens, Greece
Literature
[1] M. Mathiesen, A. Lubeck, Improving accuracy in the determination of aromatics in gasoline by Gas Chromatography/Mass Spectrometry, J. Chromatogr. Sci. 36 (1998) 449 – 456. DOI 10.1093/ chromsci/36.9.449 [2] D5769-04: Standard Test Method for the determination of benzene, toluene and total aromatics in finished gasolines by Gas Chromatography/Mass Spectrometry