Mineral oil residues in food
Determination of MOSH and MOAH using LC-GC-online technique and comprehensive chromatography
Mineral oil residues in food have attracted much public concern in recent years. Whether rice, noodles, olive oil or chocolate, there have been numerous examples of mineral oil contamination of food. At the moment, the challenges to face are the ubiquitous presence of mineral oils from the raw material to the finished product, and the lack of information concerning composition, health effects, analysis and regulatory limits.
To start from the beginning: Mineral oil hydrocarbons (MOH) are divided into the two groups of mineral oil saturated hydrocarbons (MOSH) and mineral oil aromatic hydrocarbons (MOAH). MOSH consist of branched and unbranched open chain hydrocarbons called paraffines and cyclic hydrocarbons with at least one saturated ring called naphthenes. They can accumulate in the human body and cause granulomas.
Mineral oil aromatic hydrocarbons (MOAH) consist of aromatic substance classes that can be highly alkylated and have 1-4 rings. They make up 15-30 % of the whole mineral oil fraction and contain potential mutagenic and carcinogenic substances [1]. The levels of mineral oil hydrocarbons found in food (e.g. in table 1) are therefore not tolerable.
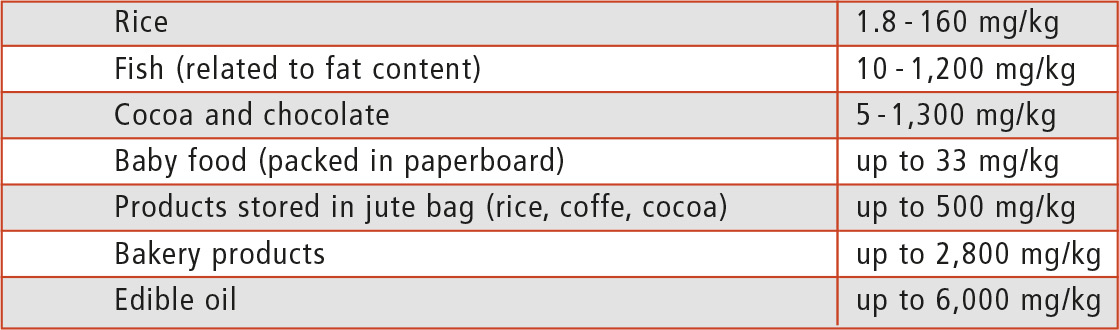 Table 1: Levels of mineral oil hydrocarbons detected in food [2]
Analysis of MOH is a big challenge
So far there are no EU-regulations and no approved analysis method for mineral oil residues (except-ing edible oil [3]), but MOSH concentrations of up to 2 mg/kg and MOAH levels below 0.5 mg/kg are considered to be acceptable [1]. Analysis of MOH is a big challenge due to its highly complex composition of unresolved and unidentified substances. As method of choice, online-coupled HPLC-GC-FID is used [4].
The concept of this method is the pre-separation of MOSH and MOAH fractions using normal phase high pressure liquid chromatography (HPLC), high volume injection (450 µL per fraction) onto a dual column gas chromatograph to improve sensitivity and to further separate the two fractions (e.g. to identify interferences), then flame ionization detection (FID) as non-selective detector, providing virtually the same response for compounds of interest. This results in a fully automatized, closed system without the possibility of sample contamination during pre-separation. To control elution from LC, transfer to GC and for quantification, a set of nine internal standards is added to the sample prior to analysis.
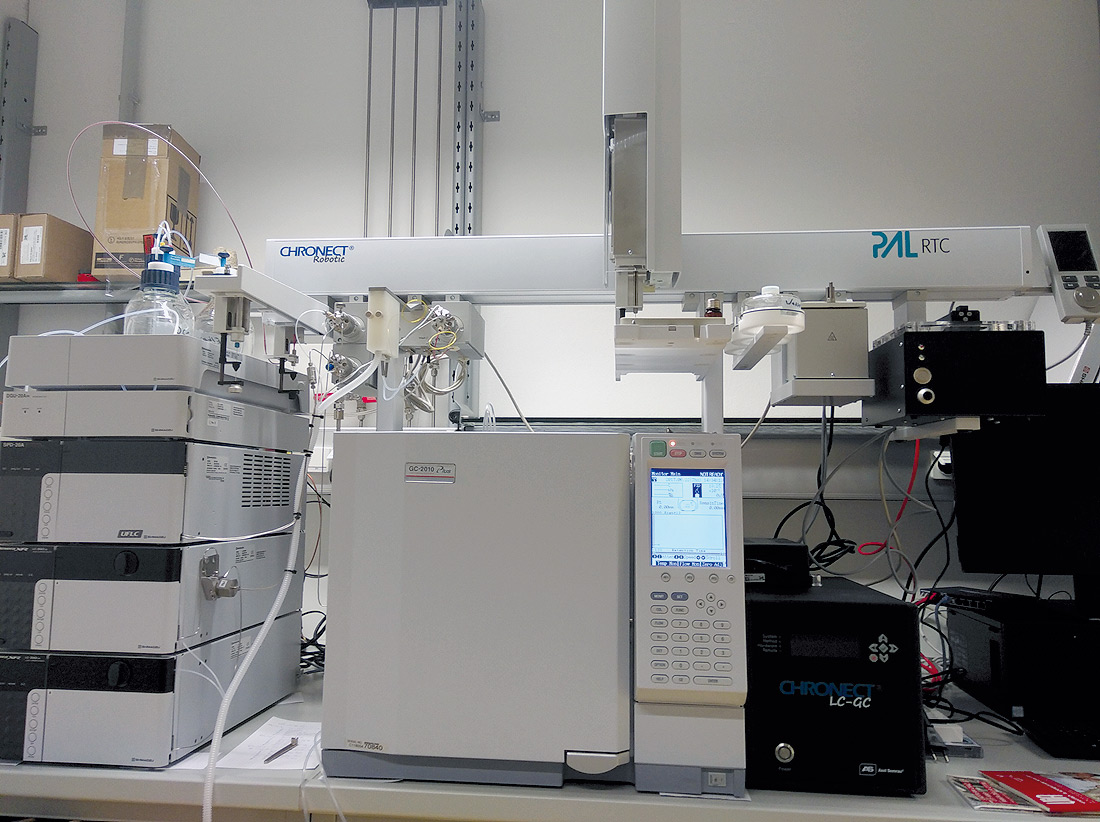 Figure 1: LC-GC-FID-online system with GC-2010 Plus, LC-20ADXR, SPD-20A and CBM-20A LITE
Due to the complex food matrix, sample preparation and analysis can be tricky. Dry foods like rice, noodles or spices are homogenized and extracted in Hexane/ Ethanol. The resultant extract is washed with water, dried with sodium sulphate and the volume adjusted to 1 mL. Aliquots of 50 µl extract are injected into the LC, and from there 450 µL are transferred directly onto the pre-columns for the MOSH and MOAH fraction respectively.
Analysis of native oils
Analysis of native oils is more challenging since they can contain many native olefins (eg. squalene, sterenes, carotenoids …) which interfere with the MOAH fraction. These interferences can be removed by epoxidation with 3-chloroperbenzoic acid (mCPBA). The peracid attacks double bonds in the olefins forming epoxides, thereby changing the polarity of the resulting substance in a way that it shows a different retention behavior and is removed from the MOAH transfer window [5].
Fully automatic epoxidation is possible. The oil sample is weighed into a 10 mL glass vial, and internal standard and n-hexane are added. The vial is placed in the autosampler rack of the LC-GC system and a 2 mL autosampler vial with Na2SO4 is prepared. The autosampler transfers the 10 mL vial into the agitator which is heated to 40 °C, and adds the epoxidation reagent. The reaction takes place at 40 °C for 15 min in the agitator.
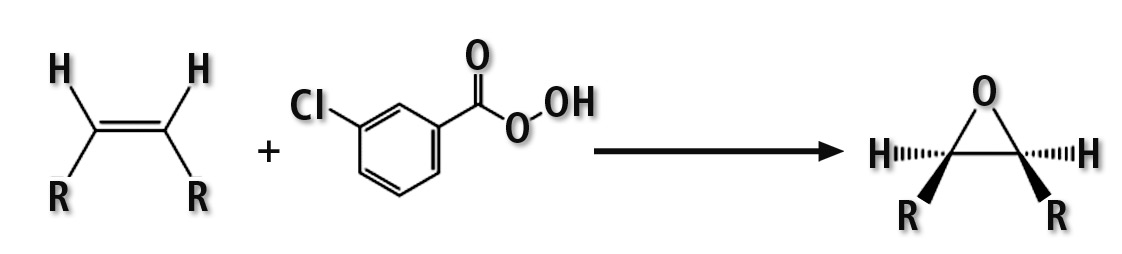 Figure 2: Reaction scheme of epoxidation
Afterwards, Na2SO3 (sodium sulphite) solution and Ethanol are added to stop the reaction and to enhance phase separation prior to centrifugation. After centrifugation, the autosampler transfers the vial back to the tray, and an aliquot of the upper hexane phase into the prepared 2 mL autosampler vial with Na2SO4 (sodium sulfate). After 5 min drying time, an aliquot of 50 µL of this phase is injected into the LC, and 450 µL are transferred directly on the pre-columns for the MOSH and MOAH fractions.
Figure 3 shows a chromatogram of the MOAH fraction of an extra virgin olive oil sample. The black trace shows the sample before epoxidation. The red marked area indicates the retention range of the internal standards. Due to the high concentration of squalene (marked in blue), the chromatography is so severely influenced that the internal standards cannot be used for quantification. The pink trace shows the same sample after successful epoxidation. Over 90 % of squalene was removed, the internal standards show perfect peak symmetry and no MOAH contamination masked by squalene could be found in the blue marked area.
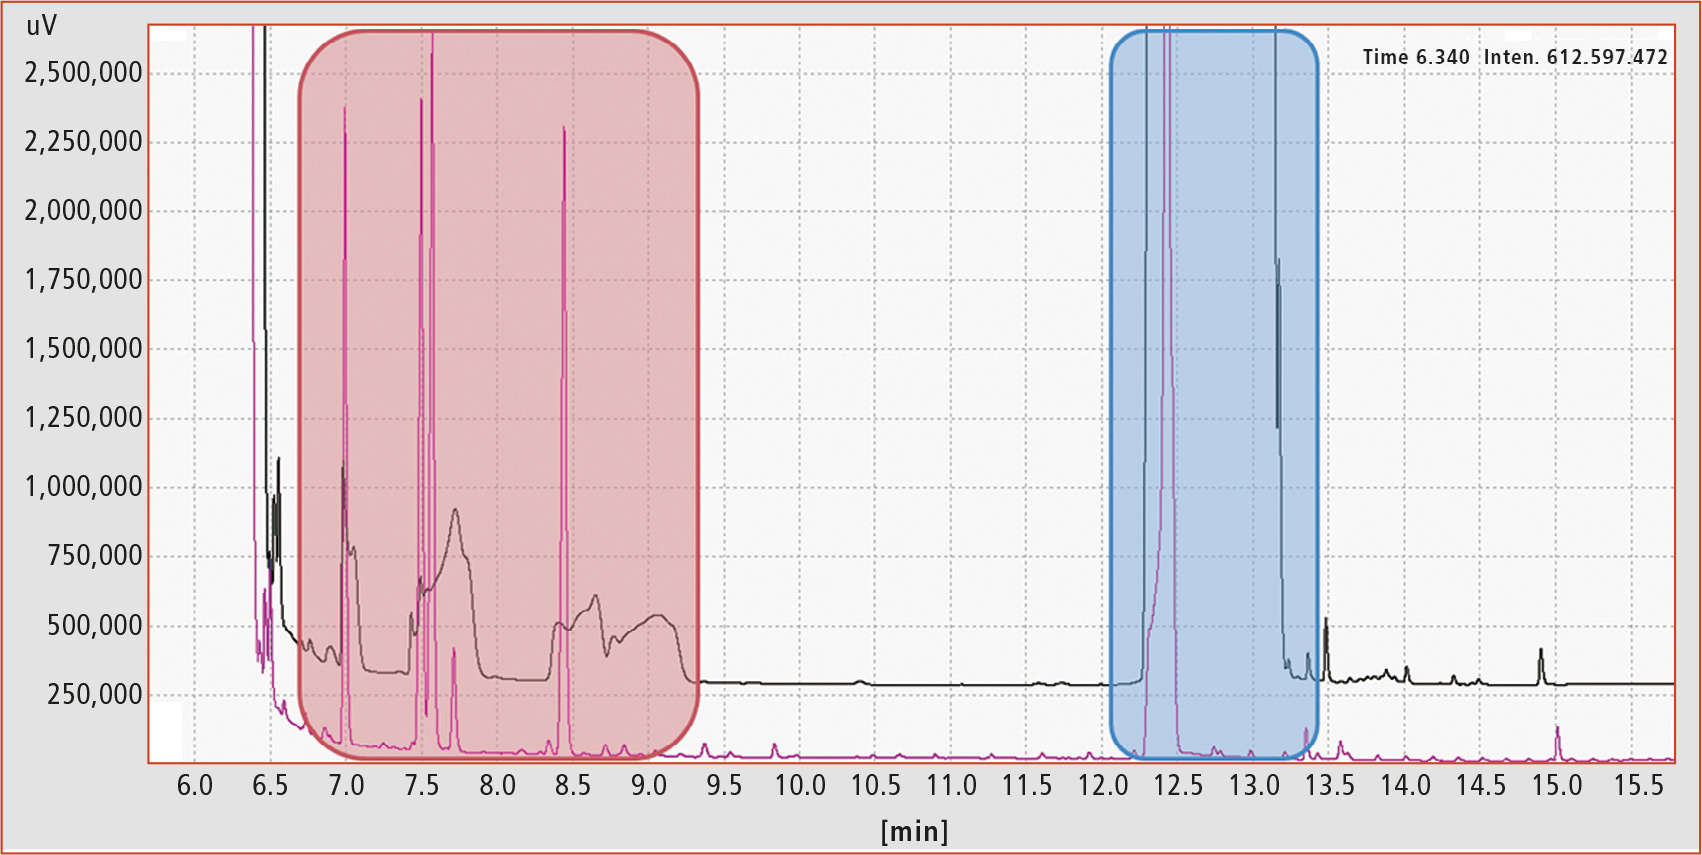 Figure 3: MOAH fraction of extra virgin olive oil sample before (black trace) and after epoxidation (violet trace). Retention range of internal standards marked in red, squalene in blue.
“Fract & Collect”: a powerful tool for separation and identification
Nevertheless, epoxidation of some samples is not satisfactory in terms of elimination of interferences and correct data evaluation. Figure 4 shows an example of a cumin extract before and after epoxidation. It was not possible to remove all interferences and to create an evaluable chromatogram, although harsh epoxidation conditions were used.
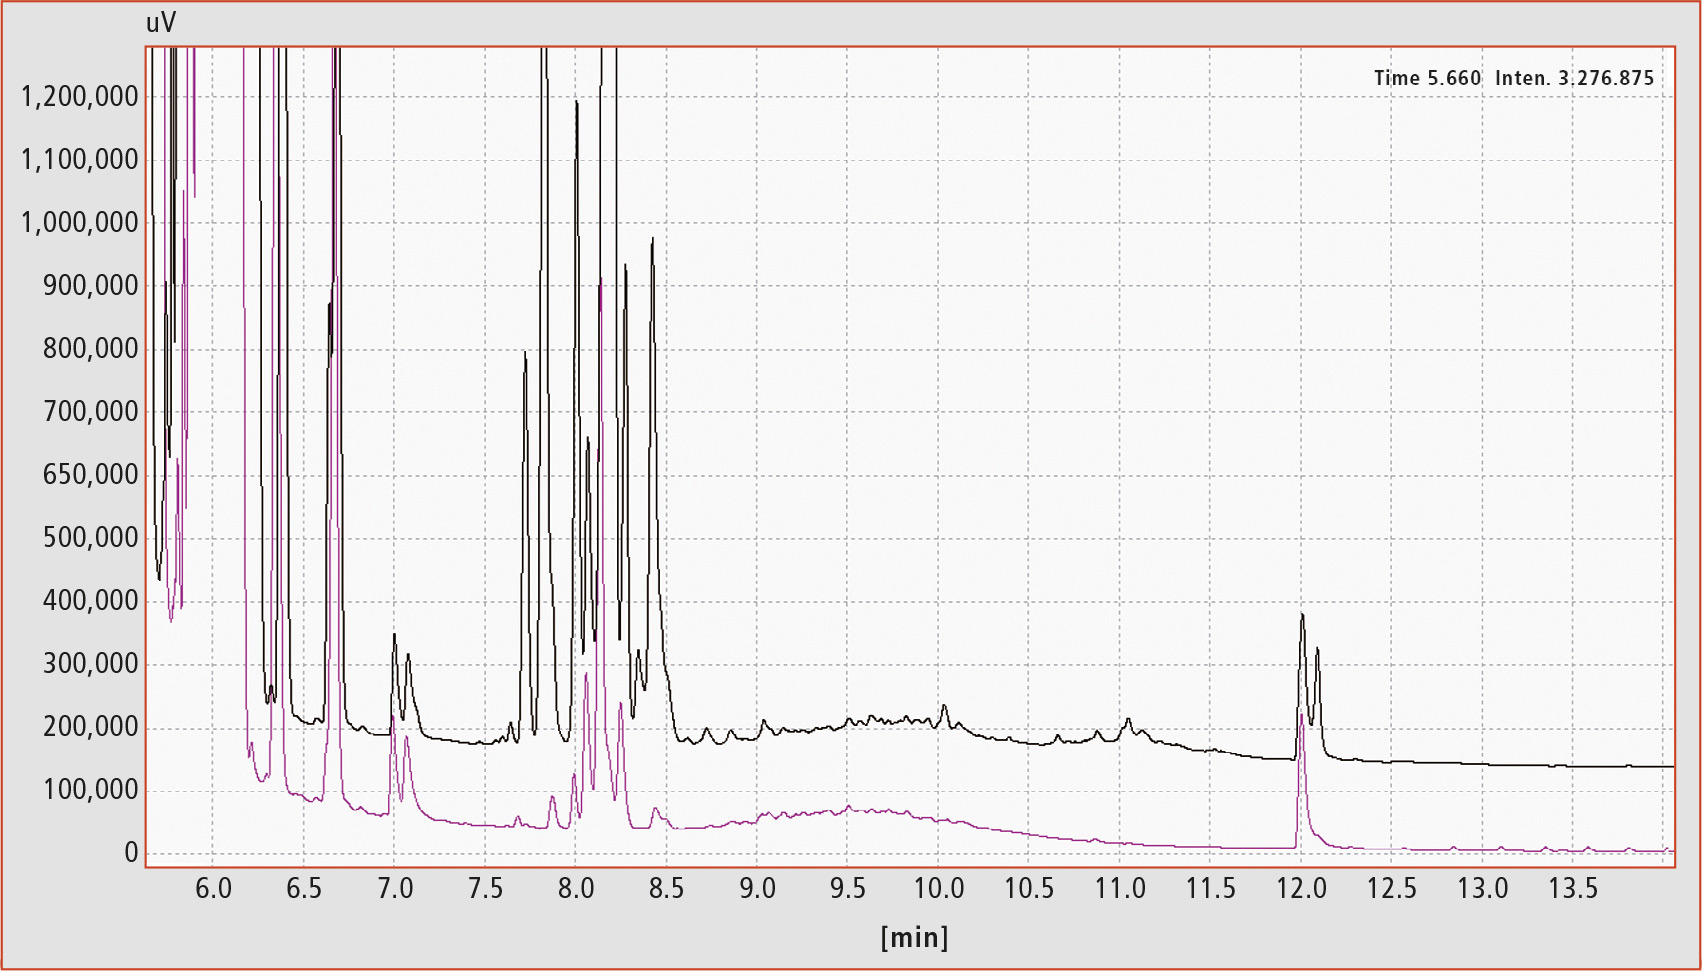 Figure 4: MOAH chromatograms of a cumin extract before (black trace) and after (violet trace) epoxidation
In such cases, a more powerful tool for separation and identification is used: The MOSH and MOAH fractions are pre-fractionated on the LC and collected using a method called “Fract & Collect.” Afterwards, comprehensive GCxGC-MS is used to further separate the fractions obtained from the LC and to identify and differentiate between interferences from MOSH and MOAH. In the chromatogram shown in figure 5, the red marked compounds refer to the internal standards, the yellow marked ones being mono- and diterpenes. The green marked area clearly shows MOAH which was difficult to identify in the LC-GC chromatograms.
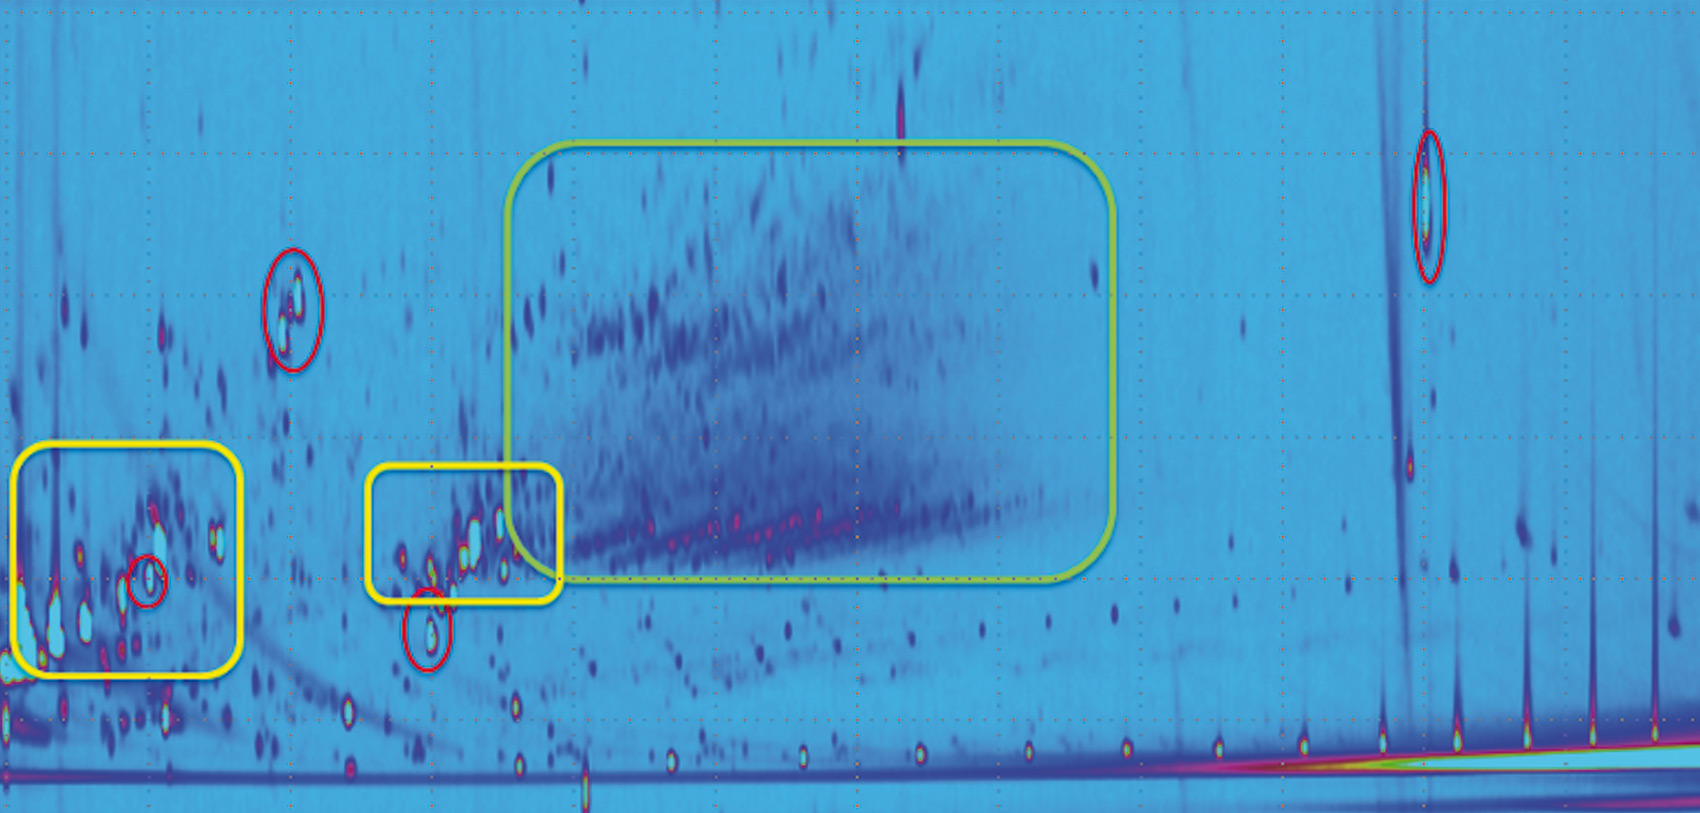 Figure 5: Comprehensive GCxGC-MS chromatogram of the MOAH fraction of an epoxidized cumin extract
For the analysis of chocolate or candy bars, fat and naturally occurring n-alkanes have to be removed. This is done using flash chromatography with silica and aluminium oxide prior analysis [4].
According to a proposed method published by the German Bundesinstitut für Risikobewertung (BfR), quantification is done by integration of the curve for different molecular weight regions [6]. For food contact materials, three ranges are proposed for the MOSH fraction (C10-C16, C16-C25 and C25-C35) and two ranges for the MOAH fraction (C10-C25, C25-C35). For dry food, only the ranges up to C25 are used.
Figure 6a shows the MOSH (black trace) and MOAH (purple trace) of a spaghetti sample with a MOSH concentration of 12.7 mg/kg from C16-C35. The internal standards are marked with symbols (black squares internal standards MOSH, purple stars internal standards MOAH).
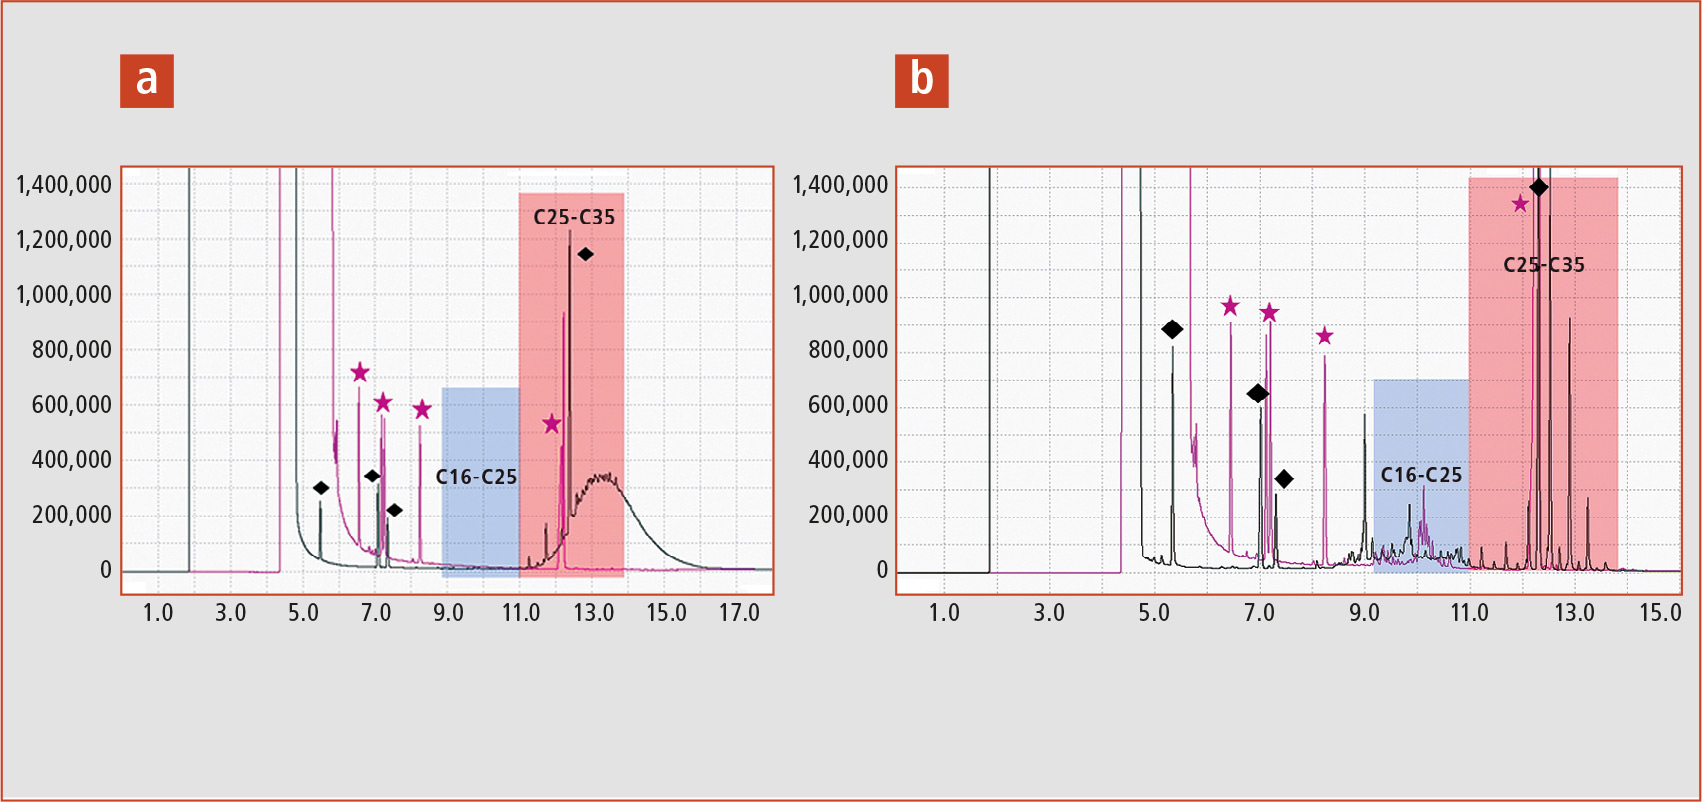 Figure 6: a) Spaghetti sample with MOSH concentration of C16-C35 and b) rice sample with naturally occurring odd-numbered alkanes
The rice sample in figure 6b also shows additional peaks in the rear part of the chromatogram. These are naturally occurring odd-numbered alkanes with a chain length of C21 to C35.
Summary
Analysis of mineral oil residues in food is a challenge. Due to the complex food matrix, auxiliary methods like epoxidation and flash chromatography are often necessary. Nevertheless, online coupling of HPLC with GC-FID provides a valuable tool for quick and easy analysis with automatization as an important key factor.
Read for you in chrom+food FORUM 4-18
Authors
Ao. Univ. Prof. DI Dr. Erich Leitner, Andrea Walzl, B.Sc., M.Sc. Graz University of Technology, Institute of Analytical Chemistry and Food Chemistry, Research group „Food Chemistry and Human Sensory Analysis”, Stremayrgasse 9/2, 8010 Graz
Literature
[1] Bundesinstitut für Risikobewertung (BFR), Stellungnahme Nr. 008/2010, 2010.
[2] EFSA Panel on Contaminants in the Food Chain (CONTAM), EFSA Journal, 2012 10(6), 2704-2889.
[3] Austrian Standards Institute, ÖNORM EN 16995, (2007).
[4] M. Biedermann, K. Grob, J. Chromatogr. A. 2012, 1255, 56-75.
[5] M. Nestola, T.C. Schmidt, J. Chromatogr. A., 1505 (2017), 69-76.
[6] webadresseBestimmung von Kohlenwasserstoffen aus Mineralöl [01.03.2018]