Fast GC without a handbrake
Filter time constant and sampling frequency improve the signal-to-noise ratio

The fast response time of detectors used in gas chromatography is often characterized solely by the maximum sampling frequency. However, the latest techniques using short-duration signals require noise filtering (filter time constant) to be adjusted as well. If this parameter remains unchanged, the response time of the detector is too slow and the mapped signal is falsified.
The ratio between the signal and the noise is decisive
In analytical applications, the ratio between the signal height and the baseline noise generally determines the achievable limit of detection. Developments in gas chromatography thus lead to ever sharper and thus higher signals. The sharpness of a signal is expressed by the full width at half maximum (FWHM) or the signal base width (W; see figure 1). The sharper the expected signals are, the faster the response time of the detector must be set up in order to correctly map the signals in the chromatogram.
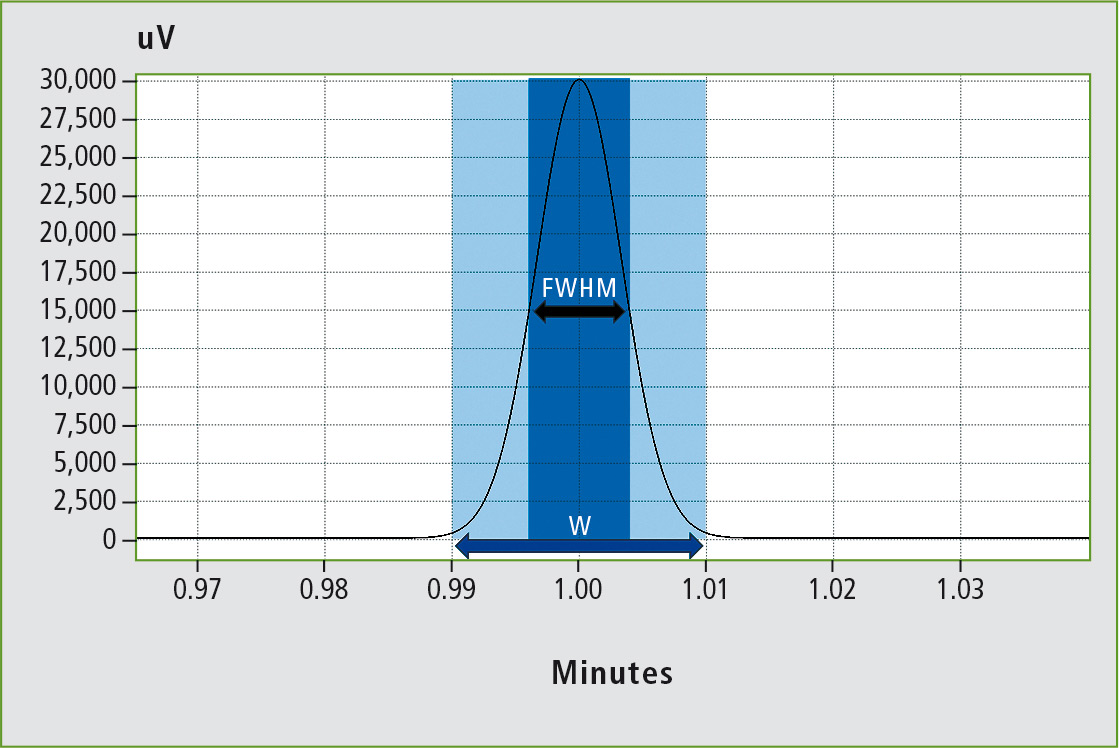 Figure 1: Definition of full width at half maximum (FWHM) and base width (w) of a signal
In this case, the first step is to adjust the sampling frequency. Shimadzu recommends calculating with around 25 measuring points per signal so that even asymmetrical signals (e.g. due to tailing) are shown correctly. A sampling frequency of 10 Hz is sufficient for signal base widths > 2.5 s. The baseline measured by the detector is thus an extrapolation over measuring points that were all sampled at 0.1 s. Since unneces-sarily high sampling frequencies increase baseline noise, the frequency should be suitable for the signal widths but not unduly high.
Fast GC techniques can achieve signal base widths of < 1 s. If the signal width approaches one second, the sampling frequency must be increased to 25 Hz. However, a second parameter also becomes essential: the noise reduction.
Electronic noise filters in a gas chromatograph reduce detector noise. In principle, high-frequency components in the baseline are attenuated by the filter in such a way that the measured signals should remain unaffected as far as possible. If the signals become sharper, noise filtering has to be adjusted via the filter time constant. However, this has the disadvantage that reducing the filter time constant also lowers noise reduction and thus baseline noise increases. Nevertheless, all the effort is worthwhile if sharp signals are mapped correctly, thus yielding a better signal-to-noise ratio.
When signals disappear due to noise reduction
The Nexis GC-2030 allows a maximum sampling frequency of 500 Hz for each detector in combination with a minimum filter time constant of 2 ms. Theoretically, this allows correct mapping of signals with a base width of 0.05 s, which is more than enough for all current techniques.
To determine how important adjustment of the filter time constant is, signals were generated with five different FWHMs using the integrated peak generator of the Nexis GC-2030. These were subjected to noise filtering just like any normally measured signal. With respect to effects due to the sampling frequency, it must be pointed out that the artificial signals are highly symmetrical and can thus be mapped reasonably well even at low sampling frequencies.
The influence of the filter time constant and sampling frequency on five signals generated with FWHMs of 0.1, 0.2, 0.3, 0.4, and 0.5 s was determined. The resulting base widths are 0.39, 0.76, 1.09, 1.59, and 2.04 s. All five signals have a fixed height of 30,000 µV. Any deviations from this value are mapping errors arising from the response behavior of processing the detector signals.
In the first series of measurements, these five signals were measured at a constant sampling frequency of 500 Hz using different filter time constants. Figure 2 shows the effect on the signal height. All signals remain virtually unaffected up to a filter time constant of 10 ms. As the filter time constant increases, sharper signals become increasingly smaller. From 100 ms upwards, signals with a FWHM of 0.5 s are then also affected by the noise filter and decrease in size. For a filter time constant of 200 ms, only 10 % of the actual signal height of 30,000 µV remain for the sharpest signal (FWHM of 0.1 s).
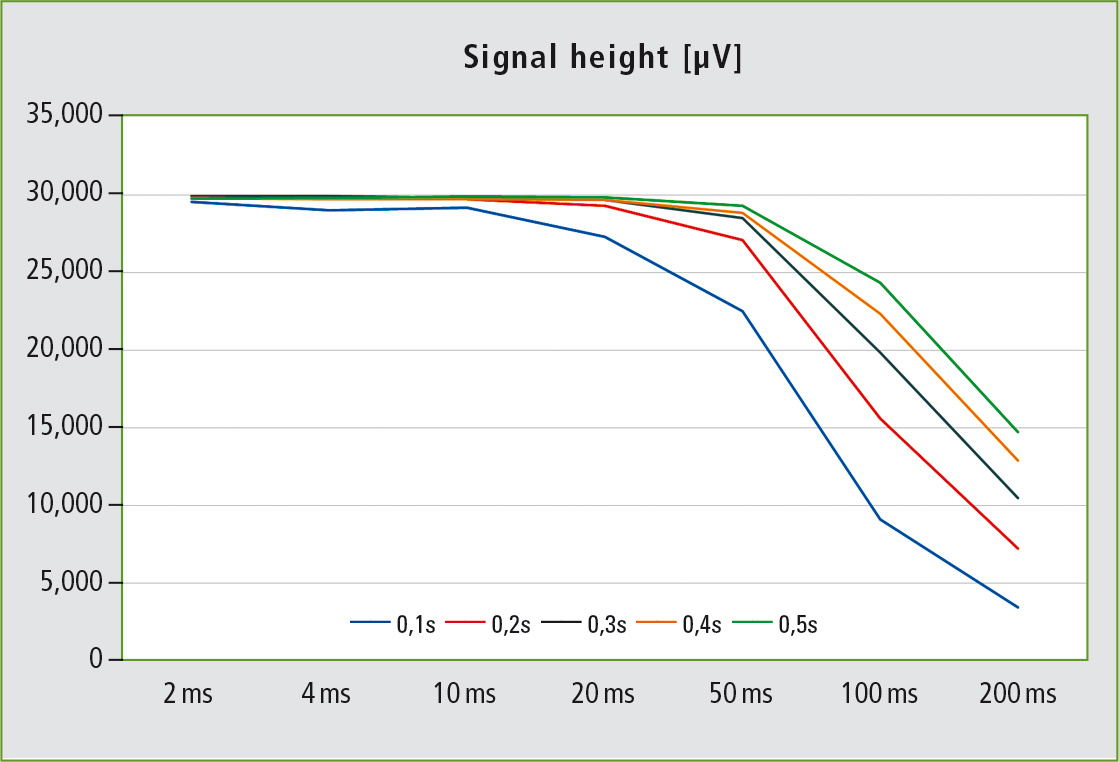 Figure 2: Decrease in the signal height for incremental increases of the filter time constant from 2 to 200 ms. The measured signal heights for the predefined signals with FWHMs of 0.1 – 0.5 s are depicted. The sampling frequency was kept constant at 500 Hz.
Figure 3 shows how the increasing filter time constants (10, 50, 100 ms) affect the shape of the signals. For a filter time constant greater than 10 ms, the signal width is affected if noise filtering is increased even further. For a filter time constant of 200 ms, the FWHM of the signal increases by a factor of ten from the original 0.1 s to 0.96 s; the base width of the signal increases even more strongly from the original 0.39 s to 5.43 s.
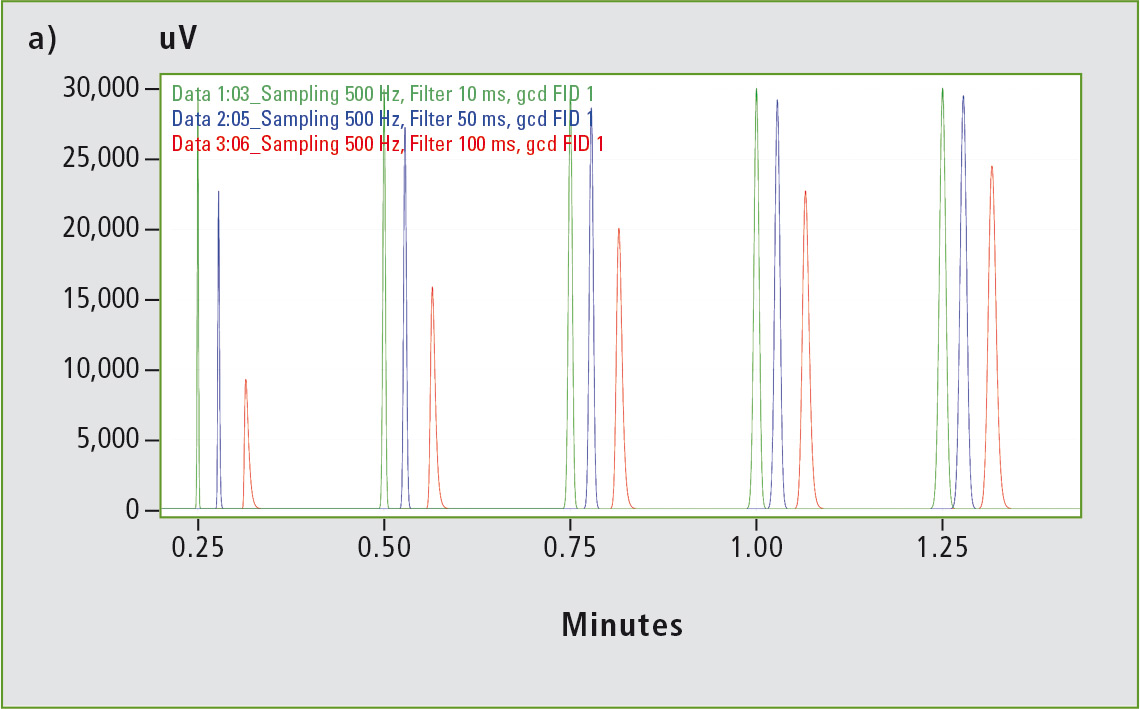
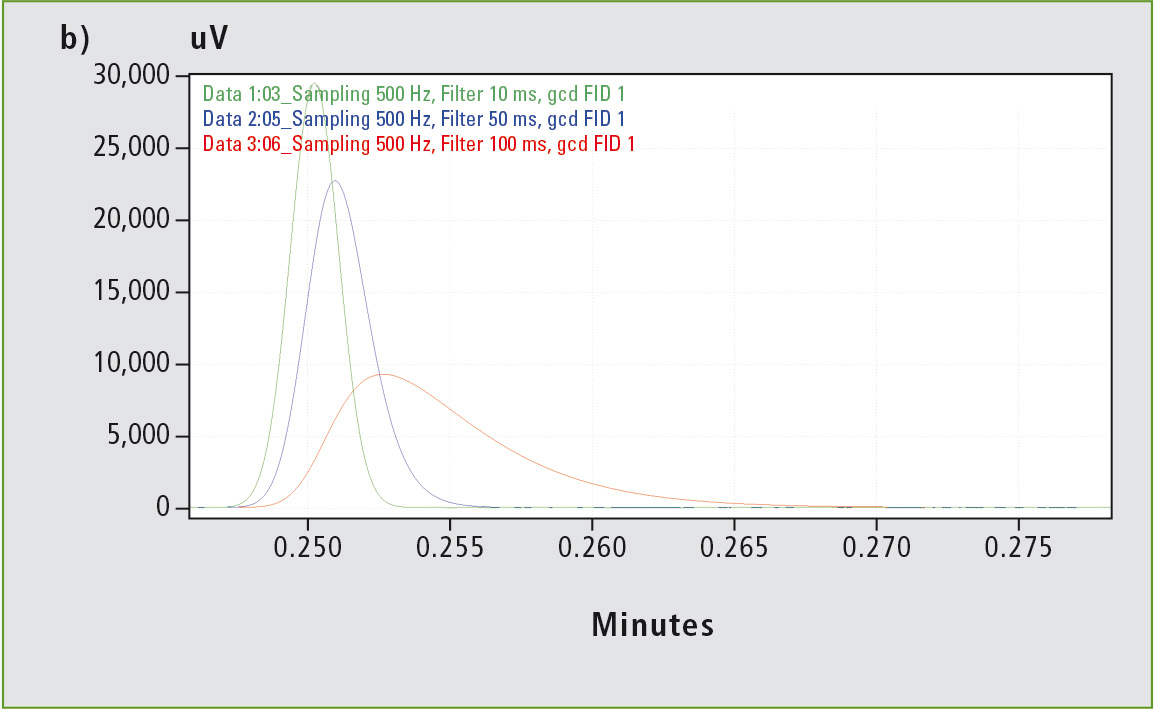 Figure 3: In (a), triplets of the five signals with FWHMs of 0.1 to 0.5 s are shown. The colors within a triplet represent the different filter time constants (green 10 ms, blue 50 ms, red 100 ms). In general, increasing the filter time constant leads to broadening and loss of signal height, which is exhibited particularly clearly by the sharpest signal with a FWHM of 0.1 s (see zoom in b).
Smaller effects on changing the sampling frequency
So what effect does changing the sampling frequency have under the same conditions? Once again, five signals are generated with FWHMs of 0.1, 0.2, 0.3, 0.4, and 0.5 s. In this case, the filter time constant is kept constant at 2 ms, whereas the sampling frequency is reduced incrementally from 500 Hz to 10 Hz. The result (figure 4) shows a less drastic effect than that of changing the filter time constant (figure 2). Up to 50 Hz, only a slight decrease in the signal height is observed for the signal with a FWHM of 0.1 s. Decreasing the sampling frequency even further decreases the height of the signal from the original 30,000 µV to about 20,000 µV.
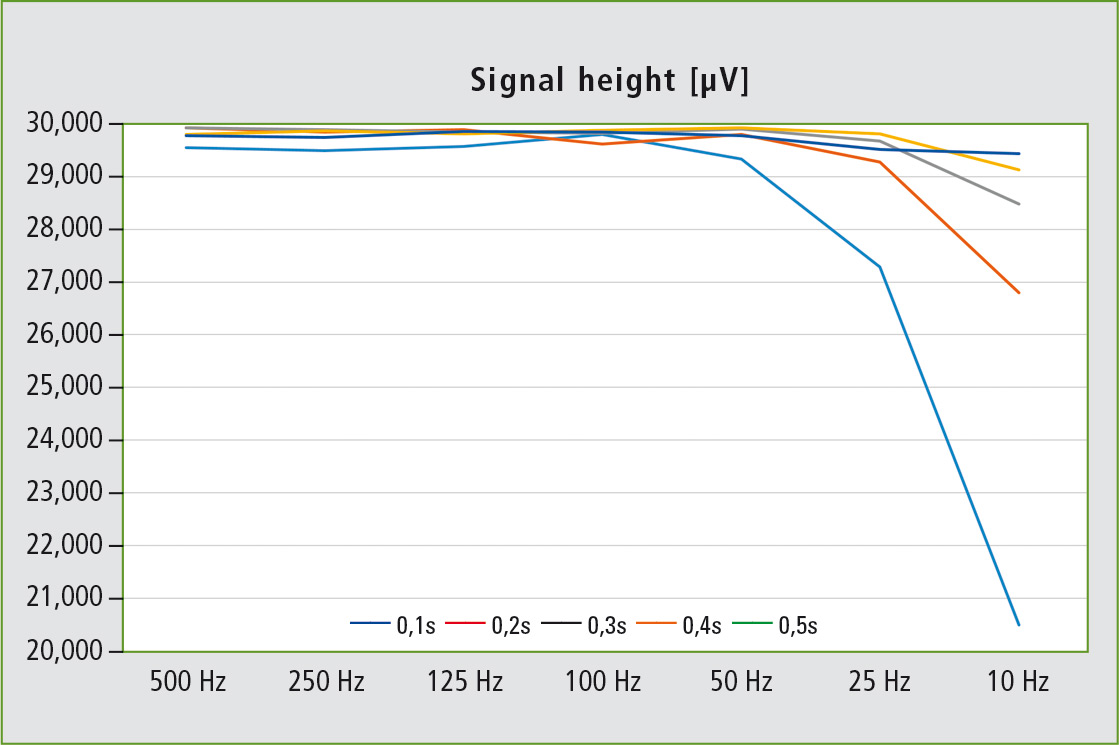 Figure 4: Decrease in the signal height with decreasing sampling frequency from 500 Hz to 10 Hz for the predefined signals with FWHMs of 0.1-0.5 s. The filter time constant was kept constant at 2 ms.
Summary
An experiment that can be carried out on any Nexis GC-2030 shows that when using the latest chromatography techniques it is not enough to adjust only the sampling frequency to the resulting signal sharpnesses. On the contrary, time constants as well as the sampling frequency leads to the best signal-to-noise ratio, which ultimately defines the achievable limit of detection and thus allows fast GC – without a handbrake.
Literature
J. V. Hinshaw, LCGC (2002), volume 15, page 152.