Plastics – Water content as indicator for ageing processes
Precise measurements using FTIR microscopy
6 billion tons of plastics have been produced worldwide in the last 50 years. Due to their many versatile properties, plastics can be found in virtually all products. ‘Low-density’ (LD-PE) and ‘high-density’ (HD-PE) polyethylenes in particular are almost exclusively used in the packaging industry as they are long-lasting and persistent.
When plastics are used as packaging materials, it is important to test their water content during quality control, as this solvent can potentially transport product components outside of the packaging, as well as components from the environment inward. In addition, the water content can contain information about the condition of the polymer, since water is formed in light-induced ageing processes of polyethylene [1]. Due to capillary forces, water moves between the polymer chains, from the polymer surface into the core and forms water clusters. In the event of damage, a spatially resolved analysis of water within the packaging material could offer indications of potential causes.
In general, ageing processes of plastics can be observed easily using infrared spectroscopy, due to the high detection sensitivity of the resulting decomposition products such as water, aldehydes or carboxyl groups [1]. A great advantage of this type of analysis is its non-destructiveness and its minimal effort required. Complex sample preparation steps are not usually needed. The high spatial resolution required can be achieved using an FTIR microscope. In this way, even the smallest sample components can be examined accurately for possible damage.
In the present analysis, ‘low-density’ and ‘high-density’ polymer granulates in various ageing stages have been investigated – from new materials to recycled materials and plastic wastes from the oceans.
In the first step, the samples are split so that the outer surface and the core of the respective granulates become accessible. Small fibers are then cut from the outer and inner surfaces using a scalpel. These can be measured directly with the FTIR microscope.
Reflectance mode with the mirror as supporting surface is particularly suitable for this purpose. For measurements in the transmission mode, the use of a diamond compression cell is recommended. The separated fibers are pressed into a thin film and can be measured without any additional supporting surface.
Evaluation of the spectra
The determination of adsorbed water in polyethylene using FTIR microscopy requires special chemometric methods. Among other reasons, this is due to water in the form of moisture being contained in the background signal (atmosphere). In addition, water is adsorbed at ambient temperature onto the surfaces of the measurement system.
These effects are counteracted by subtracting the background spectrum as well as using empirical atmospheric corrections. A further challenge lies in the complex vibrational bands of water. At ambient temperatures, there are many different vibrational and rotational states due to van der Waals interactions. This results in very broad and finely split absorption patterns in the wavelength range of 4,100 – 3,500 cm-1 and 2,000 – 1,200 cm-1 (see figure 1) [2].
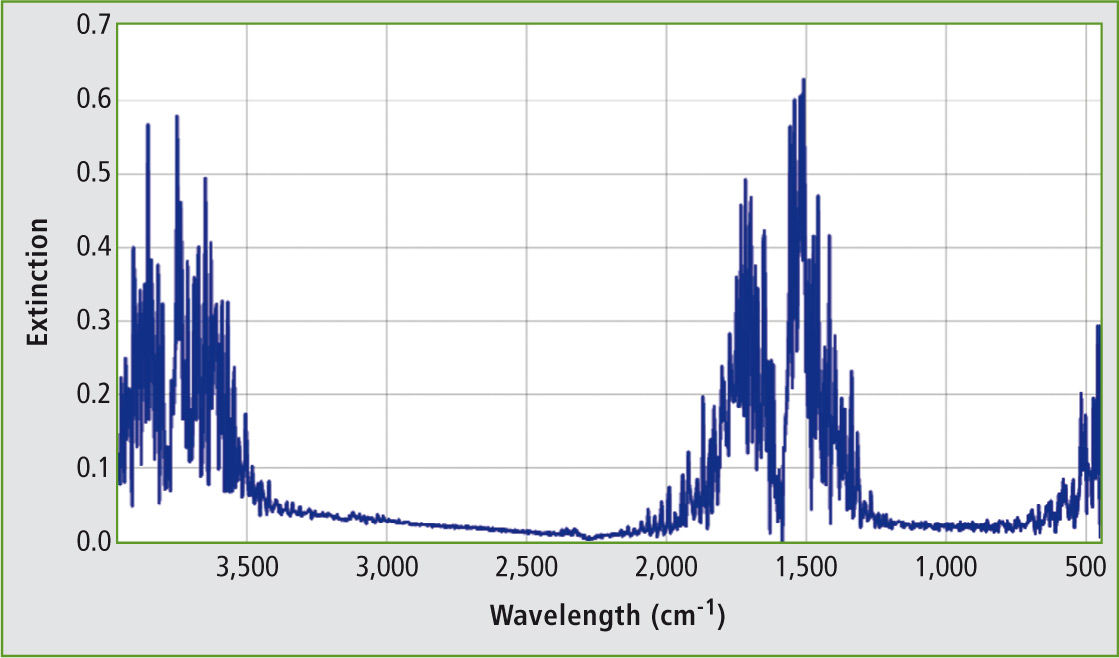 Figure 1: FTIR spectrum (absorption) of water. Typical broadband, finely split absorption patterns in the wavelength range of 4,100 – 3,500 cm-1 and 2,000 – 1,200 cm-1 [2][5].
As a result of these two effects, a semi-quantitative comparative analysis of the spectra is recommended. In this method, the second derivative of the spectroscopic data, including a Savitzky-Golay smoothing, is first determined. This corrects the baseline and enables a better comparison between the individual samples [3]. Using conventional statistical methods such as the ‘two sample t-test’ and the ‘effect size’, the ranges of the IR spectrum exhibiting significant differences between the sample’s inner and outer surface can subsequently be isolated (figure 2). The t-test determines the significance of a difference between two mean values, while the effect size describes the extent of that difference [4].
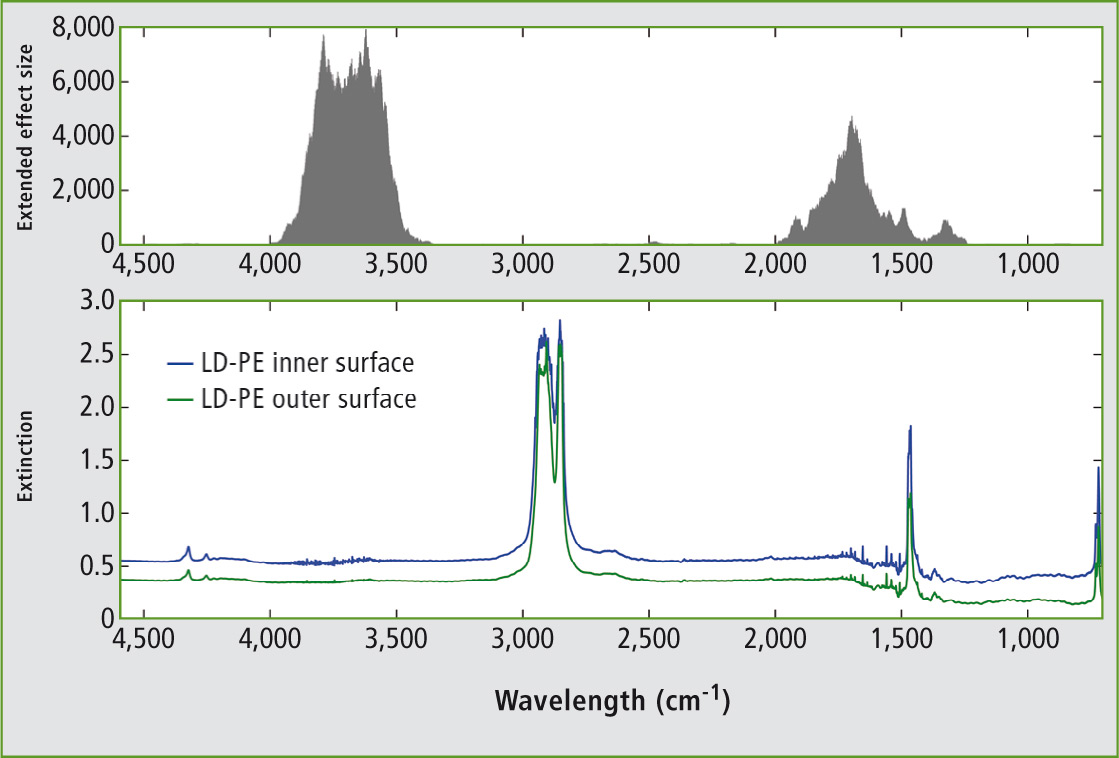 Figure 2: (Bottom) A comparison of mean value FTIR spectra (absorption) of LD-PE granulates (new material) from five measurements each of the outer and inner surfaces. The inner surface exhibits an increased background absorption and a strongly pronounced water absorption pattern. (Top) The extended effect size shows various ranges in the FTIR spectrum, which differ significantly. The water absorption ranges are clearly visible.
Results and perspectives
Using FTIR microscopy, it can be shown that in terms of water content, there are significant differences between ‘low density’ and ‘high density’ polyethylenes, as well as between new materials and plastic wastes. Much smaller water clusters are present in HD-PE, which can be attributed to the increased crystallinity. However, the theory on ageing processes of polyethylene can also be confirmed, as comparatively large quantities of water can be determined in the significantly aged plastic waste samples. A comparison of the spectra of all measured samples as well as a comparative analysis is shown in figure 3. The samples were measured using Shimadzu’s AIM-8800 FTIR microscope.
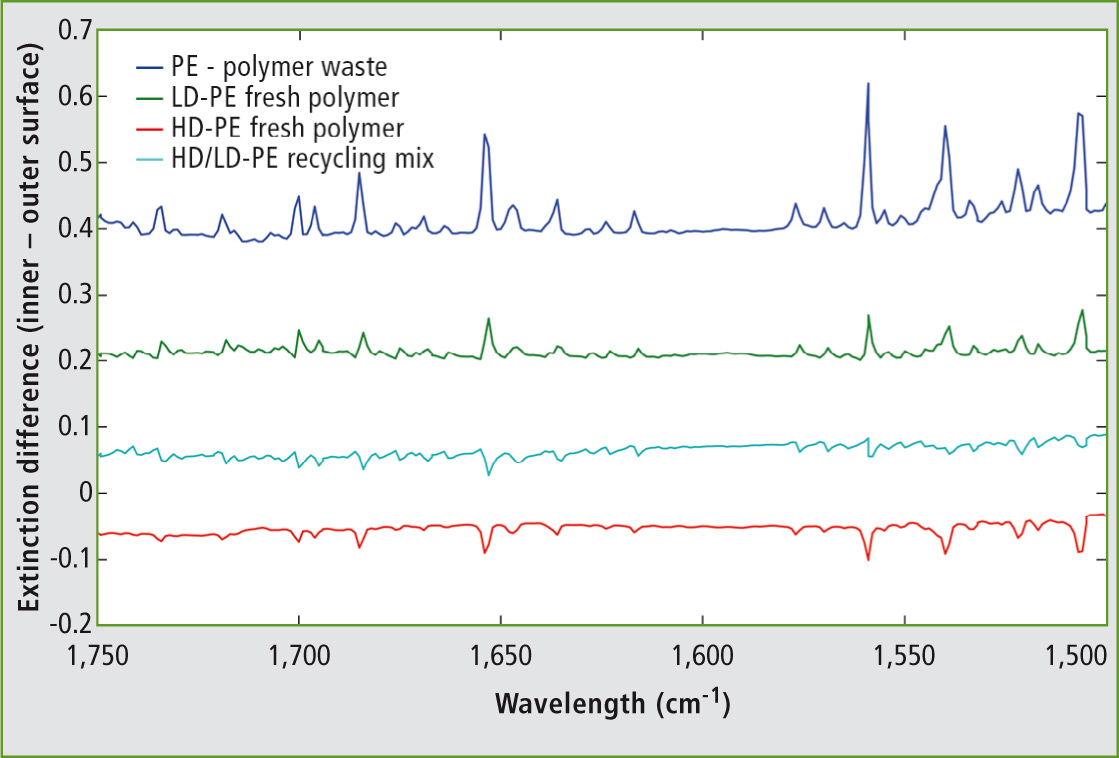 Figure 3: FTIR subtraction spectra (absorption inner surface – outer surface) in wavelength ranges 1,750 – 1,500 cm-1 (water absorption) [2][5]. The plastic waste investigated shows the most pronounced water absorption, which can be indicative of the quantitatively highest water content. LD-PE exhibits a slightly increased water content in the interior of the granulate, while HD-PE exhibits even less water in the core. The recycled sample is a mixture from both PE variants and lies between LD-PE and HD-PE.
The method presented can be extended through the use of a microtome for improved spatial resolution and reproducibility. In addition, as part of a multivariate data analysis, a calibration of the water content is conceivable.
Authors:
Gerrit Renner, Jürgen Schram
Department of Chemistry
Frankenring 20, 47798 Krefeld University of Applied Sciences Niederrhein, Germany
Albert van Oyen
CARAT GmbH Research
Harderhook 20, 46395 Bocholt Germany
References
[1] K. Jansen, Influence of acid on the photochemical ageing of UV-stabilized polyethylene films, Dissertation University of Berlin, Germany (2003), 75-93
[2] T. Bruno, P. Svoronos, Handbook of Basic Tables for Chemical Analysis, CRC, (2003), 351
[3] B. C. Smith, Fundamentals of Fourier Transform Infrared Spectroscopy, CRC, (2011), 69-74
[4] J. Cohen, Statistical Power Analysis for the Behavioral Sciences, LEA, (1988), 274
[5] G. Socrates, Infrared and Raman Characteristic Group Frequencies, WILEY, (2001), 26