Bilirubin determination in cerebrospinal fluid following a subarachnoid hemorrhage
Stroke, aneurysm – UV spectroscopy supports fast response
The UV spectroscopic application presented here is based on the ‘National Guidelines for analysis of Cerebrospinal Fluid for Bilirubin in suspected Subarachnoid Hemorrhage’ according to Beetham [1].
The causes of cerebral hemorrhage can be diverse, such as a stroke or an aneurysm. In order to take appropriate measures for treatment of a patient, it is important for the physician to determine which type of blood (old, fresh or none) is present in the cerebrospinal fluid. In case of illness, red blood cells will initially enter the cerebrospinal fluid. These cells contain oxyhemoglobin, which is converted to bilirubin by enzymatic processes. In addition to bilirubin, methemoglobin may also be formed.
As the process is time-dependent, the bilirubin concentration and the presence of oxidation products such as oxyhemoglobin provide information on the state of the patient. In addition, it is possible to estimate the duration of the oxidation process.
Subarachnoid hemorrhage is a pathological event in the central nervous system. It is characterized by bleeding into the subarachnoid space, which is filled with cerebrospinal fluid (CSF, liquor cerebrospinalis). Subarachnoid hemorrhage accounts for up to 10 percent of all strokes.
This particular form of stroke is, in most cases, caused by rupture of an arterial vessel due to an abnormality. Subarachnoid hemorrhage is accompanied by sudden onset of a very severe headache and neck stiffness. This can lead to short-term decreased levels of consciousness, but also to severe permanent brain disorders (quoted from Wikipedia).
Bilirubin determination, such as the determination of bilirubin in CSF, is an analytical method used in clinical analysis. In CSF-bilirubin determination, cerebrospinal fluid is analyzed for blood fragments. CSF bilirubin = cerebrospinal fluid bilirubin.
Multi-component measurement required
The color pigments mentioned above are suitable for spectroscopic analysis in the visible range. Quantitative but also qualitative assessment as well as color representation are the domain of UV-VIS spectroscopy. Since cerebrospinal fluid is a mixture not only represented by hemoglobin, it therefore requires a multi-component measurement, as all spectra of the individual components overlap (superposition). In this case, a straight baseline as would be expected in the analysis of liquids is not measured, but rather a rising baseline extending into the UV range. This effect occurs due to substances responding to UV irradiation, such as proteins or other high-energy compounds (pi electrons) in materials whose spectra are expected to be similar to hemoglobin spectra.
This shifting baseline presents a challenge for the automated analysis of very small maxima or shoulders in a signal pattern. Various analytical methods are applied to separate these pigments (HPLC). Fast testing methods can also be performed, such as use of a grating spectrometer for the rapid screening of hemoglobin.
Defined measuring method
Beetham has defined the measuring procedure according to which measurement should be carried out in the visible range from 350 to 600 nm. The analytical wavelengths for the hemoglobin color pigments are listed in table 1. The method requires corrected signal heights, realized via the baseline/ tangents under the signals/bands. Net bilirubin absorption is determined using a fixed wavelength of 476 nm.
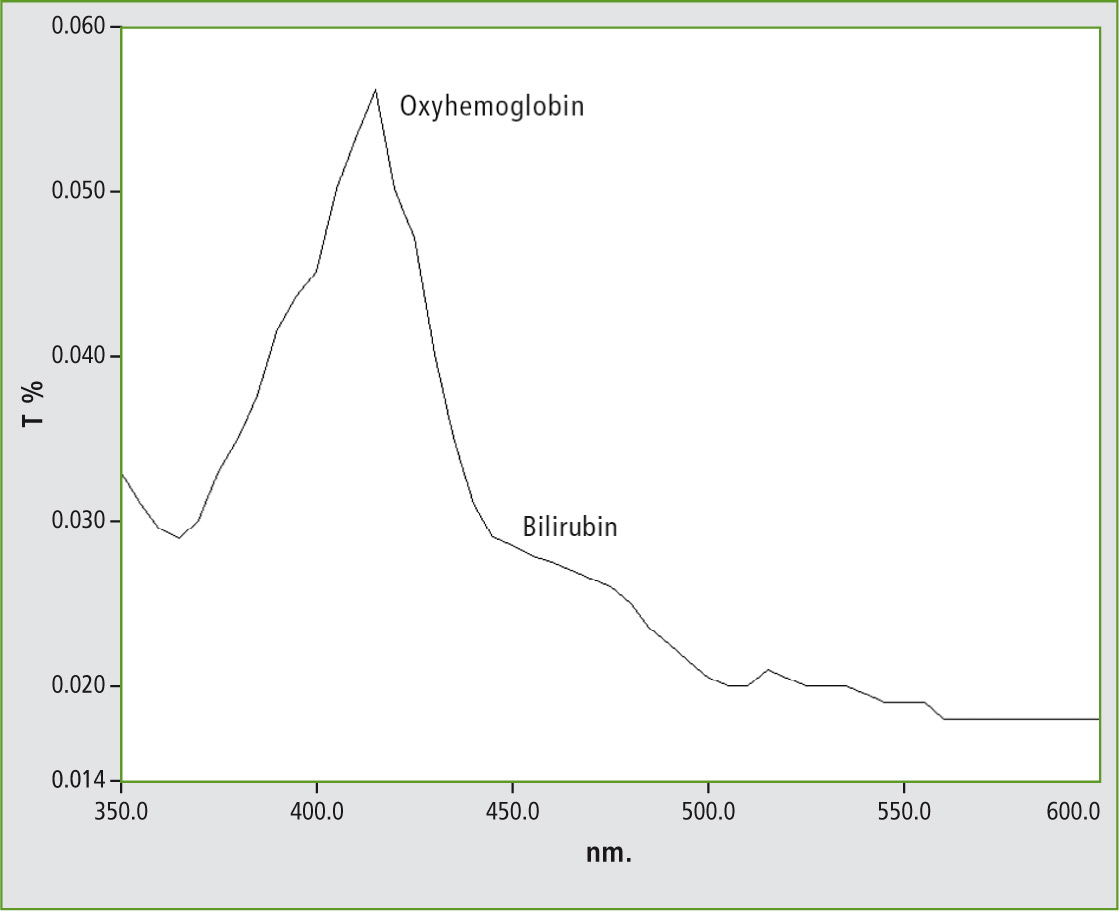 Figure 1: Representation of a UV-VIS absorption spectrum of a bilirubin sample exhibiting an oxyhemoglobin signal at 415 nm and a bilirubin shoulder at 450 to 460 nm recorded using the UVProbe software
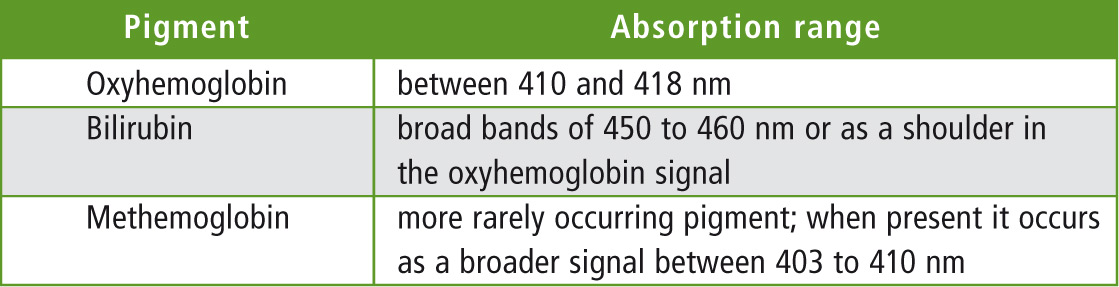 Table 1: Analytical wavelengths for hemoglobin
Beetham specifies the evaluation of the spectra. One specification is that the baseline under the signal should never intersect the signal itself. This strict instruction infers that automated evaluation cannot lead to the correct result. Manual evaluation is called for, in which the base points under the signal can be specifically adjusted/corrected.
To solve this problem, an Excel spreadsheet was developed in which it is possible to measure, to represent the spectrum, and to manually shift the baseline. Within the evaluation range, all required values of the sample could be represented.
A representation of the spectrum from the Excel sheet is shown in figure 2.
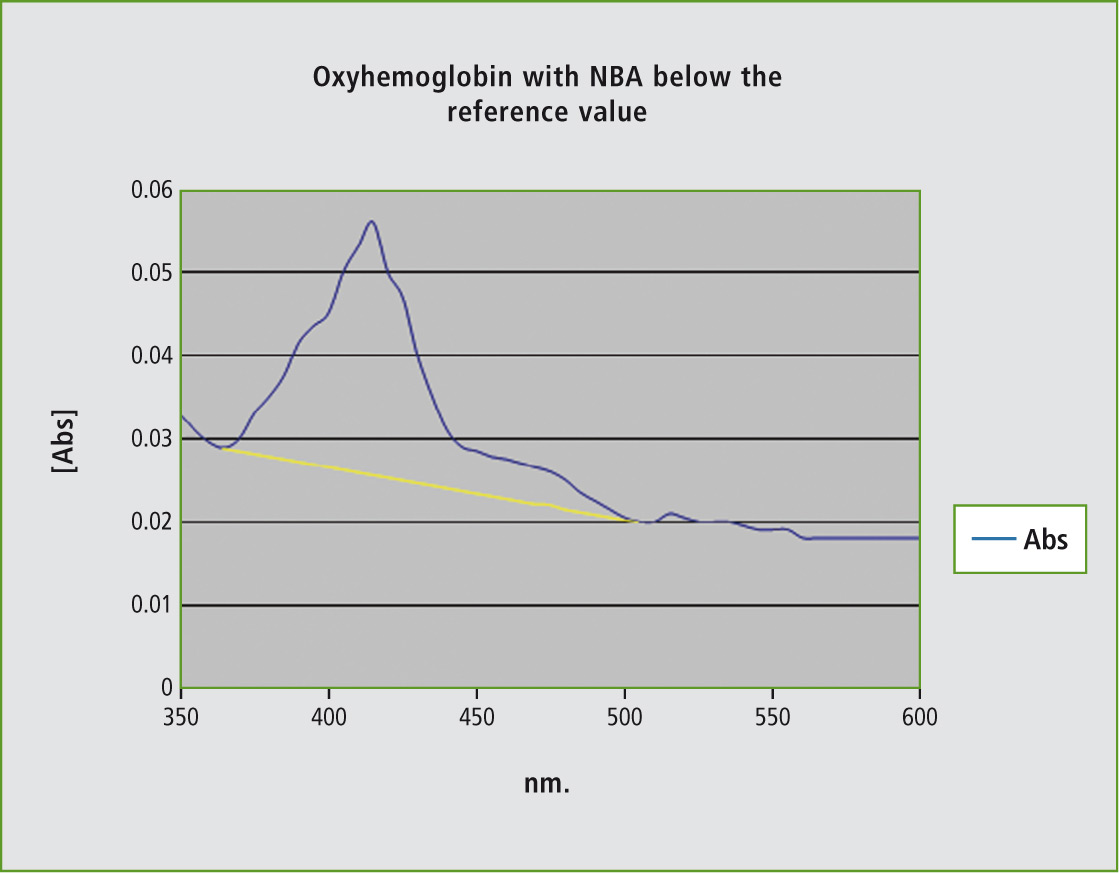 Figure 2: Representation of an absorption spectrum of a bilirubin sample and the representation of the baseline used for the correction of the bands
The evaluation is presented in table 2.
Table 2: Calculation of the net bilirubin content (NBA) after graphical evaluation
Shimadzu’s UV-1800 spectrophotometer was used for the analysis. The spectrum was measured in the range of 350 to 600 nm. The sample was measured using a 1 cm cuvette. The limit value in this example was below 0.007 absorption units.
Summary
Using the Excel method, the calculation of the net bilirubin concentration can be easily determined. Using a macro simplifies the adjustment to local conditions, such as different output formats and adaptation to individual forms. On the other hand, it is easy to extend the macro with other applications. The direct instrument control of the UV-1800 allows for direct data evaluation. It is also possible to import the results from the UV-Probe software, which is supplied as standard with the UV-1800.
Literature
[1] „National Guidelines for Analysis of Cerebrospinal fluid for Bilirubin in Suspected Subarachnoid Haemorrhage“, Draft 1; R. Beetham, M.N. Fahie-Wilson, I. Holbrook, I.D. Watson, P.R. Wenham, P.A.E. White, P. Thomas, A.M. Ward, A. Cruickshank, G. Keir, W. Egner, K. Allen