Determination of mineral oil hydrocarbons in vegetable oils

Manos Barmpounis, Dimitris Georgantas
Applications Department of N.Asteriadis S.A., 31 Dervenion Str. & Poseidonos Str.,
144 51 Metamorfossi – Athens, Greece,
e-mail: mb@asteriadis.gr
Vassiliki Panagiotopoulou, Vassilis Tzamtzis
GeneralChemicalState Laboratory, 16 An. Tsocha Str.,
11521 Athens
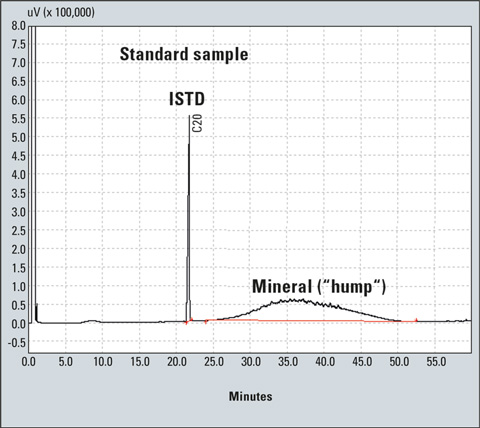 Figure 1: Chromatogram of a standard sample
Today food contamination through paraffins of mineral oil origin happens rather often. Although it is difficult to identify the exact sources of contamination, it is well known that many occur due to the wide range of applications of this petroleum derivative in many fields. Packaging additives, lubricants, cosmetics additives and pesticides can release paraffin waxes and oils. As a result, many cases of mineral oil contamination in food relating to edible oils, bakery products, packaged foods and recycled cartons are reported in literature.
The presence of mineral oils in food can produce undesired toxicological effects. Acceptable daily intakes have been established by the Joint FAO/WHO Expert Committee on Food Additives (JECFA) as 0-20 mg/kg body weight for high viscosity mineral oils, 0-10 mg/kg body weight for low and medium density class I mineral oils and 0-0.01 mg/kg body weight for low and medium density class II and class III mineral oils [1].
In spring 2008, nearly 100,000 t of sunflower oil were found to be contaminated in Ukraine with mineral oil at concentrations often above 1,000 mg/kg. Following this discovery, the European Commission with DG SANCO requested the national food authorities to withdraw the contaminated Ukrainian oil from the market. In June 2008, an administrative limit of 50 mg/kg was specified for mineral paraffins in crude as well as in refined Ukrainian sunflower oil.
The contaminated sunflower oil case highlights the importance of having a reliable, sensitive and simple method to determine mineral oil hydrocarbons in vegetable oils.
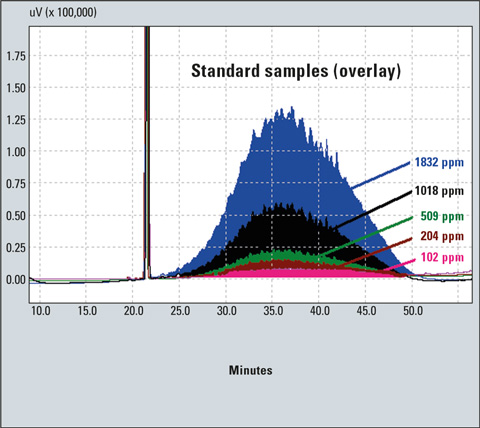 Figure 2: Chromatograms of standard samples (data comparison)
Principle
The saturated hydrocarbons of the sample are isolated by silica gel column chromatography and determined by capillary gas chromatography using an Internal Standard Method.
Apparatus
- Erlenmeyer flasks, 25 mL
- Test tubes with glass stop
- Glass column for liquid chromatography, internal diameter (15-20 mm), length 30-40 cm, fitted with suitable frit and stop-cock
- Micro-syringe for on-column injection, 10 µL, with a hardened needle
- Rotary evaporator
- Analytical balance for weighing to an accuracy of within 0.1 mg
- Usual laboratory glassware (variable volume automatic pipettes etc.)
Instrumentation
- Gas chromatograph Shimadzu GC-2010 Plus, OCI/PTV-2010 injector and FID-2010 Detector
- Capillary column (MEGA1, 10 m, 0.25 mm ID, 0.1 µm film thickness)
- Pre-column 0.53 ID 5 m deactivated (MEGA retention gap, 0.53 ID)
Temperature program
- PTV: 65 oC (5 min), 30 °C/min to 180 °C, 6 °C/min to 350 and hold 40 min
- Column Oven: 65 °C (5 min), 5 °C/min to 350 and hold 10 min
- FID temperature: 360 °C
- Total flow: 5.5 mL/min
- Carrier gas: Helium
Reagents
- Silica gel: Silica gel 60, Merck extra pure for column chromatography (code 107754). Activated at 300 °C for 24 h and cooled to room temperature in a desiccator
- n-hexane for chromatography (Unisolv by Merck is proposed).
- Internal standard, n-eicosane 20 µg/mL, by dilution from the standard 2000 µg/mL in isooctane (Neochema Cat. No 14700-0230).
- Paraffin oil, Merck, Product Number 1.07160 (for calibration curve).
- 0.2 g of paraffin oil is diluted in 100 mL of hexane, creating a 2,000 mg/L standard DProcedure – Sample pretreatment
Suspend 15 g of the above prepared silica gel in excess n-hexane, stir thoroughly with glass rod and introduce into the column. Allow to settle while gently tapping the silica by passing small quantities of n-hexane in order to make the chromatographic band more homogeneous. Weight 1 g of the sample into a 4 mL vial with screw cap, add 1 mL of the internal standard solution and mix thoroughly [2].
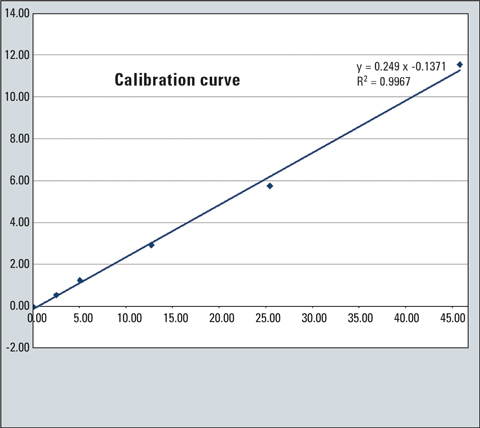 Figure 3: Calibration curve in mg/kg
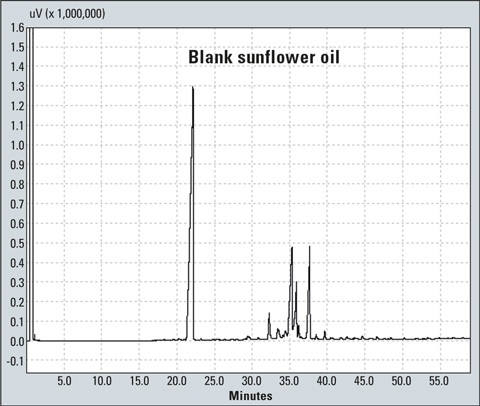 Figure 4: Chromatogram of a blank sunflower oil
The sample solution should be transferred to the chromatographic column with the aid of two 1-mL portions of n-hexane. After introduction of the sample into the silica, the mineral oil hydrocarbons are eluted using 50 mL of n-hexane. Eluent flow should be set to 10 drops/15 sec. The resultant fraction is collected in a 100 mL Erlenmeyer flask and evaporated in a rotary evaporator until the solvent volume is approximately 1 mL. The rest of the solvent is removed by nitrogen stream until dryness. The isolated mineral hydrocarbons are transferred to a 2 mL autosampler vial using 500 µL of heptane.
Finally, inject 1 to 4 µL of the solution in the gas chromatograph. As can be seen in Figure 1, mineral oil hydrocarbons produce a broad unresolved peak usually referred to as “hump” [3,4,5,6] instead of forming sharp peaks in GC. The hump and the ISTD peak are integrated to create the calibration curve (Figure 3). In the case of an unknown sample, the hump and peaks are integrated as a single peak (resolved and unresolved peaks) using the manual integration bar of the GCsolution program (Figure 5).
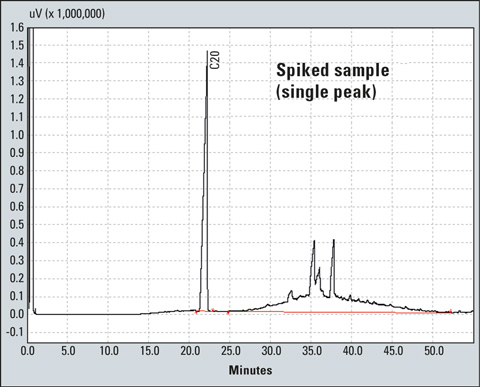 Figure 5: Chromatogram of a spiked sample integrated as single peak
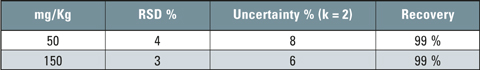 Table 1: Validation data of the method
All resolved peaks and the ISTD peak (above the hump) are then integrated using the proper drift in the GC solution program (Figure 6). Using a calculator, the area of the hump (unresolved peaks) is determined by subtracting the area of resolved peaks from the area of resolved and unresolved peaks.
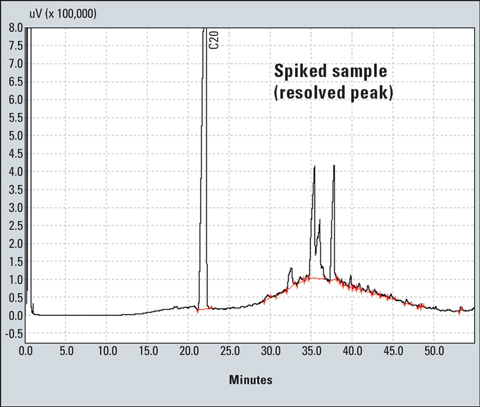 Figure 6: Integration of peaks of the spiked sample
The mineral concentration is calculated using the following equation:
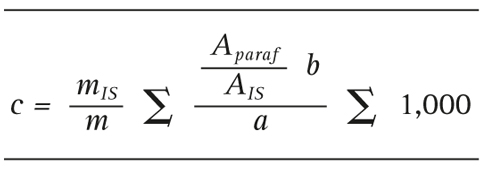
where:
c = mineral concentration (mg/kg)
m = weight of the sample (g)
mIS = weight of the internal standard (mg)
Aparaf = area of the mineral oil
AIS = area of the internal standard
A = slope of the calibration curve
b = y-intercept of the line
Validation data
Two spiked samples of concentration of 50 and 150 mg/kg respectively were used. Six repetitions of each sample were performed and the results are shown in table 1. The limit of detection (LOD) was found to be 10 mg/kg and the limit of quantitation (LOQ) was found to be 20 mg/kg.
Conclusions
Mineral oil hydrocarbons were successfully determined by the above method, using a Shimadzu GC-2010 Plus gas chromatograph. The method showed good repeatability and linearity.
References
- JECFA (Joint FAO/WHO Expert Committee on Food Additives) (1995) Summary of Evaluations Performed by the Joint FAO/ WHO Expert Committee on Food Additives
- Official Method for stigmatadienes and waxes, Regulation EEC 2568/91
- L. Karasek, T. Wenzl, F. Ulberth, EUR 23811 EN – Joint Research Centre – Institute for Reference Materials and Measurements, Proficiency test on the determination of mineral oil in sunflower oil
- M. Biedermann, K. Grob, Eur. J. Lipid Sci. Technol. 111 (2009) 313-319, How “white” was the mineral oil in the contaminated Ukrainiansunflower oils?
- D. Fiorini, A. Paciaroni, F. Gigli, R. Ballini, Food Control 21 (2010) 1155-1160, A versatile splitless injection GC-FID method for the determination of mineral oil paraffins in vegetable oils and dried fruit
- K. Grob,M.Vass, M. Biedermann, H-P Neukom, Food Additives and Contaminants 18 (2001) 1-10, Contamination of animal feed and food from animal origin with mineral oil hydrocarbons