Mineral water in a different light
Quality control using UV spectroscopy
With 130 liters consumption per capita and per year in Germany, they are an important food source in our daily nutritional intake, supplying important minerals and trace elements, both sparkling and still – mineral waters. Their labels are their trademarks and business cards as they contain specific information on the contents. These labels testify to the quality of the mineral water spring where the water comes from. Interestingly, the labels do not mention the actual test date of the water, as the information cannot be printed fast enough on the labels. When checking the imprints on the bottles, one finds a date that differs by several months from the mineral analysis of the well itself.
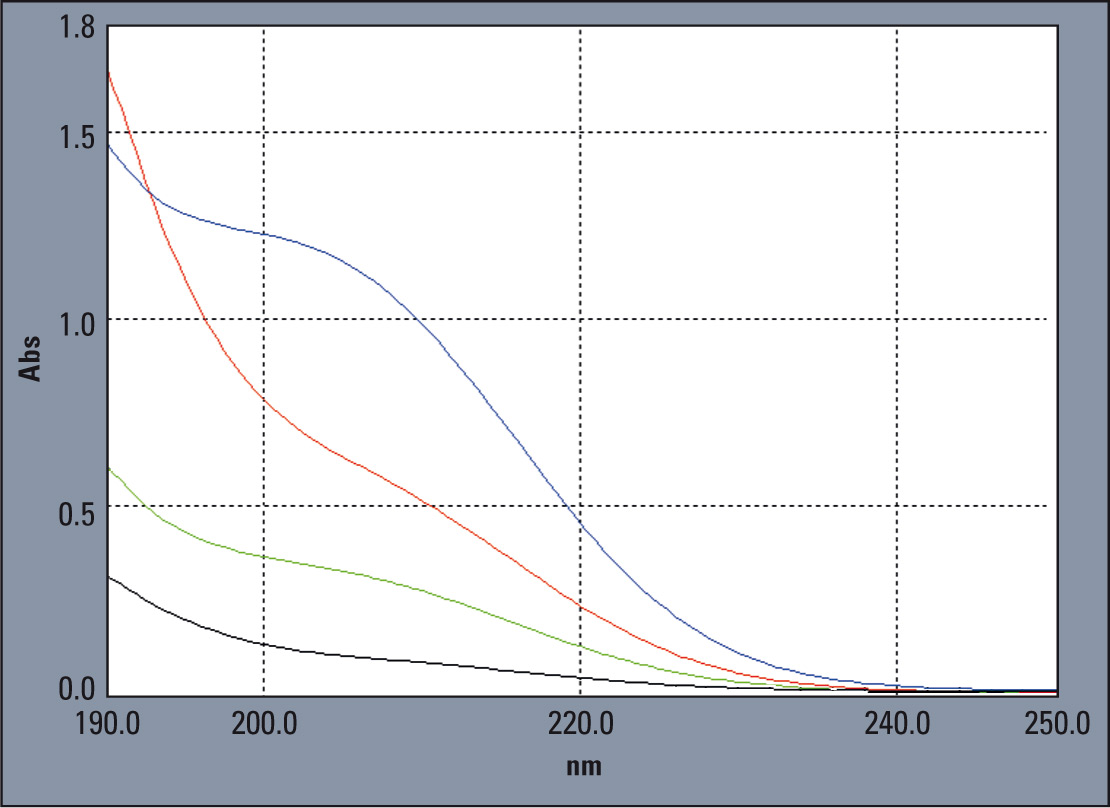 Figure 1: Ultraviolet spectra of four different still mineral waters
Drinking water is one of the most tested food sources. It is subject to continuous monitoring according to national and European drinking water ordinances. Monitoring includes, among others, the analysis of minerals and trace elements. These analyses are usually carried out using atomic absorption spectroscopy or ICP-OES methods. The total organic carbon content is determined using TOC methods; nitrate and nitrite content can be determined using UV spectroscopy. Many foods are also characterized using NIR spectroscopy, a measuring technique that is not quite as suitable for the identification of mineral water.
UV spectroscopy also for the identification of spring waters
The following application shows that UV spectroscopy is suitable not only for the determination of elements and their salts, but also for straightforward identification of spring waters. Waters from various sources exhibit differences and these differences can be revealed using absorption spectroscopy and UV spectra, as well as NIR measurements. As mineral waters are all transparent in the visible range, special attention was focused on the ultraviolet and near-infrared ranges.
Analysis in the ultra-violet range
Spectra of four store-bought still mineral waters were measured in the ultraviolet range of 190 – 250 nm using Shimadzu’s UV-3600 spectrophotometer. The result is shown in figure 1. A 10 mm thick quartz cuvette was used for the measurements, and deionized water was used and measured as reference sample. When comparing the spectra, one can see a clear difference between the curves, which can be attributed to the individual characteristics of the mineral waters.
Water in the near infrared range
In the infrared range of 100 – 1800 nm using a layer thickness of 2 mm, the same waters did not exhibit any individual characteristics for the water absorption signal at 1440 nm (Figure 2). This is due to the strong absorption by water in the NIR range, as can be seen in figure 2. This value lies within the linear measuring range of the instrument. The differences among the water samples cannot be determined using NIR, as the NIR range is represented by -CH, -OH and -NH vibrations. Minerals are inorganic in nature.
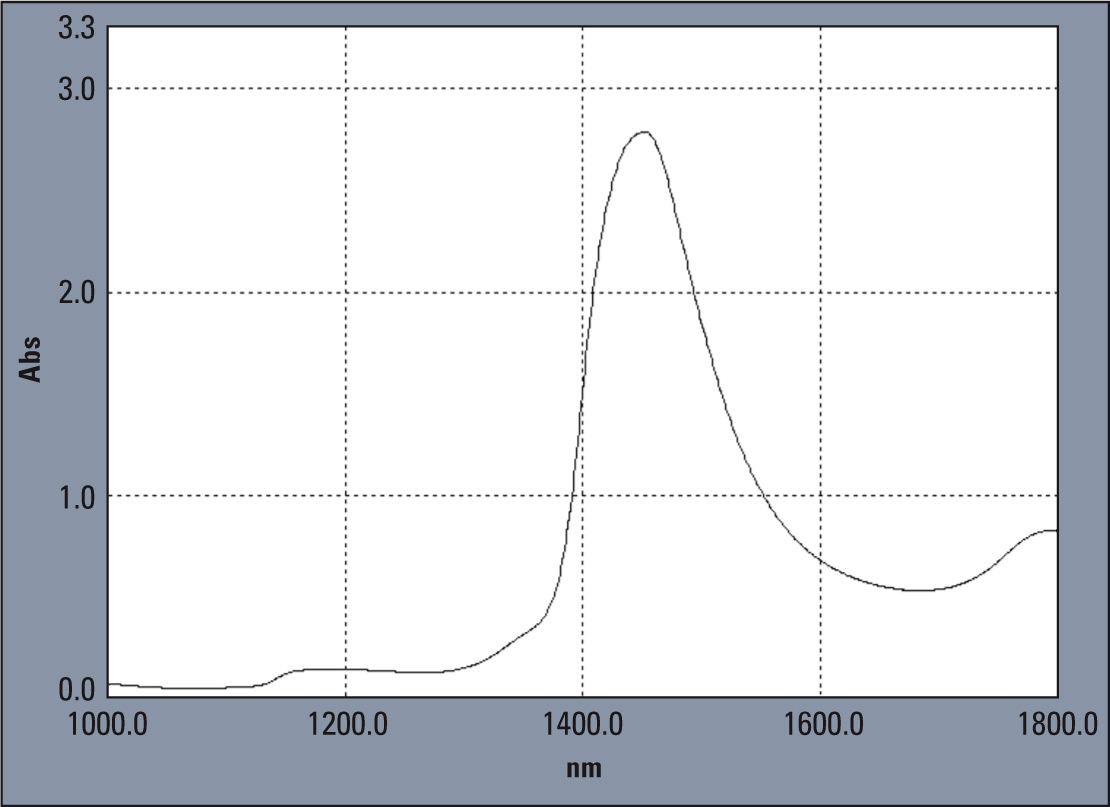 Figure 2: Near-infrared spectra of 4 still mineral waters, measured using a 2 mm thick cuvette
Multiple linear regression
To verify the assumption that the ultraviolet range reveals differences, multiple linear regression was carried out at four analytical wavelengths in the UV range. The wavelengths 200, 205, 210 and 215 were selected and a calibration was carried out. Calibration standards were prepared by mixing 3 mineral waters (Tab. 1). Figure 3 shows five UV spectra of these standards.
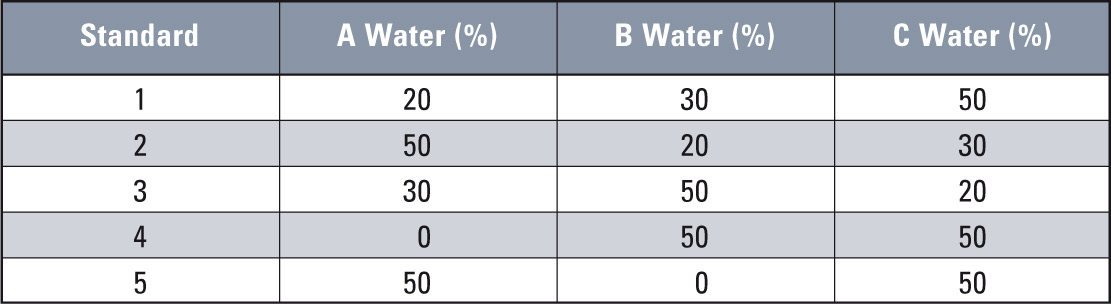 Table 1: Mixing ratios for measurements using the UV-3600 of three different still mineral waters (see Figure 3).
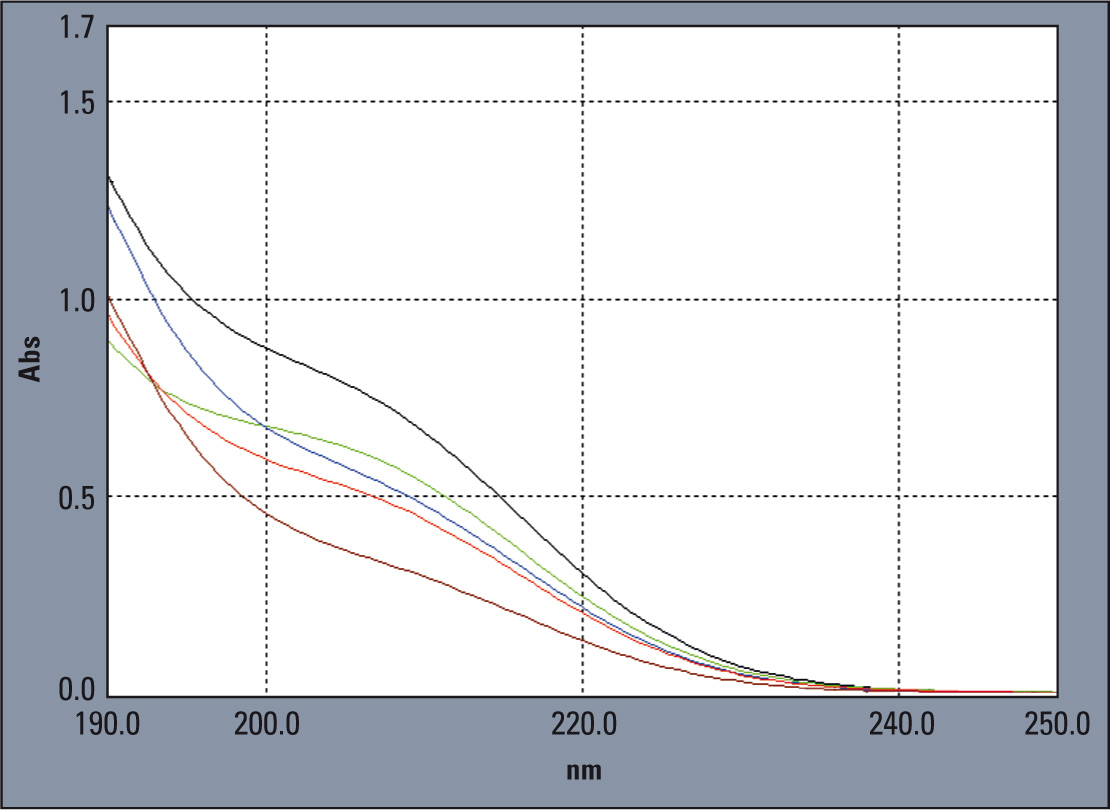 Figure 3: Five UV absorption spectra of mixtures of three mineral waters. The different mixing ratios are listed in Table 1; red = standard 1, blue = standard 2, black = standard 3, green = standard 4, brown = standard 5
The result from this straightforward multiple-component analysis model (Table 2) shows that the mineral waters are distinguishable. It should be noted that multiple-component analysis can also be applied in the UV spectroscopy range of 190 to 250 nm. This evidently requires an instrument technology which still delivers reliable results in this range. Shimadzu’s UV-VIS-NIR UV-3600 spectrophotometer is particularly suitable for these types of analysis.
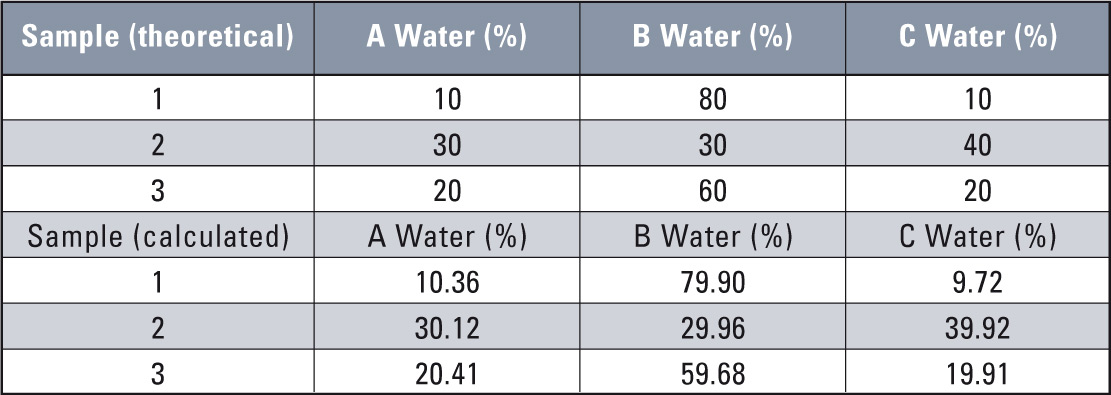 Table 2: The result of a model calculation with respect to four analytical wavelengths and three samples