Bringing light into darkness
2-D LC and LCMS-IT-TOF – Better drug impurity ID efficiency
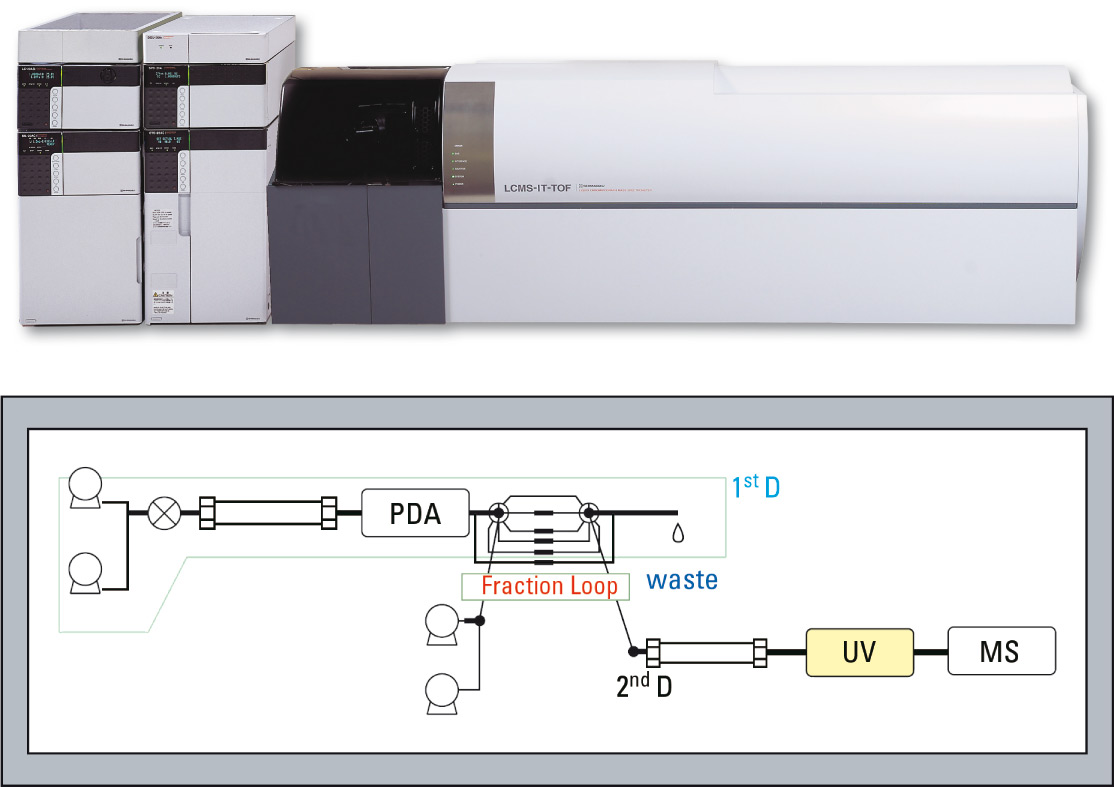 Figure 1: Basic flow diagram of Trap free 2D LCMS impurity system
The analytical method development section in CMC (Chemistry, Manufacturing and Control) sections of pharmaceutical companies constitute part of the pharmaceutical developmental process that deals specifically with the physical nature of a drug substance and the drug product, for example how it is made, and the control of the manufacturing process to provide a reliable and reproducible product. HPLC systems in these areas are utilized for the specification tests of active pharmaceutical ingredients (API) to ensure the quality of the product as well as the level of impurities.
Traditionally, non-volatile mobile phases containing phosphate buffer solutions have been used in the HPLC test methods for QA/QC. When LC/MS analysis is performed, it is necessary to switch from a mobile phase containing non-volatile additives to a completely volatile mobile phase suitable for atmospheric pressure ionization techniques.
This alteration in analytical conditions may cause changes in the elution order of analytes as well as introduce the possibility of obscuring impurities due to their close proximity to the chromatographic peaks of the major constituents. The change in method conditions requires attention to detail and a great deal of effort by the user. Furthermore, recent modifications in regulation of impurities along with globalization of the supply chain have led to even greater demand for impurity identification. Of course, this causes a bottleneck due to the necessity to modify HPLC conditions conforming to the existing validated test methods, and the need to satisfy demands from the manufacturing section for identification of impurities. Against this backdrop, it is no wonder that a new analytical system is eagerly anticipated.

 Figure 2: Used HPLC modules and system flow diagram
To address the demand for LC/MS analysis allowing utilization of existing non-volatile mobile phase analytical conditions, Shimadzu has developed a new kind of setup, working independently of a trapping column approach. The advantage of simplifying the flow path is that the time and effort required for optimizing the conditions can be shortened. This overall analysis of the system led to the construction of the Co-Sense LC/MS system with a modified flow path.
Desalting is executed using a divert valve installed just before the MS inlet. The addition of the UV detector to the second dimension greatly facilitates the detection of impurities. In an actual sample workflow, both impurity data and the corresponding blank data are acquired, and the impurity peaks are identified through comparison of the respective chromatograms. Peak isolation and fractionation is conducted applying multiple valves in specific combinations. Creating the peak isolation program is easy using a provided macro program. The macro automatically specifies the best valve sequence, demanding only that the user adds the retention times of the first dimension separation. To make operation even easier, a separate macro-program which automates the construction of a batch schedule for acquiring multiple impurity and blank data, is also provided. The individually collected impurities are then analyzed with the LCMS-IT-TOF. In a very fast and efficient way fragment spectra can be generated and used with its accurate mass to determine the elemental composition of impurities. Additional software packages, like MS fragmenter from ACD labs, can use this accurate mass fragment pattern information and search for homologies between the impurity and the main compound.
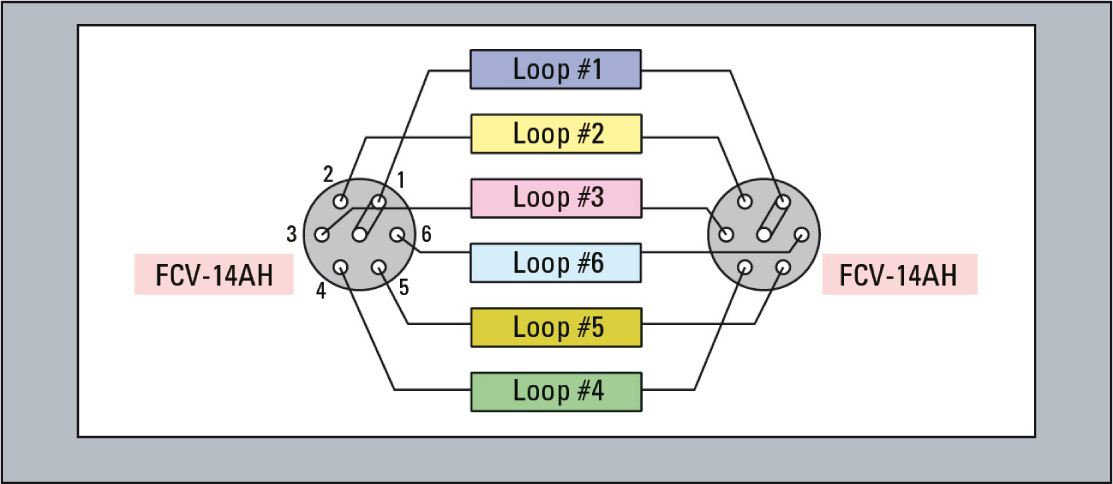 Figure 3: Fractionating loops available in 5 µL, 10 µL, 20 µL and 50 µL
Analysis example
A sample consisting of sulfadimethoxine (Figure 4) as the principle compound, and four sulfa drugs having a similar structure to serve as impurities is used for this example (Figure 5). The impurities were each mixed with the principle compound at percentages of 0.1 % relative to the principle compound which had a concentration of 500 µg/L. The impurities were selected and fractionated into the loops based on their elution times (Figure 6). The structures of the respective substances are shown below, and the measurement results are shown in figure 7. All of the “impurities” were confirmed in the results.
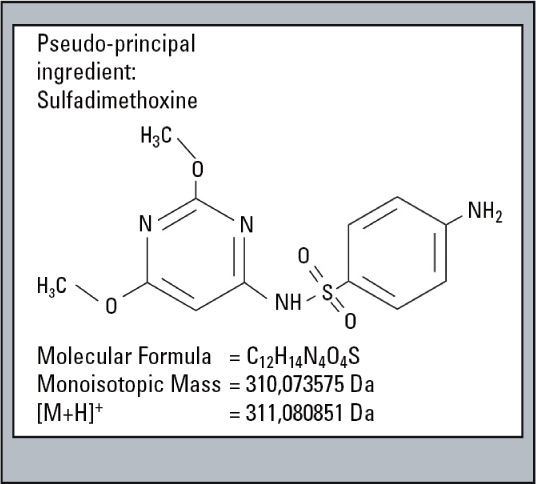 Figure 4: Structure of Sulfadimethoxine
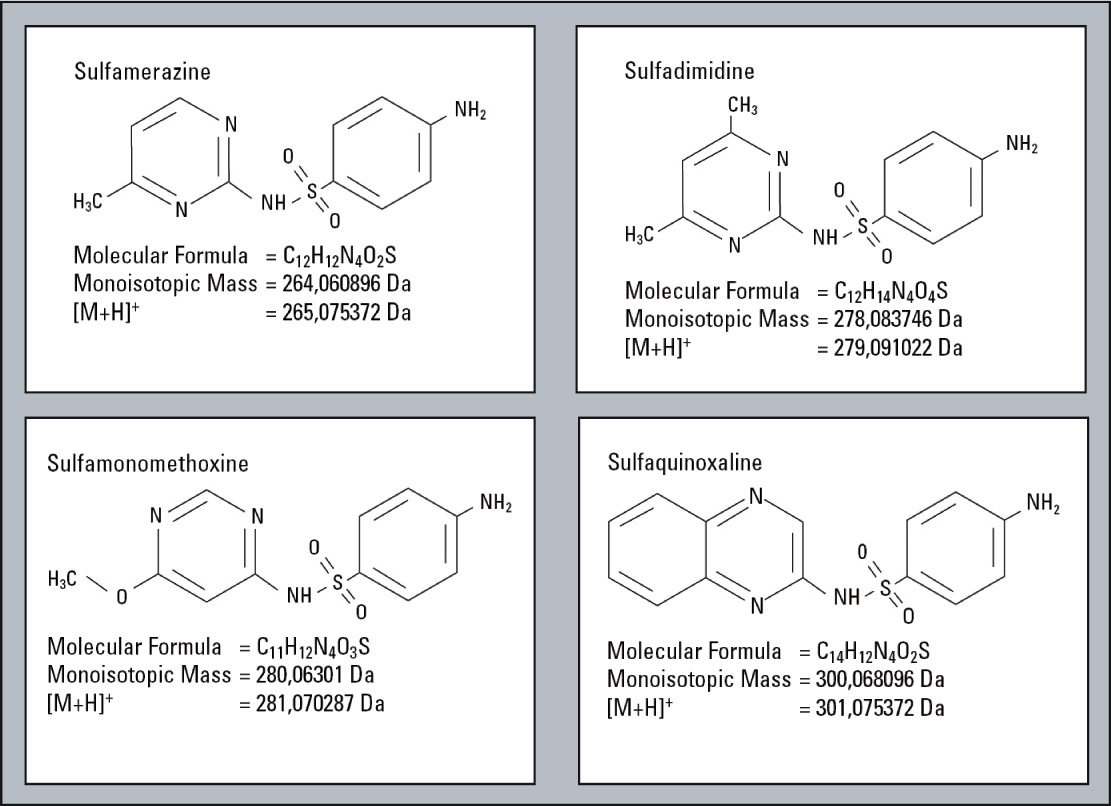 Figure 5: Compounds of similar structure like Sulfadimethoxine serving as impurities for this example
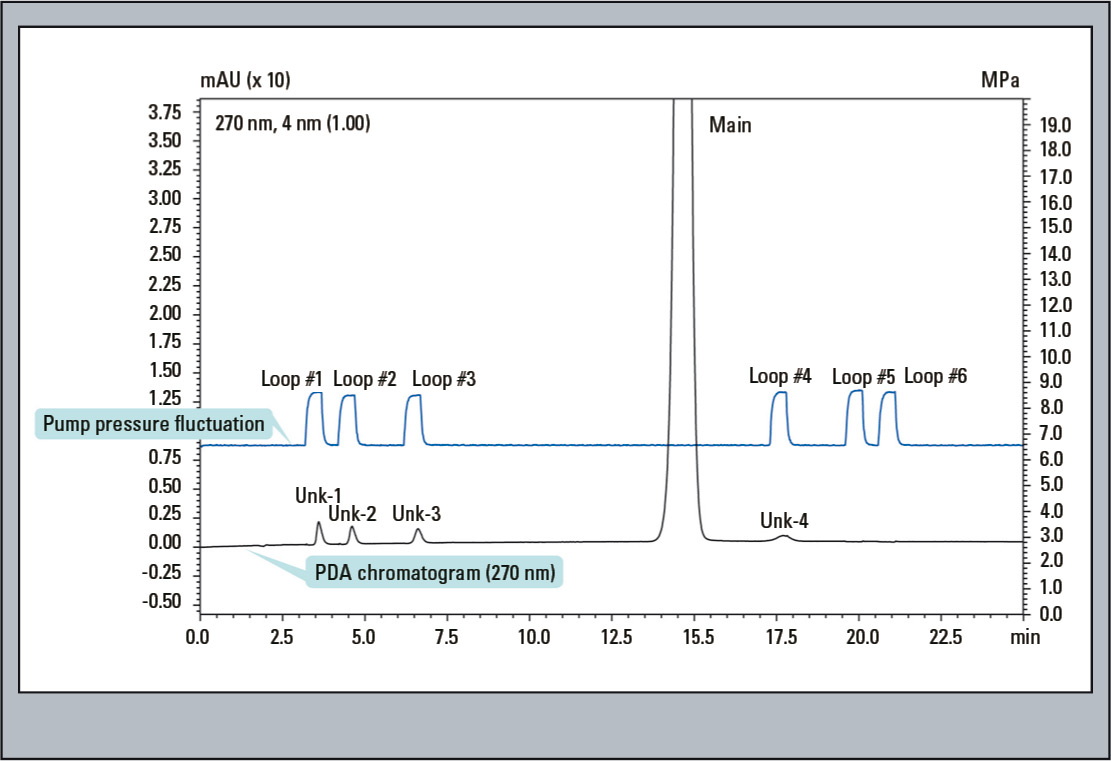 Figure 6: First Dimension PDA Chromatogram: The blue coloured trace displays the system pressure and the black coloured trace the UV 270 nm signal. These correlate perfectly, indicating the elution peaks are reliable fractioned in the loop.
Analytical conditions LC first dimension
Column: Shim-pack VP-ODS, 150 mm L. x 4.6 mm I.D., 5 µm
Mobile phase: 0.01 mol/L phosphate buffer, solution (pH 2.6), methanol mixture (7:3)
Mobile phase flow rate: 1 mL/min
Column temperature: 40 °C
Sample injection volume: 10 µL
PDA detection wavelength: 200 – 350 nm (270 nm monitored)
Analytical conditions LC second dimension
Column: Shim-pack XR-ODS 75 mm L. x 2.0 mm I.D., 2.2 µm
Mobile phase A: Shim-pack XR-ODS 75 mm L. x 2.0mm I.D., 2.2 µm
Mobile phase B: Methanol
Mobile phase ratio: 10 % B (0 min) -50 % B (10 min) -10 % B (10.01 – 20 min)
Mobile phase flow rate: 0.3 mL/min
Column temperature: 40 °C
Sample injection volume: 0.3 mL/min
UV detection wavelength: 270 nm
MS conditions
Ionization mode: ESI+
Nebulizer gas flow rate: 1.5 L/min
Drying gas pressure: 0.15 MPa
Impressed voltage: 4.5 kV
CDL temperature: 200 °C
BH temperature: 200 °C
Scan range: m/z 100 – 1000
Utilizing the data browser
The data browser provided in LCMSsolution software offers additional functionality enhancing the efficiency of impurity analysis-related tasks. The layout template for picturing data can be customized and saved beforehand. As shown in figure 8, the stored layout was constructed so that the upper tier is reserved for displaying the UV chromatogram and MS spectrum of impurity-related data (2-D LC), and the lower tier for showing the UV chromatogram and MS spectrum of the blank data corresponding to the impurity peak (2-D LC). In this case, the Unk-1 (sulfamerazine) data and the respective blank data are presented using the “drag and drop” function from the data explorer for display in the data browser.
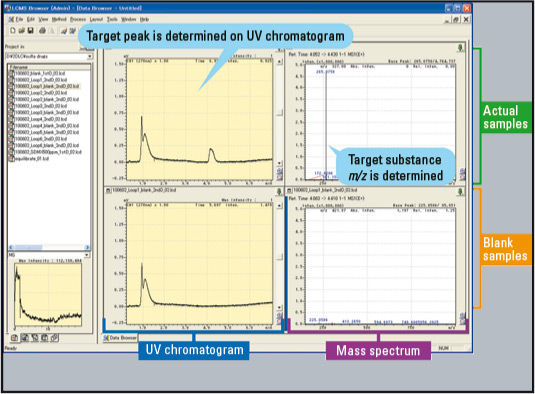 Figure 8: Unk-1 and Blank Data Displayed in Data Browser
The differences in retention times between those obtained with the UV detector and those obtained with MS were synchronized using the retention time correction function provided in the browser. The retention times are stored in the method file, and since this retention time averaging function can be set up beforehand to be executed automatically, it does not need to be executed manually each time a new set of data is displayed.
Furthermore, utilization of this function permits automatic detection of the impurity peak from the UV chromatogram and the corresponding display of the MS spectrum. In addition, since all of the data files are processed automatically, identification of the impurity on the UV chromatogram allows not only synchronous display of the corresponding impurity spectrum, but also synchronous presentation of the blank MS spectrum as well. The actual operation is conducted using just the mouse to drag from the start of the impurity peak in the impurity UV chromatogram to the end of the peak. Upon releasing the mouse button, the averaged corresponding impurity spectrum and blank spectrum will be shown.
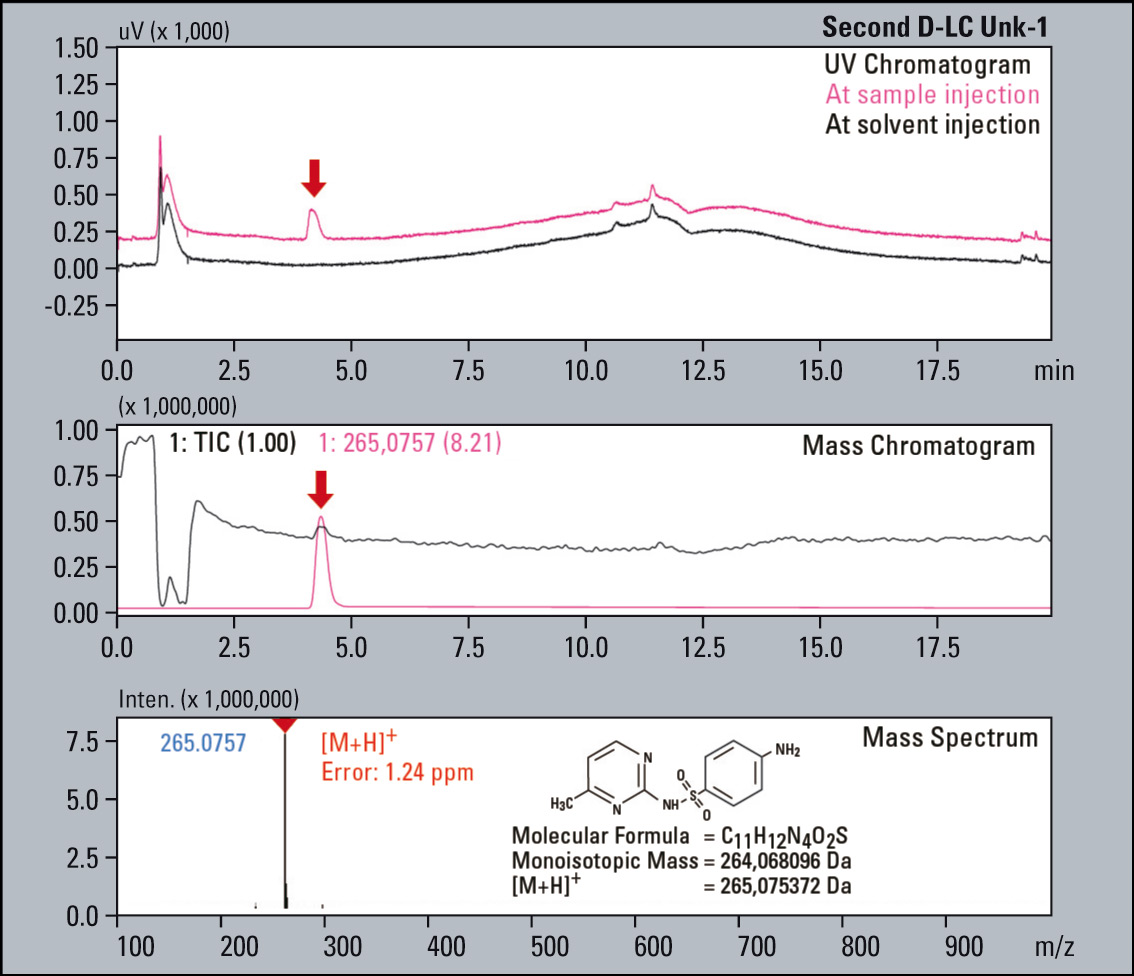
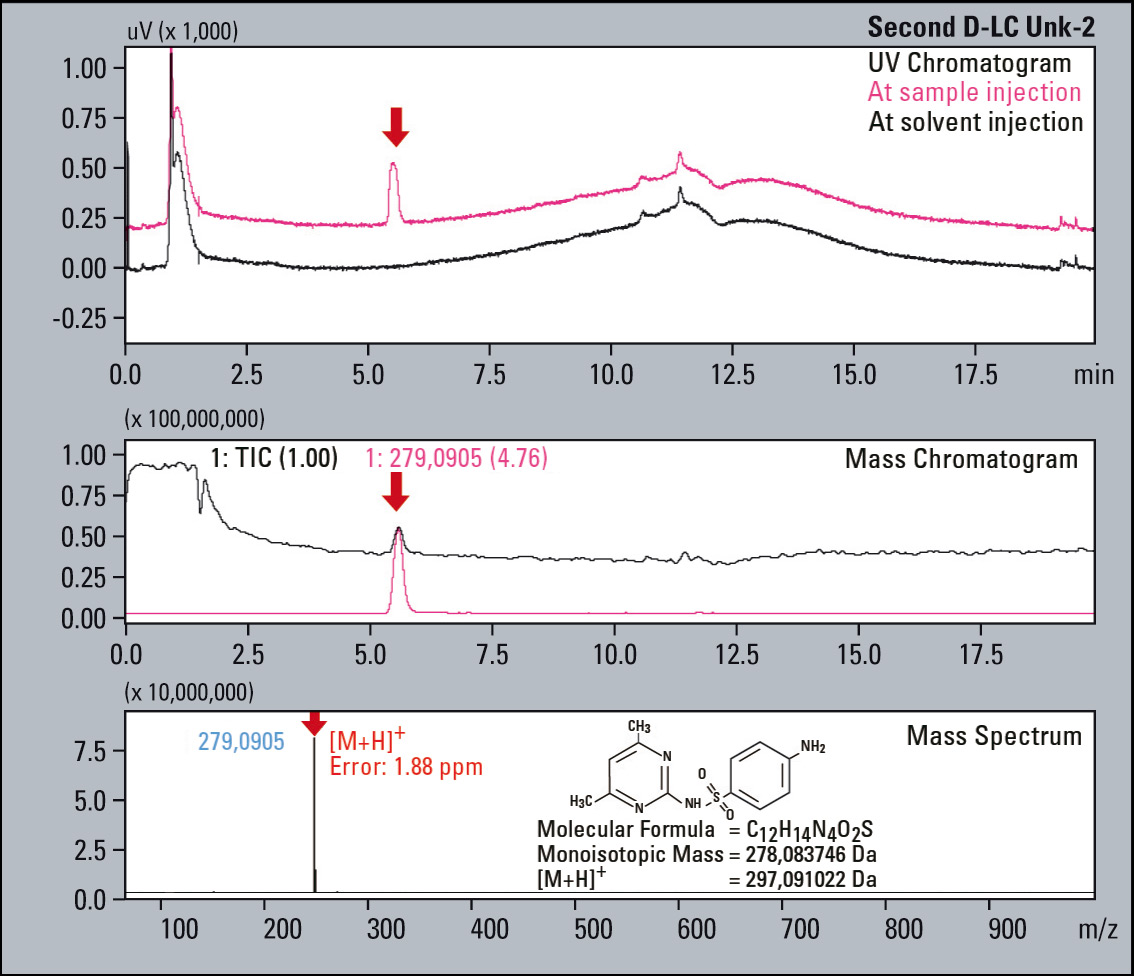
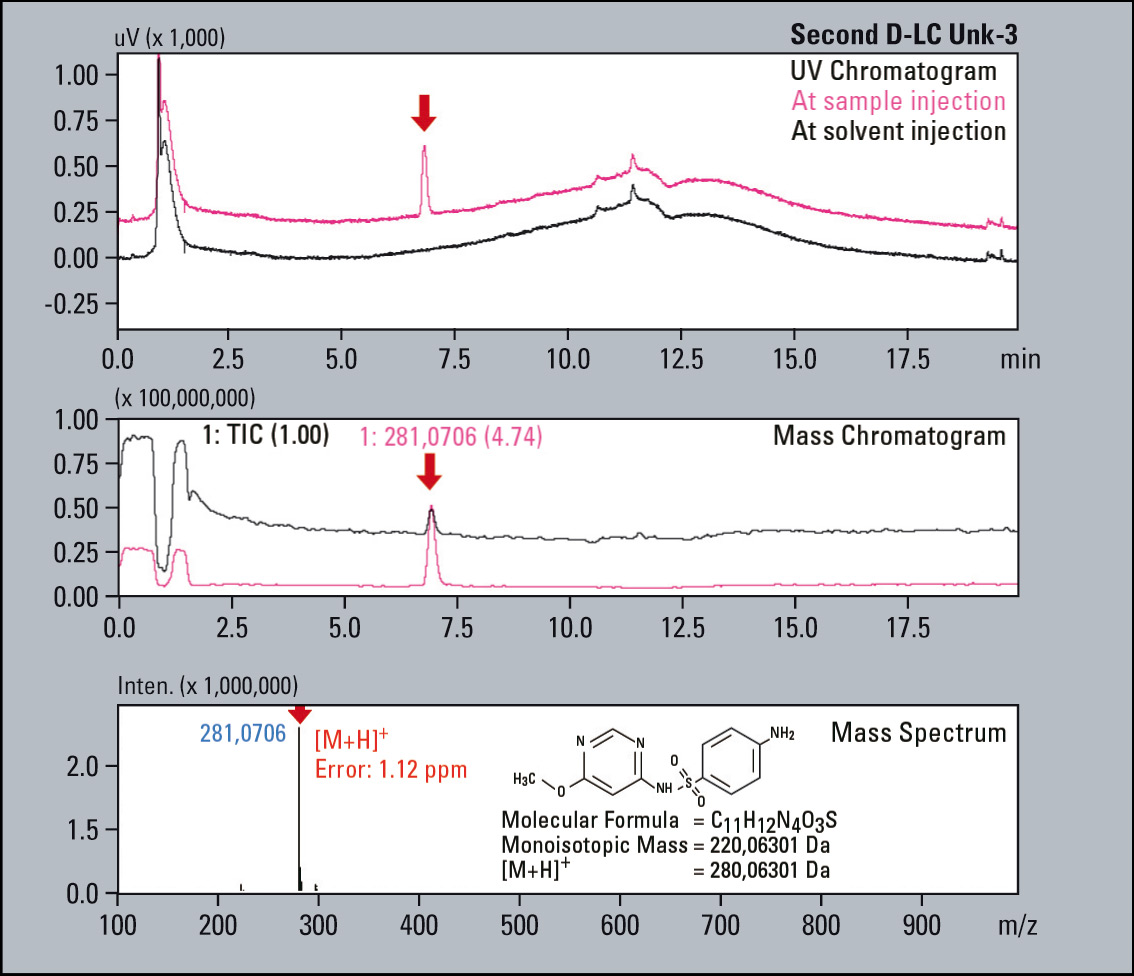
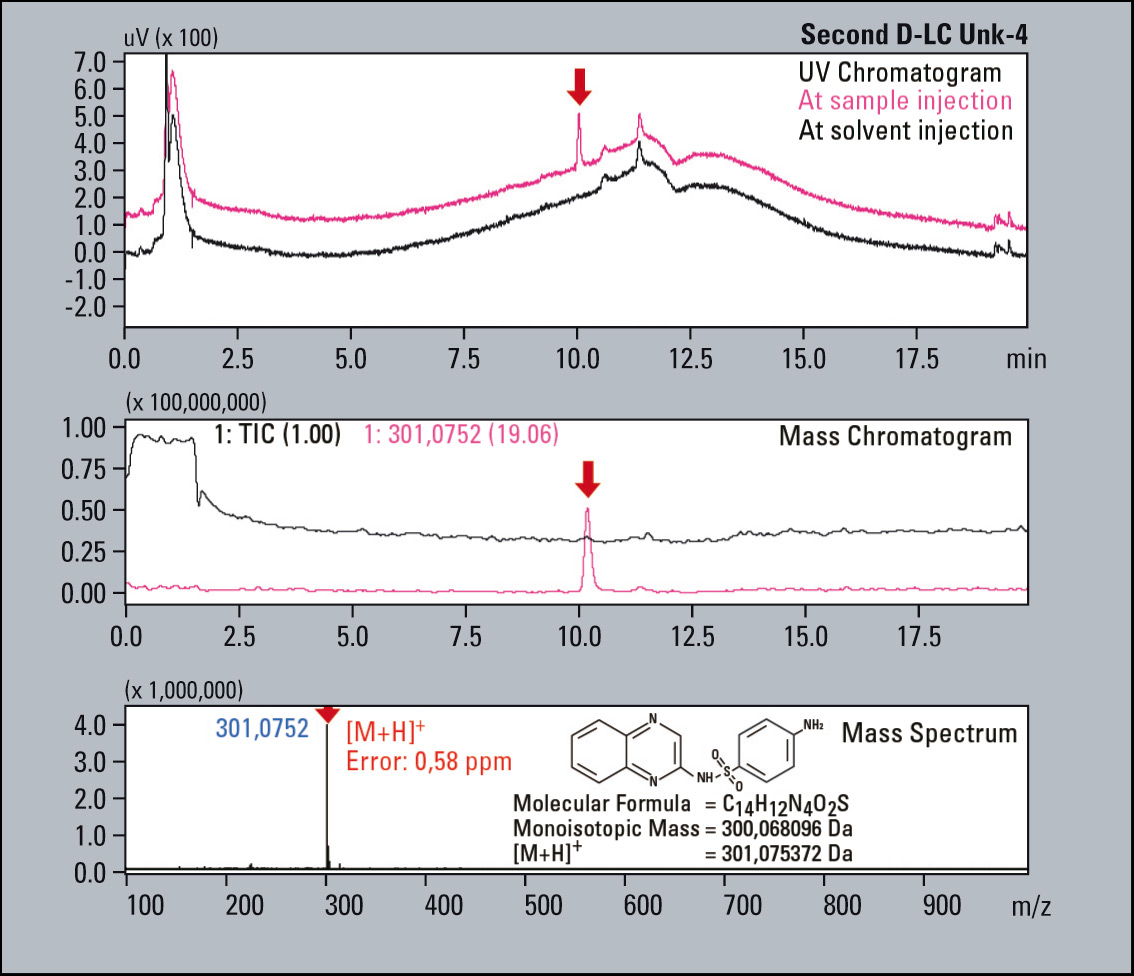 Figure 7: UV Chromatograms, MS Chromatograms and MS spectra of four fractionated impurities
When using the two dimensional LC system introduced here, repeatability of retention time in the first dimension is extremely important because impurity peak fractionation is conducted within specific time-controlled intervals. In other words, this technique cannot be applied unless retention times are consistent.
However, it is reasonable to assume that the repeatability of retention times has already been determined since retention time repeatability is fundamental to the development of a specific test method. If the separation technique for the first dimension separation is already established, measurement can be conducted without re-evaluation of the technique introduced here, eliminating the need for LC/MS measurement using complex volatility conditions that would have been required otherwise. The ability to confirm impurities through comparison with blank data should contribute greatly to the efficiency of CMC impurity identification.