Safety first: rapid evaluation of insulating oil in electrical equipment
Safety first: rapid evaluation of insulating oil in electrical equipment
Shimadzu develops optimized UHPLC method for degradation products in insulating liquid

BTA, TTAA and furanic compounds in insulating oil are indicators of degradation of electrical equipment such as transformers. They are periodically monitored according to standard procedures described in BS148:2009 and ASTM D5837-15. This article describes a proof-of-concept study of the optimization of the two separate standard methods. The resulting new method allows for a time-saving simultaneous analysis using a single assay. Additional time can be saved by the simple transfer of the 30 min HPLC gradient method to a 5 min run using UHPLC conditions.
Protecting the energy grid
In electrical transformers and condensers, insulating oil and paper are used to insulate conductors and cool the interior of electrical devices. Long-term operation or exposure to heat can result in degradation of these insulators, which can ultimately lead to device failure. Therefore, periodic inspection to monitor any signs of degradation should be standard practice. Insulating paper is fixed to the device and difficult to remove, but insulating oil is easily collected and can be analyzed to verify device status.
Testing for degradation in transformers and condensers
Two substances are common additives in insulating oil, where they act as passivators (metal deactivators): BTA – 1,2,3-benzotriazole – and TTAA – tolutriazole derivative N-bis[2-ethylhexyl]-aminomethyltolutriazol. As both substances can also lead to sulfidation corrosion, quantification of BTA and TTAA is required as specified in the British Standards BS148:2009 [1], which describe an HPLC method for this purpose. Insulating paper used as a coating for windings in transformers and condensers is made of cellulose, which decomposes at high temperatures and under contact with water or oxygen. It then dissolves into furanic compounds. Hence, the concentration of furanic compounds in the insulating oil is an indicator of degradation of electrical equipment. ASTM D5837-15 [2] specifies an HPLC method for this analysis.
Optimizing the standard testing methods
This article introduces a proof-of-concept optimization of the methods described by ASTM and BS to offer simultaneous analysis of both passivators and furanic compounds in one assay [3]. As both methods were originally designed for a conventional HPLC system, the usual runtime is 30 min. By simple transfer to a UHPLC system, analysis time can be drastically reduced to approximately 5 min [4].
Analysis of the standard solutions
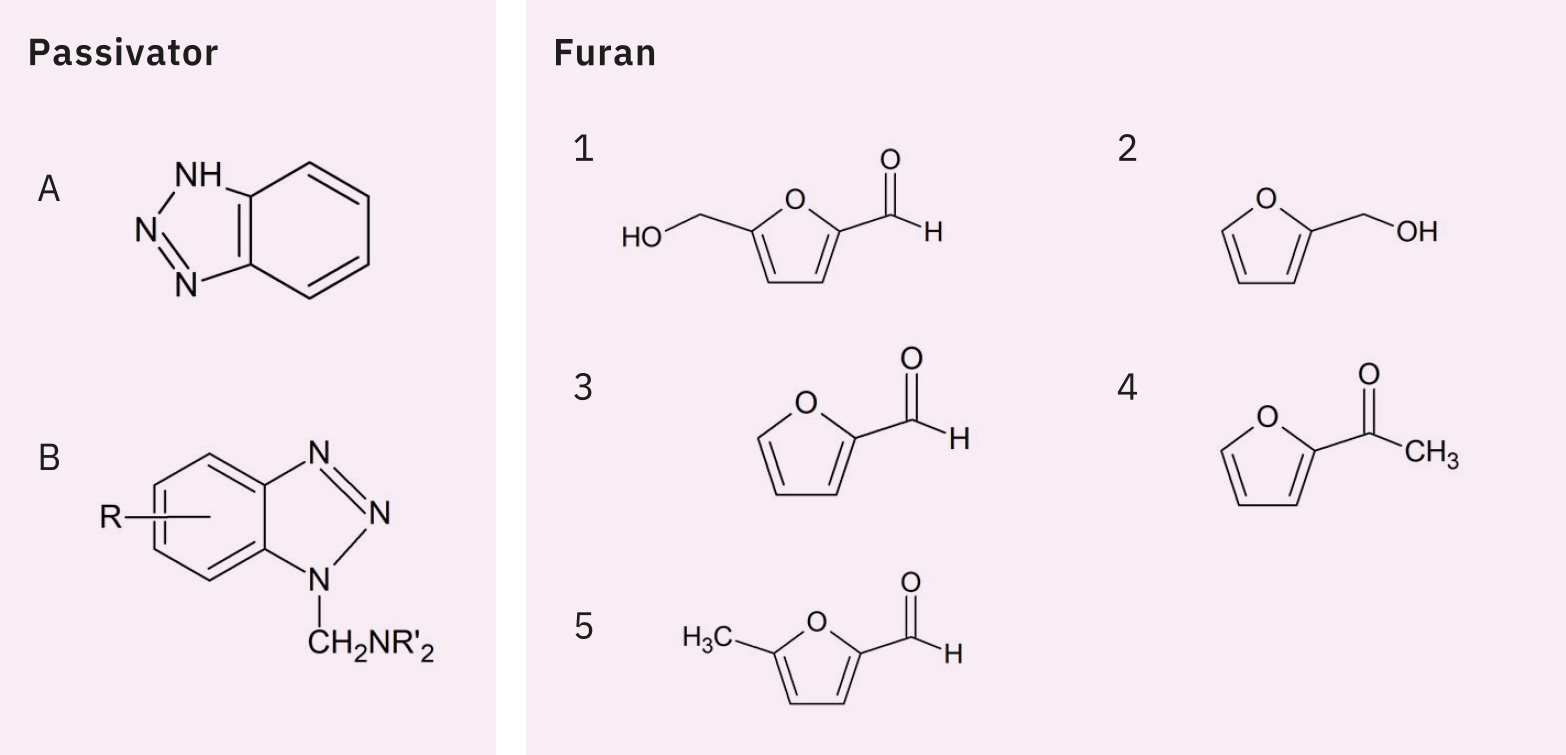
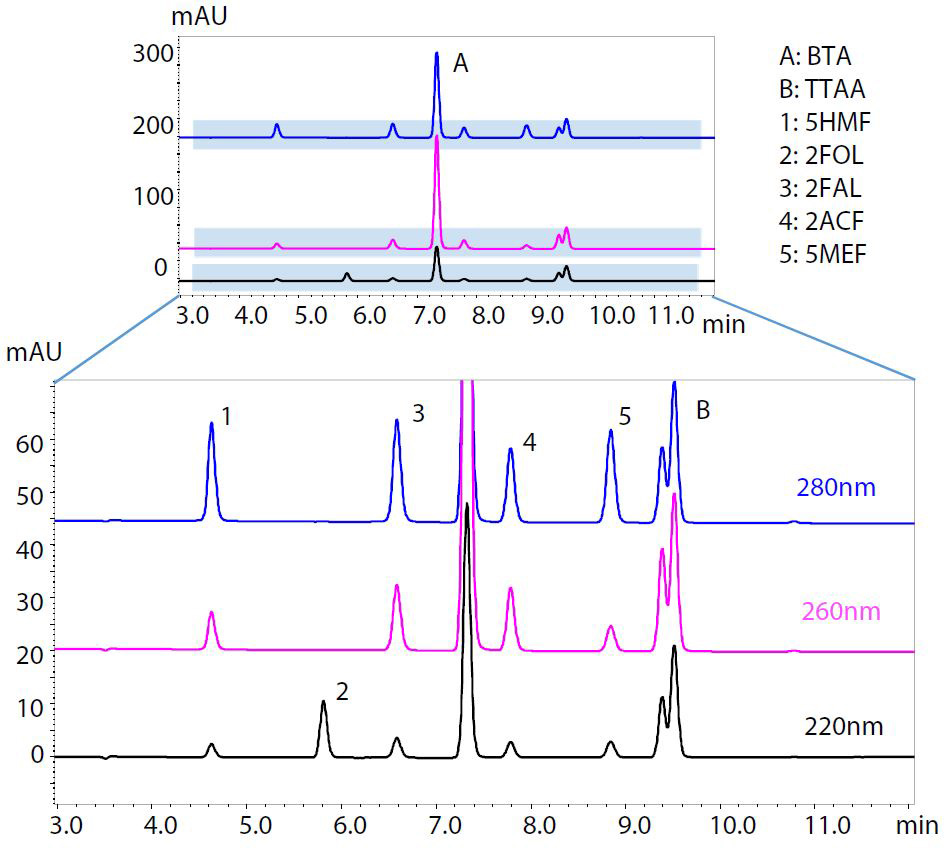
Figure 1 shows the chemical structures of BTA, TTAA and five furanic compounds. Standard solutions were prepared according to ASTM D5837-15. Furanic compounds, BTA and TTAA were weighed individually, dissolved in acetonitrile and then diluted with water. As there is no analytical standard TTAA commercially available, Irgamet® 39 (manufactured by BASF) was used instead, as noted in BS148:2009. Table 1 and Figure 2 respectively show the analytical conditions and the HPLC chromatogram of the standard solutions. As Irgamet® 39 is a mixture of two TTAA isomers, it elutes as two partly overlapping peaks. In this analysis, in accordance with BS148:2009, the combined value of peak areas of these two isomers was used for quantification.
|
System |
Shimadzu i-Series (LC-2050) |
|
Column |
Shim-pack VP-ODS (250 mm × 4.6 mm I.D., 5 µm) |
|
Flow rate |
1.0 ml/min |
|
Mobile phase |
A) water B) acetonitrile |
|
Time program |
15% B (0 min) → 45% B (10 min) |
|
Column temp. |
40 ˚C |
|
Injection volume |
15 µL |
|
Detection (PDA) |
λ = 220, 260 and 280 nm |
Table 1: Analytical conditions of the HPLC analysis of BTA, TTAA and furanic compounds
5-point calibration curves for all compounds of interest were prepared using the standard solutions for BTA and TTAA in the concentration range of 0.1–20 mg/L and for the five furanic compounds in the concentration range of 0.005–1 mg/L. Good linearity with a regression coefficient r2 > 0.9999 was obtained for the determination of all components.
A recovery test was carried out by spiking a standard mixture of all compounds dissolved in toluene into white oil, followed by extraction using the pretreatment method described in ASTM D5837-15, as shown in Figure 3. The dilute supernatant was analyzed by HPLC. Acceptable recovery (≥ 79% for passivators and ≥ 106% for furanic compounds) and good reproducibility (%RSD ≤ 1.9) were achieved using this method.
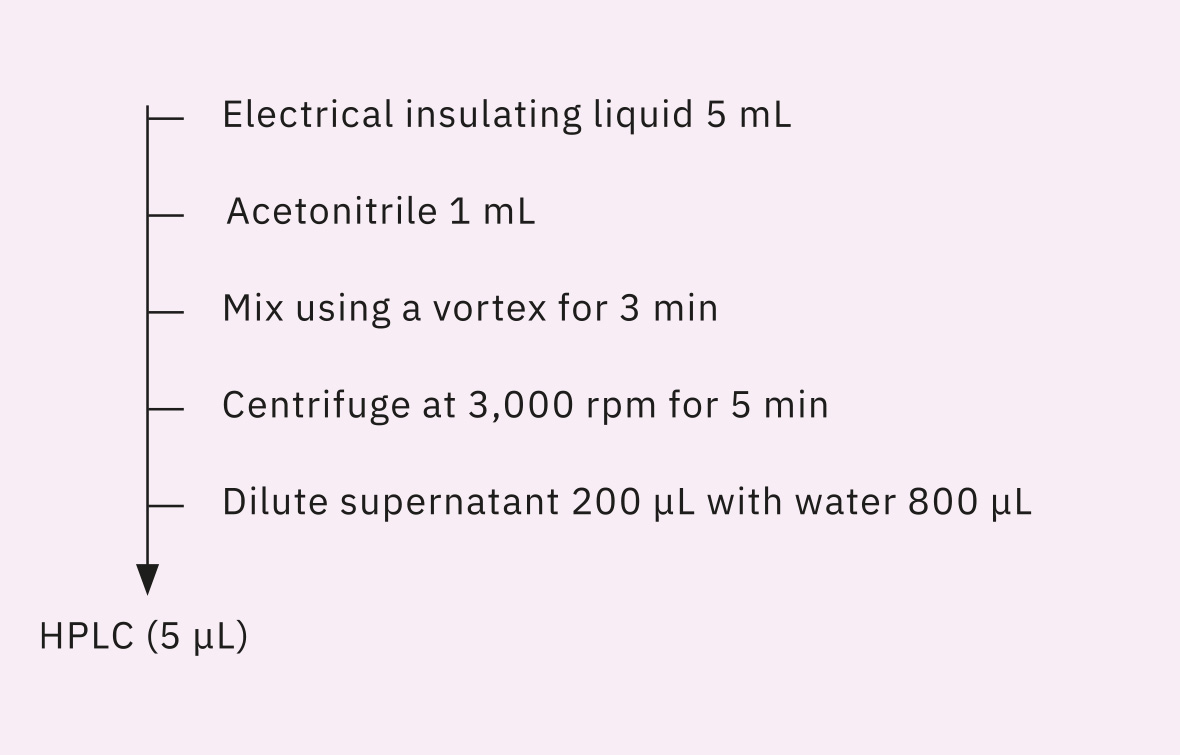
To evaluate the method for analysis of real-life samples, an accelerated aging test was conducted for four types of insulating oil heated at 150 °C for 48 and 96 hours, respectively. After pretreatment following the protocol shown in Figure 3, the samples were analyzed by HPLC. Figure 4 shows the resulting chromatograms at a) 220, b) 260 and c) 280 nm detection wavelengths of sample 3, in which BTA could be detected. The sample that was heated for 96 hours and spiked with 400 μg/L each of BTA and TTAA and 20 μg/L of each of the furanic compounds is shown in black. The blue chromatogram shows the results from insulating oil that was heated for 96 hours. Sample 3, which was heated for 48 hours, is plotted in red. Table 2 shows the results of the quantification of furanic compounds and passivators in all four samples of insulating oil.
|
Sample |
Heating (hrs) |
BTA |
TTAA |
5HMF |
2FOL |
2FAL |
2ACF |
5MEF |
|
1 |
48 96 |
N.D. N.D. |
N.D. N.D. |
N.D. N.D. |
N.D. N.D. |
7.0 9.0 |
23 33 |
4.0* 3.9* |
|
2 |
48 96 |
N.D. N.D. |
N.D. N.D. |
N.D. N.D. |
N.D. N.D. |
8.4 9.5 |
26 25 |
3.6* 4.3* |
|
3 |
48 96 |
140 190 |
N.D. N.D. |
N.D. N.D. |
N.D. N.D. |
8.8 10 |
29 27 |
5.2 5.3 |
|
4 |
48 96 |
N.D. N.D. |
N.D. N.D. |
N.D. N.D. |
N.D. N.D. |
9.0 8.9 |
50 21 |
4.1* 4.2* |
Table 2: Results of the quantification of BTA, TTAA and furanic compounds in 4 samples of insulating oil (µg/L)
* Provided for reference purposes only, as the values are not within the range of the calibration curves; N.D. = not detected
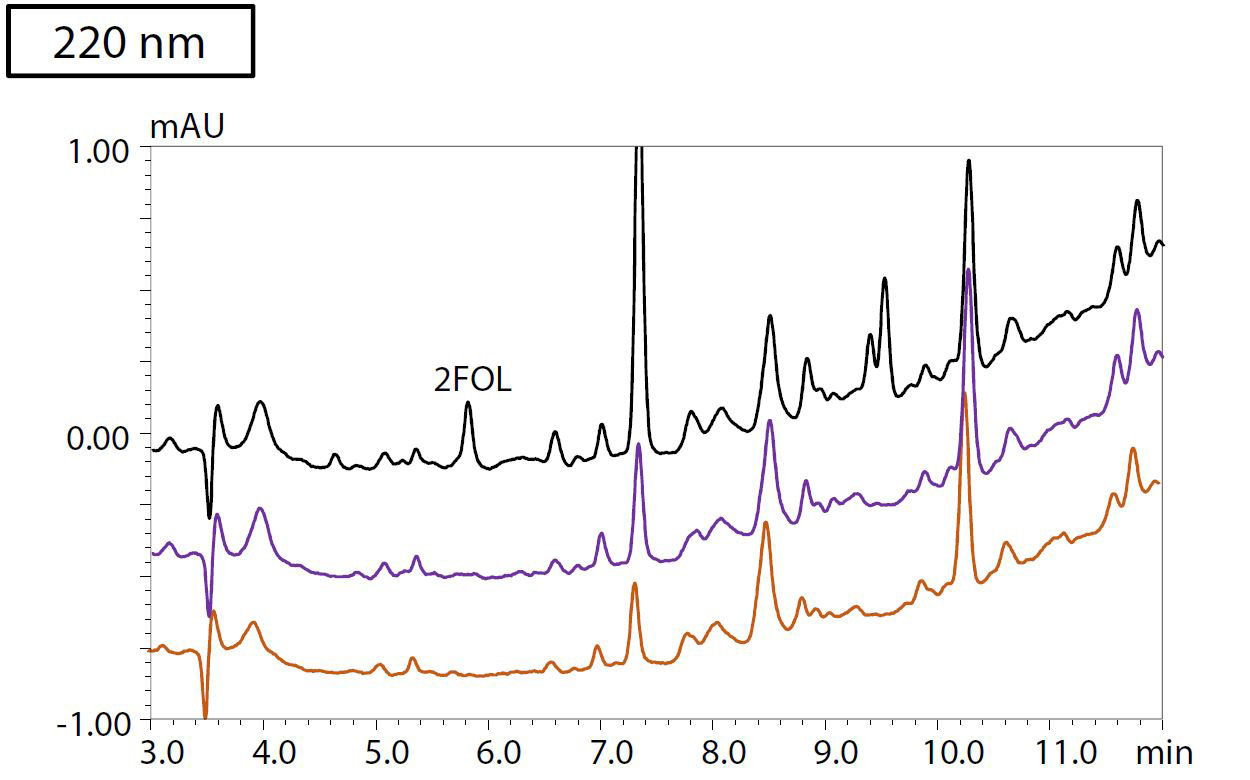
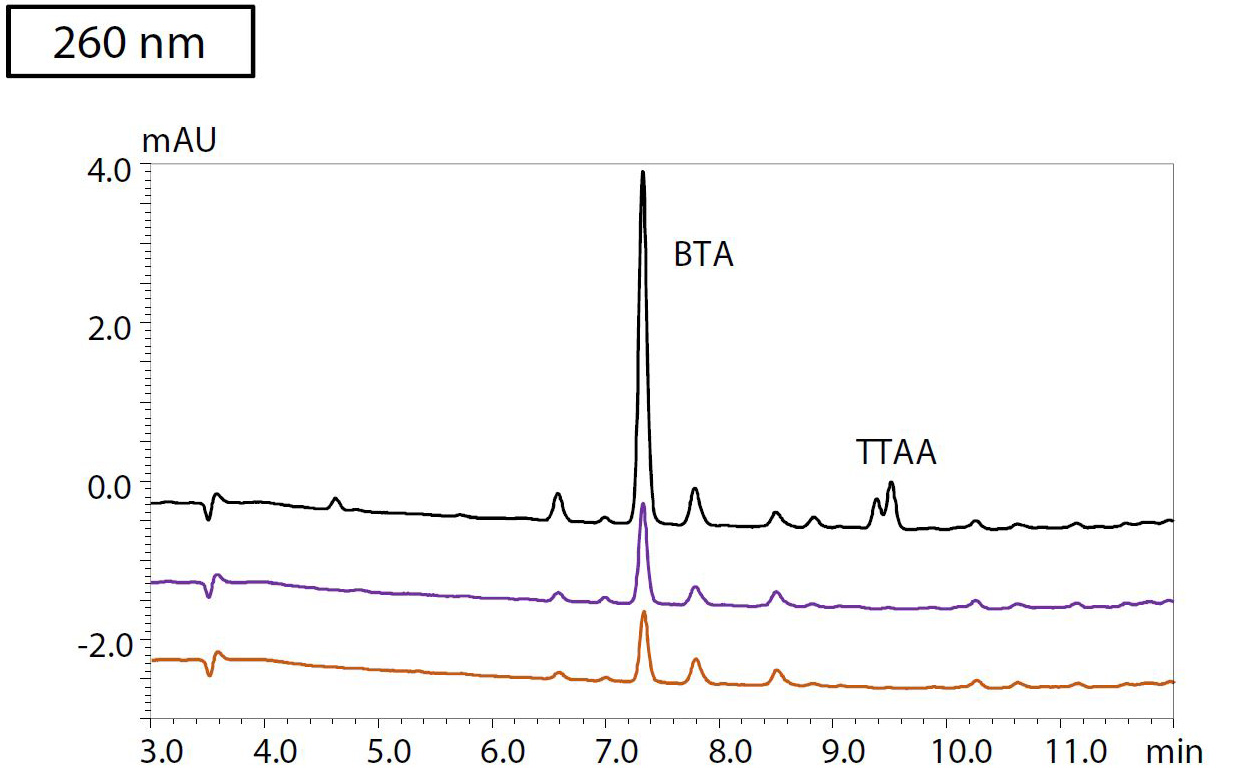
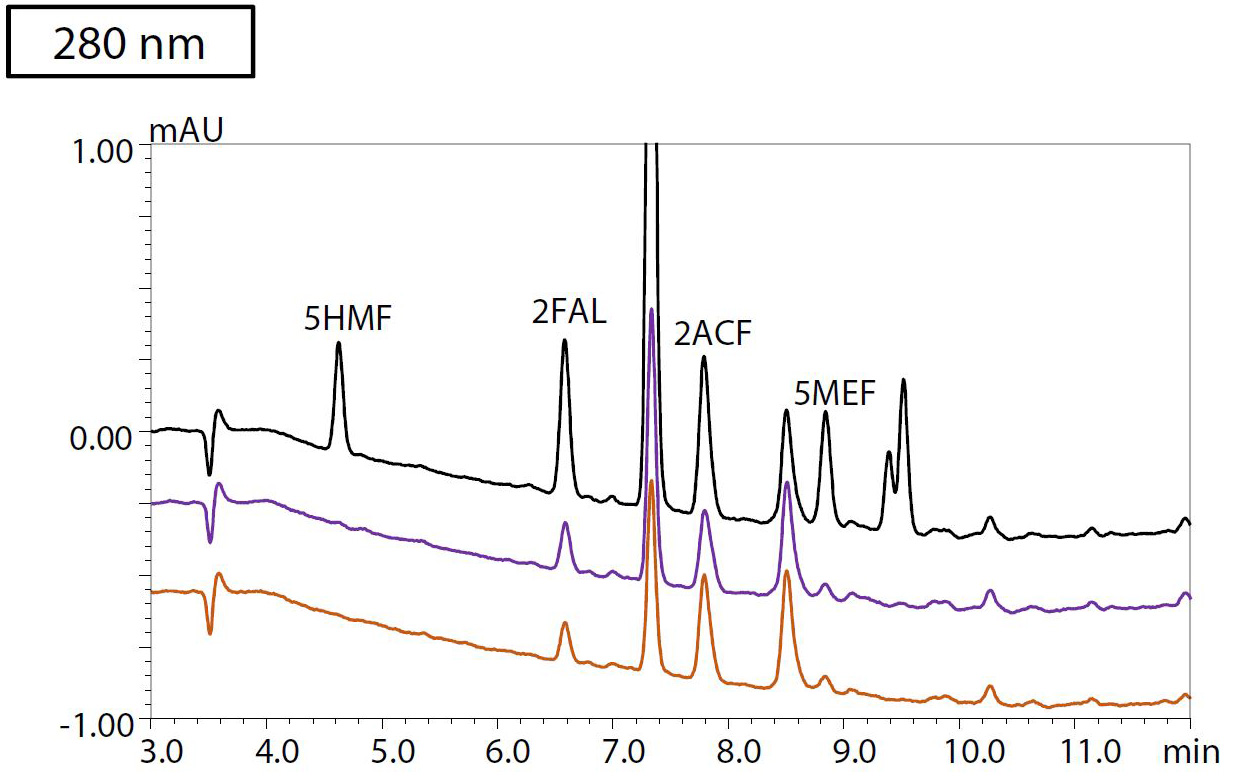
Figure 4: Chromatograms of oil sample 3, detected at a) 220 nm, b) 260 nm and c) 280 nm
Black: Heated for 96 hours + spiked with 400 μg/L of each of BTA and TTAA, and
20 μg/L of each of the furanic compounds. Purple: Heated for 96 hours. Orange: Heated for 48 hours
Further optimization
After it was demonstrated that the passivators and furanic compounds in insulating oil can be analyzed simultaneously by optimizing the HPLC test method for furanic compounds specified in the ASTM D5837-15, further optimization was investigated by method transfer to UHPLC conditions.
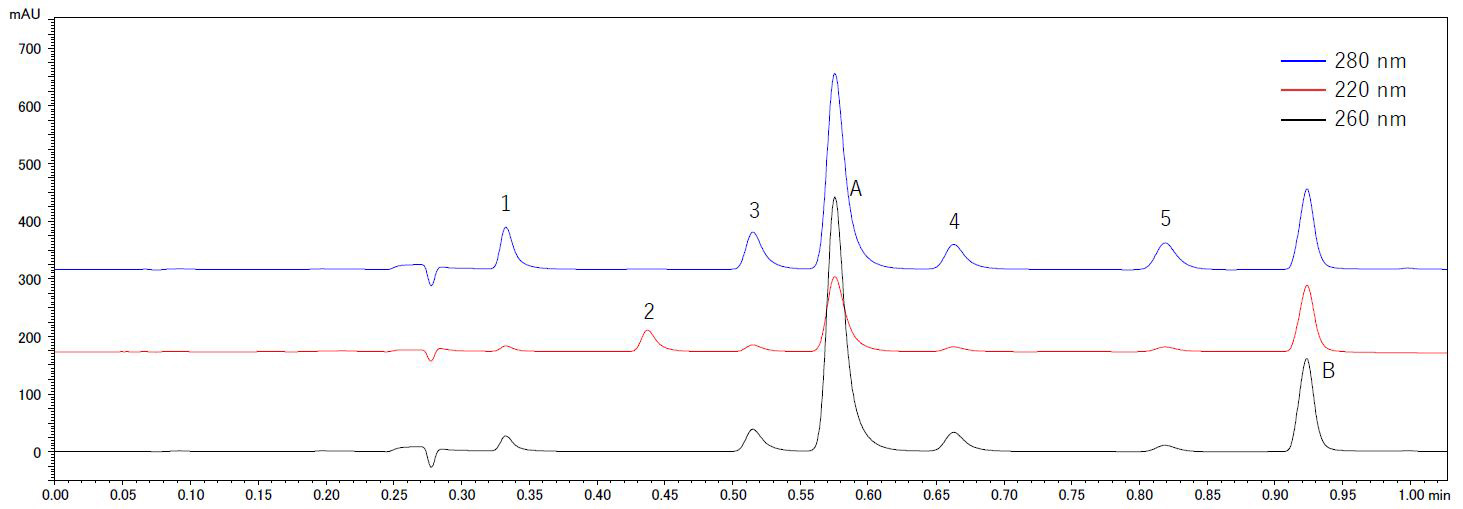
Analytical conditions and standard chromatograms of the UHPLC analysis can be found in Table 3 and Figure 5 respectively. Baseline separation of the seven compounds of interest was achieved in only 1 min in a 5 min gradient run. Analytical conditions were adjusted for TTAA isomers to elute in one peak.
|
System |
Shimadzu Nexera X3 UHPLC |
|
Column |
Shim-pack XR-ODS III (75 mm × 2.0 mm I.D., 1.6 µm) |
|
Flow rate |
0.7 ml/min |
|
Mobile phase |
A) water B) acetonitrile |
|
Time program |
20% B (0-0.3 min) → 90% B (1 min) |
|
Column temp. |
50 ˚C |
|
Injection volume |
5 µL |
|
Detection (PDA) |
λ = 220, 260 and 280 nm |
Table 3: Analytical conditions of the UHPLC analysis of BTA, TTAA and furanic compounds
Linearity and repeatability
Calibration curves were prepared from standard solutions within the concentration range of 0.2, 1, 5, 10 and 20 mg/L for BTA and TTAA and in the range of 0.01, 0.05, 0.25, 0.50 and 1 mg/L for the furanic compounds. Repeatability was determined at the highest concentration for each analyte. With r2 > 0.9999 and %RSD ≤ 0.25% for all compounds under investigation, good linearity and repeatability could be proven. Detailed results are listed in Table 4.
|
Compound |
Detection |
Linearity (r2) |
Repeatability (%RSD) |
|
BTA (A) |
260 nm |
> 0.9999 |
0.12 |
|
TTAA (B) |
260 nm |
> 0.9999 |
0.19 |
|
5HMF (1) |
280 nm |
> 0.9999 |
0.13 |
|
2FOL (2) |
220 nm |
> 0.9999 |
0.11 |
|
2FAL (3) |
280 nm |
> 0.9999 |
0.24 |
|
2ACF (4) |
280 nm |
> 0.9999 |
0.09 |
|
5MEF (5) |
280 nm |
> 0.9999 |
0.14 |
Table 4: Linearity (r2) and repeatability (%RSD) (n = 6) of the analysis of BTA, TTAA and furanic compounds at the respective detection wavelength
Sample pretreatment and determination of recovery
All samples were pretreated following ASTM D5837-15, as shown in Figure 3. To ensure good recovery using this method, BTA, TTAA and furanic compound standards dissolved in toluene were spiked into white oil and extracted using the proposed protocol. The dilute supernatant was analyzed by UHPLC. As shown in Table 5, high recovery (≥ 86% for passivators and ≥ 97% for furanic compounds) and good reproducibility (%RSD ≤ 1.4) were achieved using the described pretreatment method.
|
Compound |
Recovery (%) |
Reproducibility (%RSD) |
|
BTA (A) |
89 |
0.85 |
|
TTAA (B) |
86 |
0.84 |
|
5HMF (1) |
98 |
0.78 |
|
2FOL (2) |
102 |
0.71 |
|
2FAL (3) |
99 |
1.2 |
|
2ACF (4) |
99 |
0.85 |
|
5MEF (5) |
97 |
1.4 |
Table 5: Recovery (%) and reproducibility (%RSD) (n = 3) of the extraction of BTA, TTAA and furanic compounds from white oil following ASTM D5837-15
Conclusion
Proof of concept was successful. First, a fast and simple HPLC method for simultaneous analysis of passivators and furanic compounds in insulating oil was developed by optimizing the test method for furanic compounds specified in ASTM D5837-15. Even though ASTM D5837-15 and BS148:2009 specify separate analytical methods for quantification of BTA, TTAA and furanic compounds, separation of the seven analytes from each other and impurities in insulating oil could be readily achieved [1]. And second, a method transfer to UHPLC conditions showed a further reduction in the time needed for analysis. Using UHPLC, quantification of all analytes of interest could be done in one 5 min gradient assay, using the proposed conditions.
Sometimes relatively small steps can lead to large advances. In this case, keeping electrical transformers and condensers working well is now a lot easier to do.