The quantification of color
Laser toner and nail polish – Study on color pigments with UV-Vis spectroscopy and color analysis software
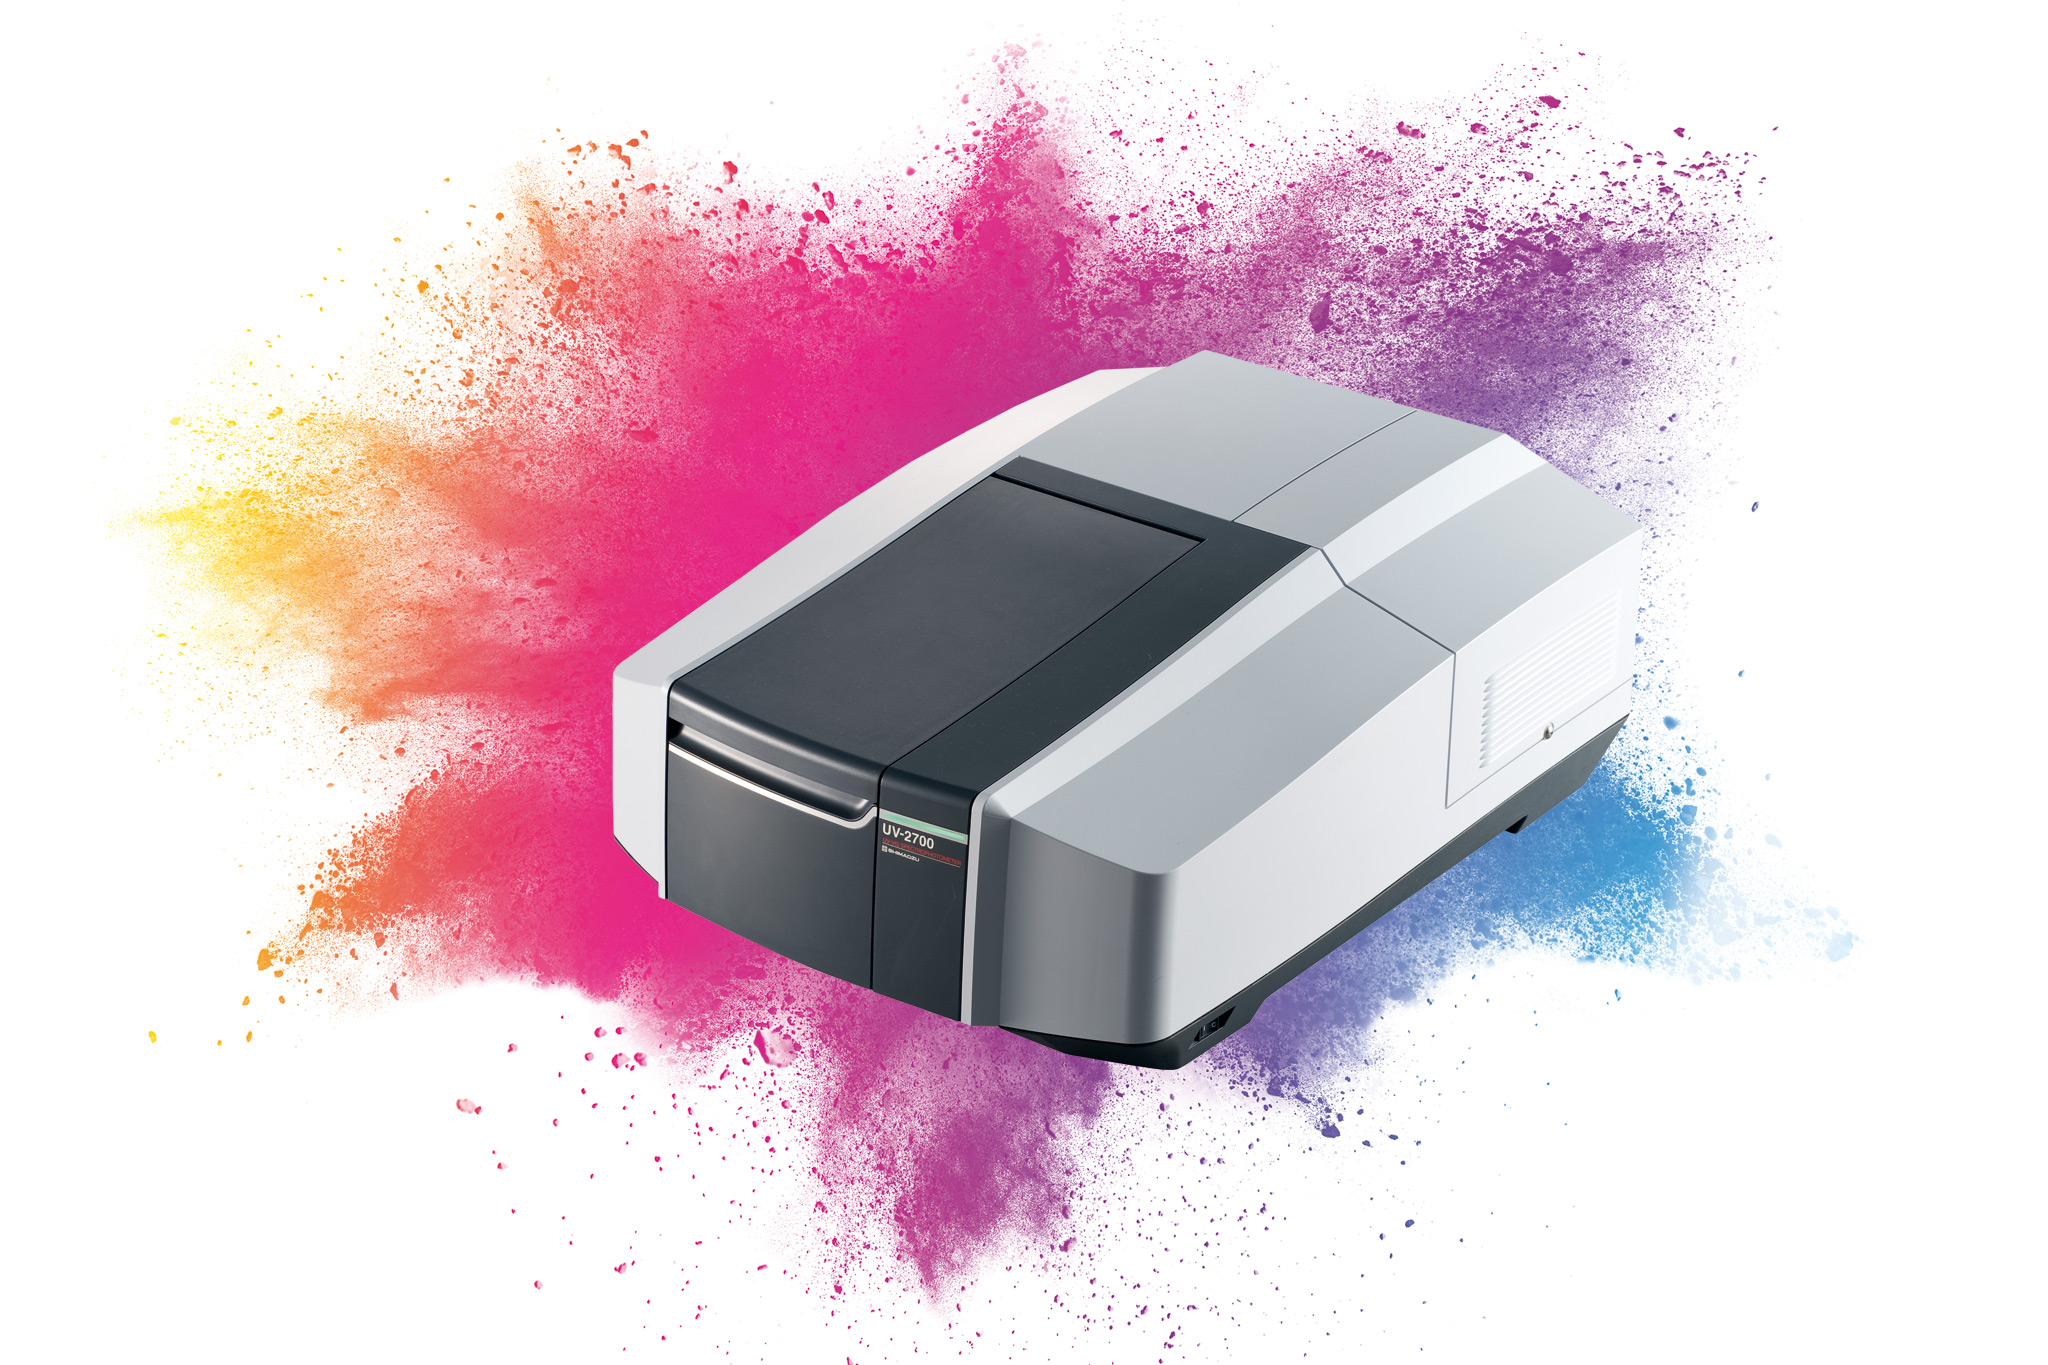 Figure 1: Shimadzu UV-2600 spectrophotometer
Inks and pigments make the world colorful. But today, color is not purely ornamental, a signal or symbol, it can also be precious: toner for laser printers is said to be more expensive than its weight in gold.
Depending on its characteristics, color generates films for protection against sunlight, heat, corrosion, and many more. To ensure a constant quality, color is prepared following regulations, which describe color scales to make the production of color independent of human subjective judgement.
The material property “color” is linked to the absorption, transmission or reflection of visible light. Pigments absorb light of some wavelengths, appearing in the complementary color to the absorbed light. For this reason, UV-Vis spectroscopy is the tool of choice to measure the color of pigments. While the wavelength of transmission or reflection maxima already gives some implication of the color, the use of color models independent from the measurement method is much more practical. With color software, the transmittance or reflectance values are used for the calculation of color coordinates that describe the color in the context of a given color model.
In this application, the Shimadzu UV-2600 spectrophotometer equipped with the ISR-2600plus integrating sphere is used to measure diffuse reflection spectra of laser dye pigments and to calculate color coordinates of these pigments with the LabSolutions UV-Vis color software. Additionally, nail polish samples are measured in direct transmission for the color analysis.
Integrating spheres
The integrating sphere is a hollow ball made of highly reflective material with ports for detectors, samples or white standards. Light entering the sphere through an opaque solid or reflecting into the sphere from a diffuse reflector will be collected by the reflective inner surface of the sphere and recorded by the detectors.
Figure 2 shows the schematic of the ISR-2600plus. The detectors are mounted on top and bottom of the sphere and are excluded from the diagram on the right side.
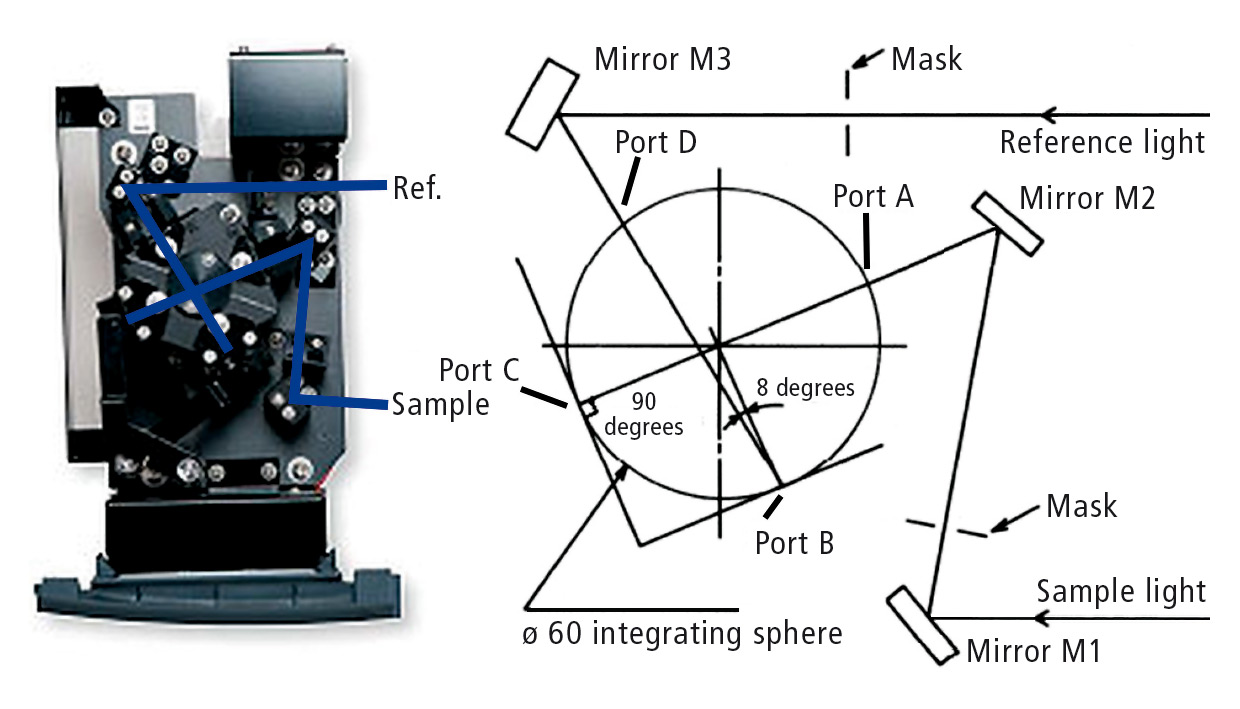 Figure 2: Shimadzu ISR-2600plus integrating sphere with beam diagram
Sample and reference beam can be switched depending on the target measurement. To measure the diffuse only reflectance from a sample, the sample is placed at port C and the sample beam enters through port A. Specular reflected light is excluded, as it exits the sphere through port A. To include specular reflectance, the sample is mounted on port B and the sample beam enters through port D. The incident angle of light to sample surface in that case is 8 degrees and a mixture of specular and diffuse reflected light is included in the measurement. For transmittance measurements, the sample is placed at port A. White standards are used to close ports B and C if no sample is placed there.
Color models
Two popular color models are used in this application. The color values are calculated from the reflectance spectra by different equations, that are not described in detail here.
One color model is the tristimulus model [1], which describes color as combination of three (abstract) color stimuli X, Y and Z. This model is based on the three kinds of color receptors in human eyes and how the mixture of stimuli is interpreted as color by our brain. A graphical representation plots color coordinates x and y in a representation similar to the color circle (“color horseshoe”), as shown on the left side of figure 8.
The CIELab [2] model is based on a three-dimensional color space and was developed to represent color in a manner that is consistent with human perception of color. The axes of the three-dimensional coordinate system are based on the three stimuli bright – dark, red – green and blue – yellow.
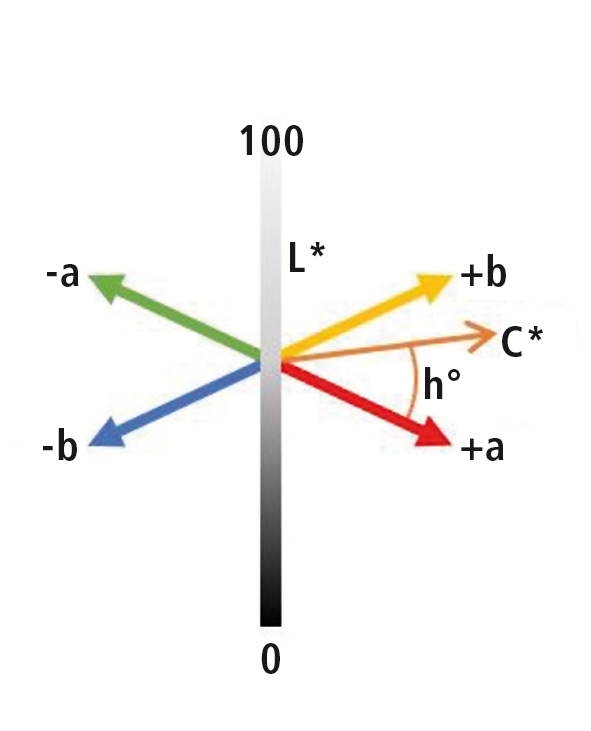 Figure 3: CIELab color scheme illustrated as vectors
Any point in the CIELab color space can be described by its lightness index L* and either in cartesian color coordinates a* and b* or in polar coordinates hue angle h° and chroma C*. Hue is the color as in the color circle and chroma is the intensity of that color. A graphical representation uses a two-dimensional plot for the color coordinates at one fixed L* (right side of figure 8) or a three-dimensional color sphere.
Just as our perception of colors depends on the lighting conditions, the color values in each model differ with the chosen reference light source and observation angle. This choice depends on the purpose of the color measurement, e.g. color fastness of products that are presented to customers under defined lighting conditions. Here, the standard illuminant D65, that simulates sunlight, and an observation angle of 10° were used for all calculations.
Samples
Three powder samples and three film samples from ink and pigments were analyzed. The powders were coarse and would be difficult to measure by pressing into the surface of Barium Sulphate (the preferred method of sample preparation), so instead were measured in a special powder cell. Each of the laser dye samples was mounted at the diffuse reflectance port (port C in figure 2) of the integrating sphere. The reference material was uncovered Barium Sulphate, the surface material of the integrating sphere.
Seven different nail polishes were applied to glass substrates and measured with a film holder in direct transmission mode without integrating sphere. A clean glass plate was used as reference.
Spectra
The diffuse reflectance spectra in the range of 200 – 900 nm are shown in figure 4. The dark and light blue traces are from the blue dye film and powder measurements, the black and grey lines are from the white dye film and powder measurements and the red trace is from the red dye film measurements.
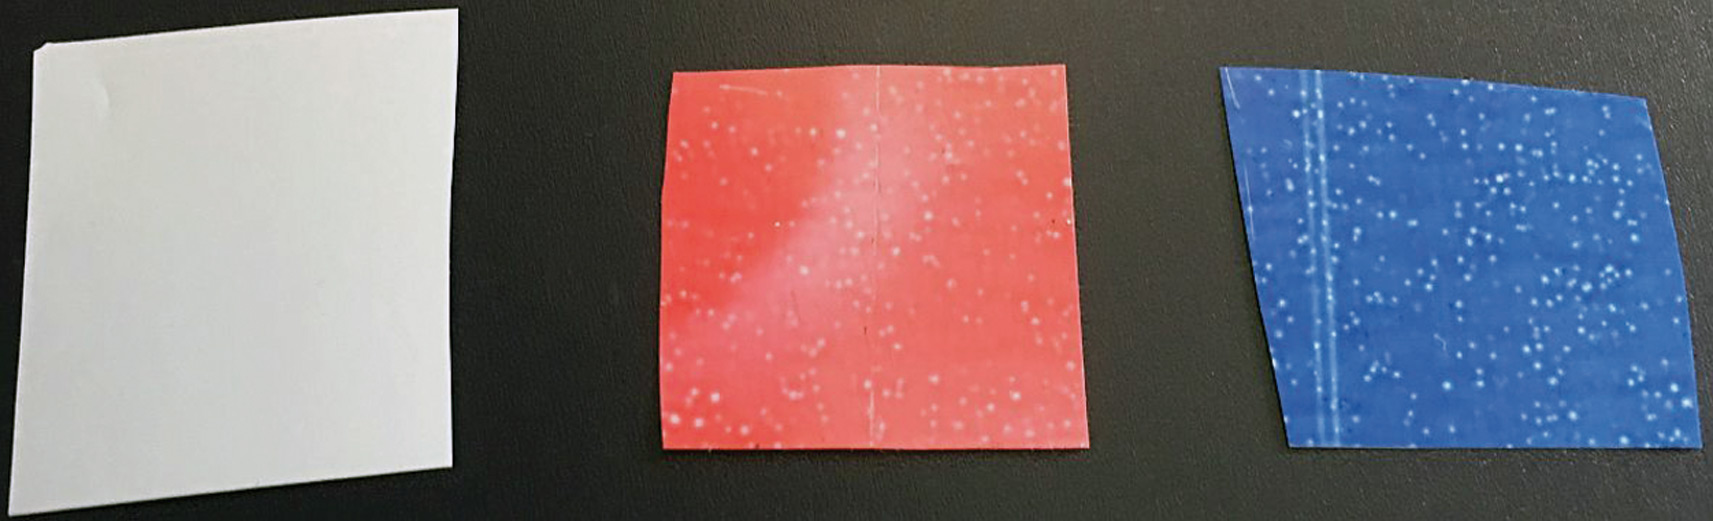 Figure 4: Laser dye film samples. From left to right: White, red and blue.
All film spectra show peak structures in the range around 400 nm. These may be characteristic for the film material or the base coat of the treatment. The spectra of the white samples show a more or less flat line over the visible range, as expected. The spectrum of the red sample shows a reflectance maximum at 600 nm and general high reflectance in the red spectral region. The blue color is not reflected by specific peaks: both film and powder sample of the blue dye show the highest reflectance in the region of 700 nm and above and a small maximum at 600 nm. Blue is a mixed color in this case and a more detailed analysis is needed to discern it from the spectrum.
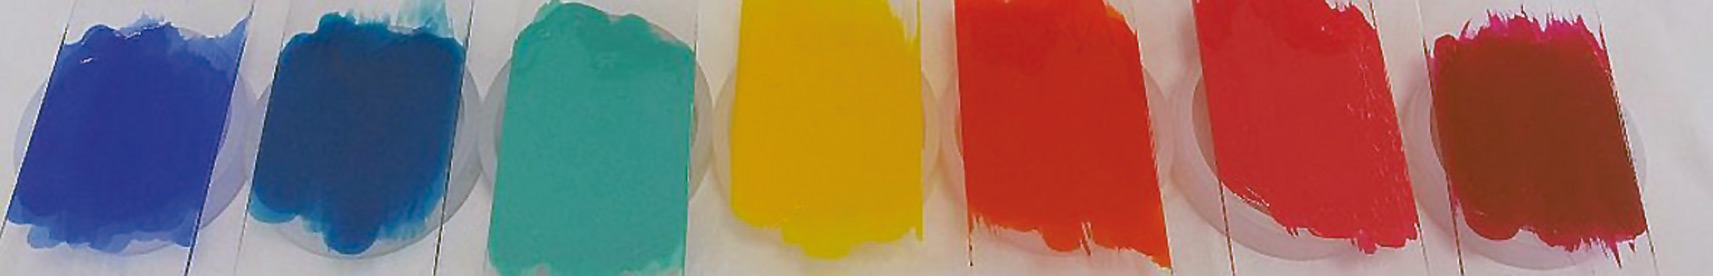 Figure 5: Nail polish film samples. From left to right: Gel blue, blue, turquoise, yellow, orange, pink, red.
The spectra of the nail polish samples are shown in figure 7. Most of the colors are already indicated by the transmission maxima. The spectra of the blue nail polishes show a transmission maximum below 500 nm, at the edge of the blue and green spectral region. Blue is again a mixed color here. The spectrum of the turquoise nail polish shows a transmission maximum around 500 nm, in the green spectral region. This transmission maximum is shifted to longer wavelengths for the orange nail polish. The spectra of the yellow and red nail polishes don’t show a sharp peak, but a general rise of the transmission value that starts in the yellow and red spectral region, while the pink line shows a steep rise of the transmission value at 600 nm. All spectra show a rise of transmission towards the red end of the wavelength scale.
Color analysis
The five diffuse reflection spectra from figure 6 and the seven transmission spectra from figure 7 were evaluated with the LabSolutions UV-Vis color module [3]. The evaluation table is shown in table 1. Evaluation items are: peak wavelength, color coordinates x, y, a* and b* and lightness index L*. For all color coordinates and the lightning index, standard illuminant D65 [4] was used as colorimetric illuminant and 2° as viewing angle.
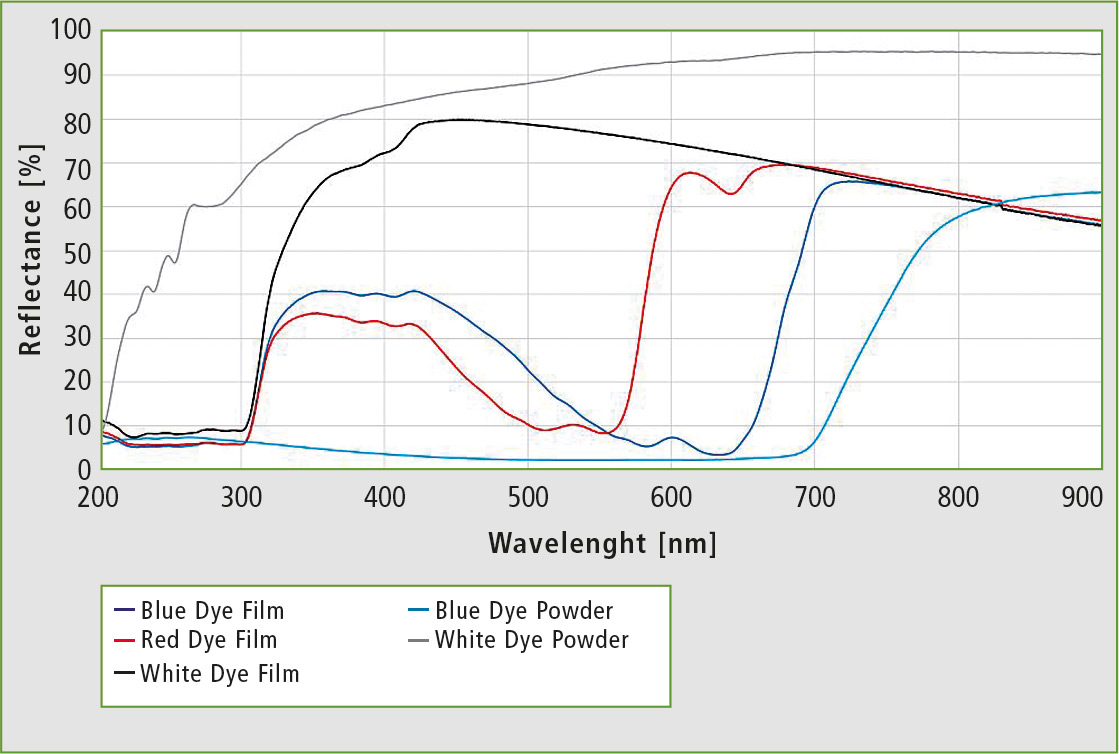 Figure 6: Diffuse reflectance spectra of the laser dye samples
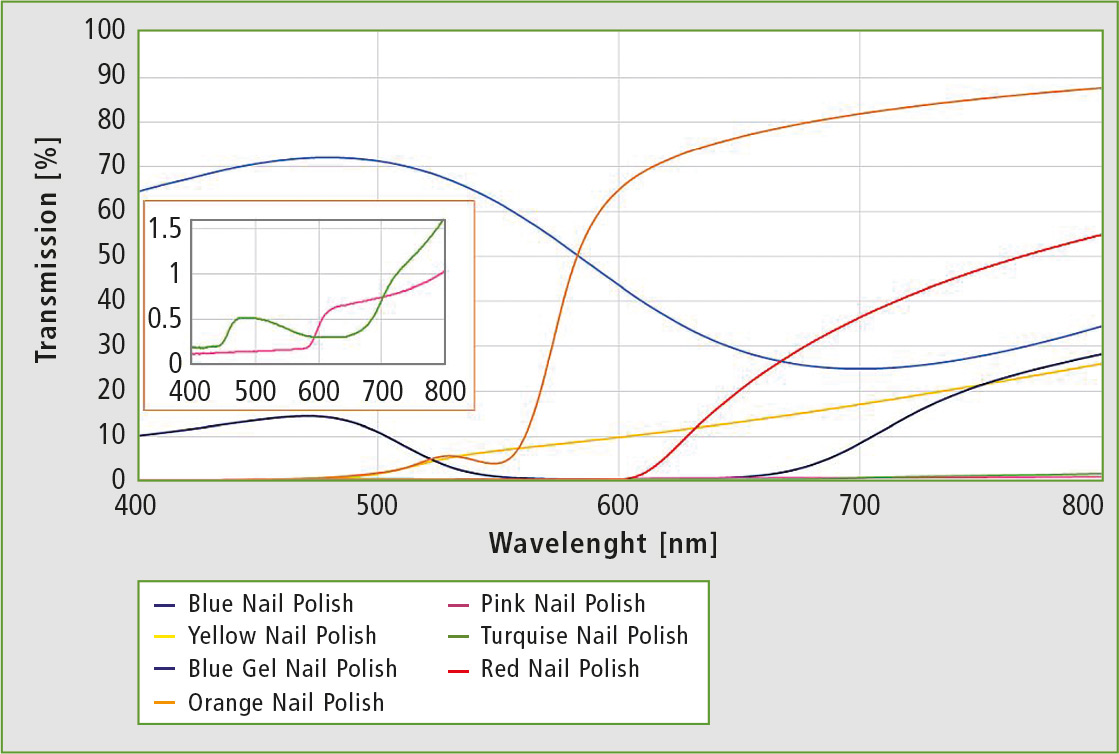 Figure 7: Spectra of the nail polish samples. Inset: zoom into the spectra of the turquoise and pink nail polish.
Figure 8 shows the plot of the x and y color coordinates in the left graph and the plot of the a* and b* color coordinates in the right graph. This analysis shows, that all expected colors are indeed reflected in the color graphs, even though they might not be visible at the first glance of the spectra. The white samples are placed in the green region in the a*-b*-plot by their color coordinates, but they show very high lightness indices L*, near 100 %. All three values are important, when judging a color. In the x-y-plot they are at the white center, as expected.
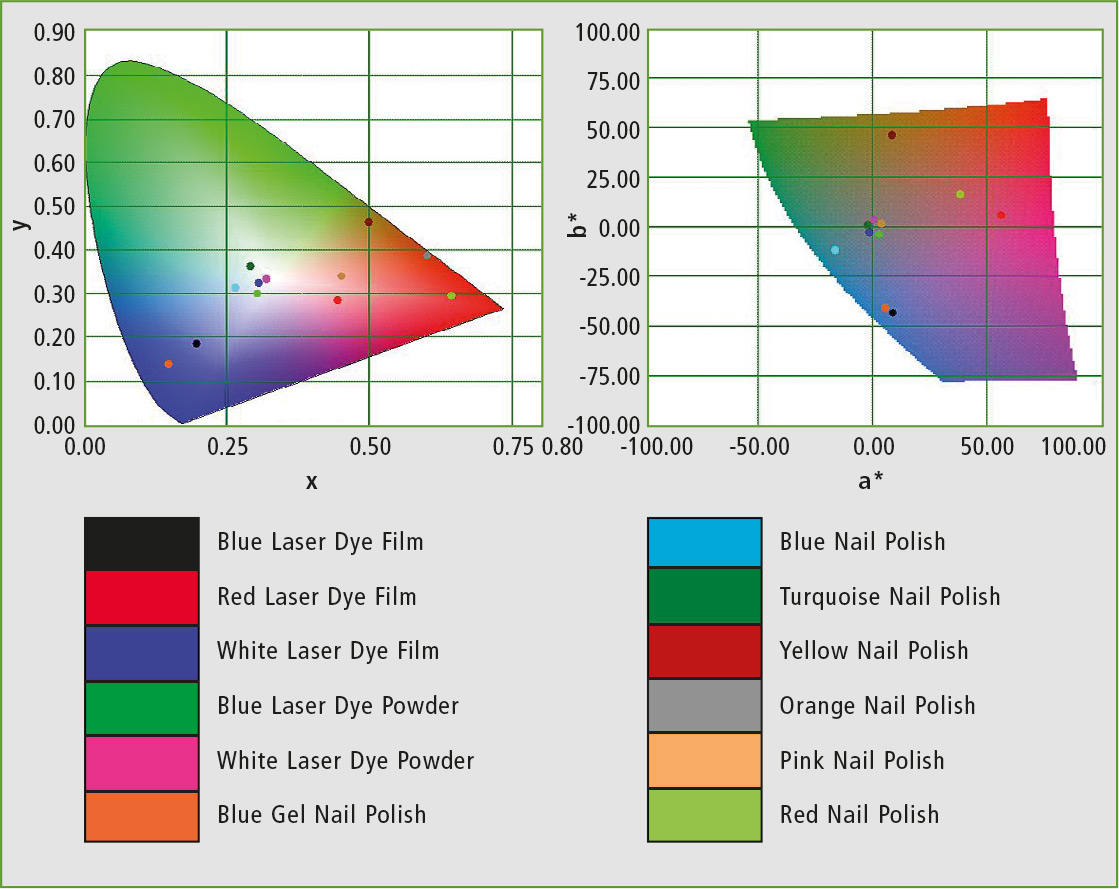 Figure 8: x-y-plot (left side) and a*-b*-plot (right side) of the color coordinates from table 1. Mind that brightness L* is not plotted, but it is different for all samples.
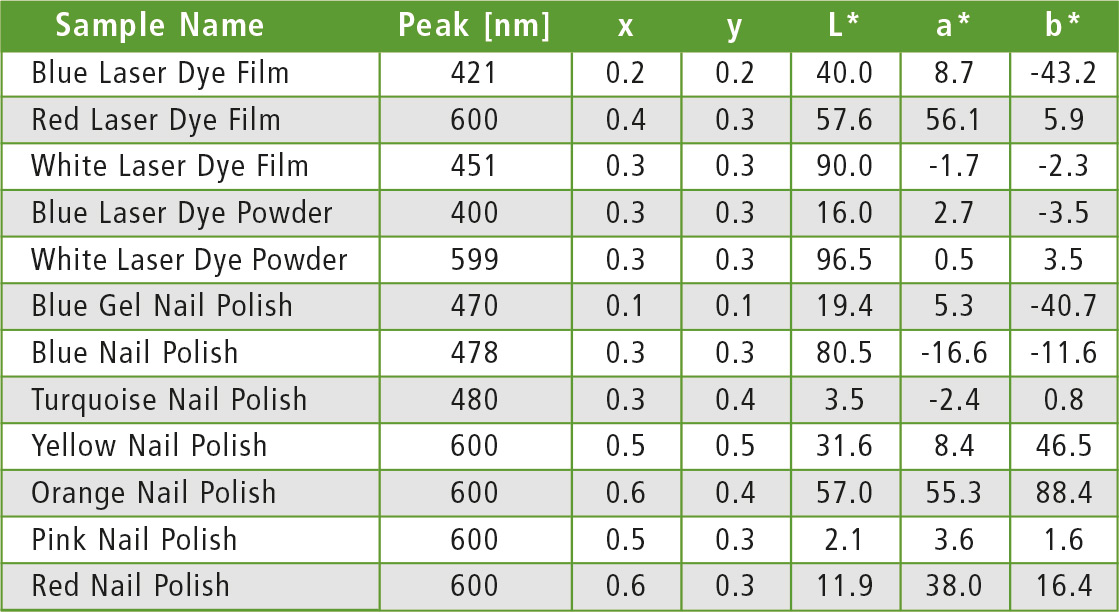 Table 1: Evaluation results for the dye UV-Vis measurements and the LabSolutions UV-Vis color analysis.
Conclusion
UV-Vis spectroscopy is a valuable tool for color analysis and quality control. Even though human individual perception of colors might be different, the use of color models with defined illuminants and observation angles allows to define testable color coordinates. This analysis works well both for transmission and reflection spectra. With the LabSolutions UV-Vis color software, the color analysis is easily done without the need to export data and it can even be automated.
Special thanks to:
Dr. Robert Keighley, Shimadzu UK for the results of the laser dye measurements.
Literature
[1] https://en.wikipedia.org/wiki/CIE_1931_ color_space
[2] https://en.wikipedia.org/wiki/CIELAB_ color_space
[3] ISO 11664-2:2007(E)/CIE S 014-2/E: 2006 colorimetric illuminants
[4] LabSolutions UV-Vis Brochure