Carbon content in ultrapure water
Risk assessment, experiments, measurements
Many industry sectors such as pharmaceutical production or semiconductor manufacturing require ultrapure water. Regular controls of the organic carbon content are necessary to make sure the water quality complies with specifications.
The definition of the purity of ultrapure water for production is based on various physical, chemical and microbiological parameters. A central sum parameter is the content of total organic carbon (TOC). It comprises the largest of all substance groups.
To determine TOC, the ultrapure water sample is mixed with an acid which converts the inorganic carbon compounds, carbonates and hydrogen carbonates, into carbon dioxide. A purge gas, usually synthetic air, expels the resulting CO2. An aliquot of the sample is then oxidized to convert the dissolved organic substances to carbon dioxide, which is detected by a non-dispersive infrared (NDIR) detector.
Regular inspection
No matter how ultrapure water is produced, it is never completely free of foreign substances such as organic compounds. Over time, carbon content in the water increases. Materials in contact with water release organic substances, and organic and inorganic substances are dissolved from the ambient air into the ultrapure water. It is therefore challenging to store and handle ultrapure water, and it must be checked before use. In TOC analysis, ultrapure water is both sample and operating material; it is contained in the rinsing solutions of the analyzers and used to prepare calibration solutions.
Due to the blank value or residual concentrations of the ultrapure water used in standard solutions, the results shift to higher measured values, and the calibration curve therefore gets a positive Y-axis section. The smaller the measuring range, the greater the influence of the blank value on the calibration.
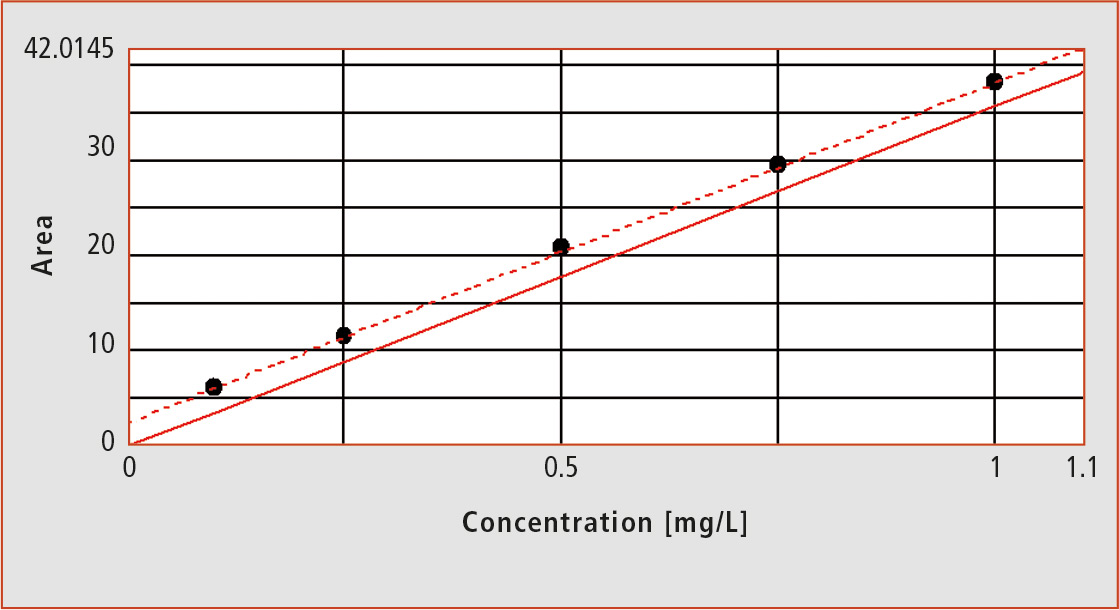 Figure 1: Calibration function with zero offset at TOC-LCPH
For TOC measurement of ultrapure water samples and samples in the trace range, a positive Y-axis section is not desirable, since such samples do not have residual concentrations. Using the calibration curve for quantification with the formula: TOC content = (measured area value minus axis intercept) divided by the slope, the TOC content would be changed unintentionally. To avoid this, a zero offset, the parallel shift of the calibration line through the zero point is necessary. It needs to be performed ahead of evaluation in order to subtract the blank value from the preparation of the standard solutions with TOC content (figure 1).
Impurities from the environment
In addition to blank values from the ultrapure water and the reagents used, impurities from the environment can also be present in the TOC measurement. These are often random, and in many cases neither reproducible nor clearly determinable. For example, they originate from residues in sample bottles, measuring vessels and chemicals, or from the laboratory environment.
To illustrate this contamination process, ultrapure water from a bottle (HPLC ultrapure water) was analyzed. TOC specification of the water was below 5 µg/L. An aliquot of the sample was taken, analyzed, and the bottle closed tightly. Even the first analysis value did not meet the specifications as it showed a higher TOC content of 25 µg/L. This examination was repeated several times within three hours. During this period, the TOC content increased to over three times the initial value (table 1).
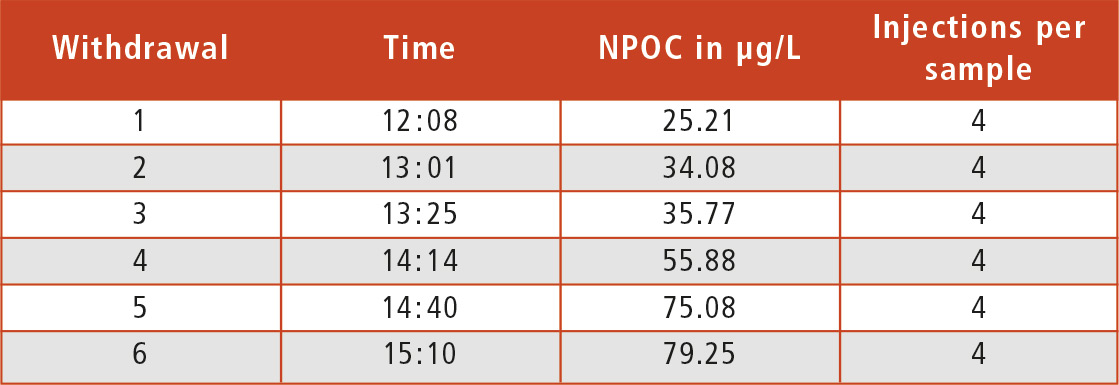 Table 1: Table of test results
The type and number of sources of contamination, their influence and effect on trace analysis depends among other things on the structure, equipment and analytical parameters of a laboratory. It is therefore necessary for every lab doing ultrapure water measurements to identify sources of contamination and to evaluate them through tests and examinations of the lab processes. On the basis of a risk assessment, measures must be taken to limit the carbon input to an acceptable level.
Identifying contamination sources
A simple experiment shows how large the TOC input from the laboratory air can be. Four beakers, 100 mL each, remained open to the environment of the TOC laboratory. The ultrapure water from a fifth beaker was filled directly and acidified for the measurement. Every two hours, one of the four open beakers was filled and acidified for analysis. In the end, all five samples (0 h, 2 h, 4 h, 6 h and 8 h) were tested for TOC.
In addition to laboratory space, it may be useful to examine adjacent areas or the outside air to find contamination paths. This test setup works analogously without acidification for conductive inorganic and organic compounds.
Another useful test, even if all laboratory processes work well, is to check the glassware set for TOC entry. At random, at least two of each of the glassware from the laboratory cabinet would be removed for TOC analysis. One from each pair is then prewashed according to the working instructions. The other glassware is used without further preparation. For the actual test, the glass vessels are filled with ultrapure water with known TOC content (blank value measurement) and left to sit for at least two hours before samples are taken. In case of small glassware such as 10 mL volumetric flasks, several can be flushed.
For sample vessels or storage containers for acids, standards or rinsing solutions, it makes sense to extend the time span usually used for sampling or analysis. The use of plastic vessels is not recommended for TOC trace analysis. But if they are already in use, glass and plastic should then be compared.
Conclusion
It is easy to carry out tests to see how far organic substances contaminate ultrapure water. The tests indicate the extent to which the environment affects the contamination of ultrapure water. Hence, it is possible to observe and reduce the carbon input.
This article was written in cooperation with Mr. Arno Bayerl, Divisional Head cleaning validation and hygiene, TECHPharm GmbH.
Read for you in Nachrichten aus der Chemie 5/18