Customized solutions for cannabis testing
Analytical solutions meeting latest regulations
As of July 2018, over 20 European countries have legalized cannabis for medical use, and more are expected to follow in the coming years. Possession of cannabis is still illegal by federal statute; however there is an ongoing debate concerning legalization of medical and recreational cannabis. The demand for cannabis testing and analytical tools is therefore growing.
Numerous health benefits have been reported for cannabis, including general pain reduction, anti-nausea and reduction of seizures and autism. QC testing for cannabinoids is essential for the accurate labeling of cannabis products in both medical and recreational cannabis markets. Cannabinoids are the primary active components of cannabis; these are target compounds for potency testing. Terpenes influence the homeopathic effect, and contaminants such as pesticide residues and mycotoxine in cannabis products also need to be controlled to ensure consumer safety.
Shimadzu offers a wide range of analytical equipment and provides customized solutions, appropriate configurations and application support for cannabis analysis, including sample preparation.
Potency testing for cannabis products by HPLC
While the reason for controversy of cannabis as a legal medicine is the psychoactive effect of only one of the cannabinoids contained, namely Δ9-tetrahydrocannabinol (d9-THC), therapeutic benefits such as pain relief and reduced severity of nausea and seizures were also reported with use of a combination of other phytocannabinoids [1, 2]. Additionally, a number of studies showed high safety with regard to a wide array of side effects and no tolerance to cannabidiol (CBD), another major component of cannabis, has so far been demonstrated [3, 4]. CBD-rich products with no or neglectable d9-THC content are therefore becoming increasingly popular, as they can be obtained legally without the prescription necessary for d9-THC containing medication.
Regulatory demands regarding d9-THC make it the primary focus of potency testing. Cannabis plant material contains d9-tetrahydrocannabinolic acid (THCA), the non-psychoactive, carboxylic acid form of d9-THC which is the precursor and is converted to THC upon heating. High performance liquid chromatography (HPLC) is the method of choice for quantification of cannabinoids in the presence of their acid form, as the high temperatures in gas chromatography (GC) only allow determination of total THC.
Cannabis “potency” is normally determined by quantitation of the major cannabinoids, including THCA, THC, CBD and CBN. The i-series HPLC analyzer for potency testing of cannabis products enables reliable quantification of eleven important cannabinoids (figure 1) using a fast and simple HPLC-UV assay. In the example described it was used for quality control in hemp oil with regards to the label claim of CBD as well as THC content.
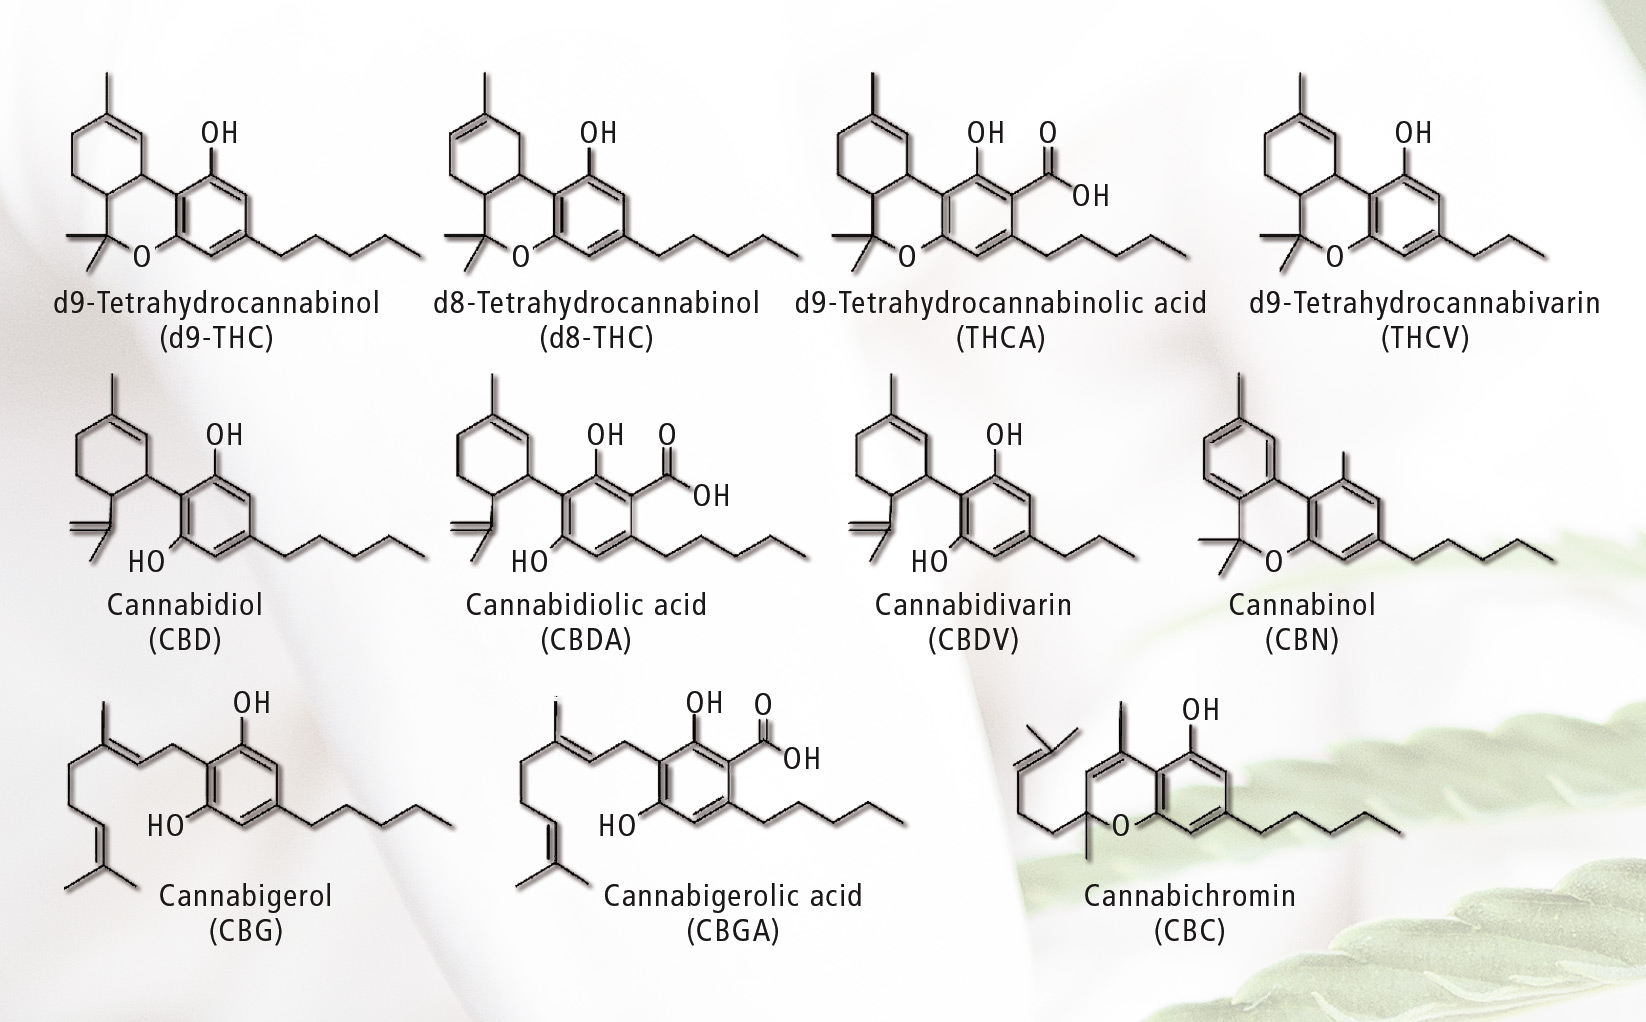 Figure 1: Cannabinoids determined in potency testing
Five hemp oil samples from various mail-order vendors were dissolved in isopropyl alcohol, diluted with methanol and filtered prior to HPLC analysis. Figure 2 shows chromatograms obtained from analysis of two different hemp oil samples for determination of total cannabinoid content (81 x diluted) as well as CBD content only (405 x dilution).
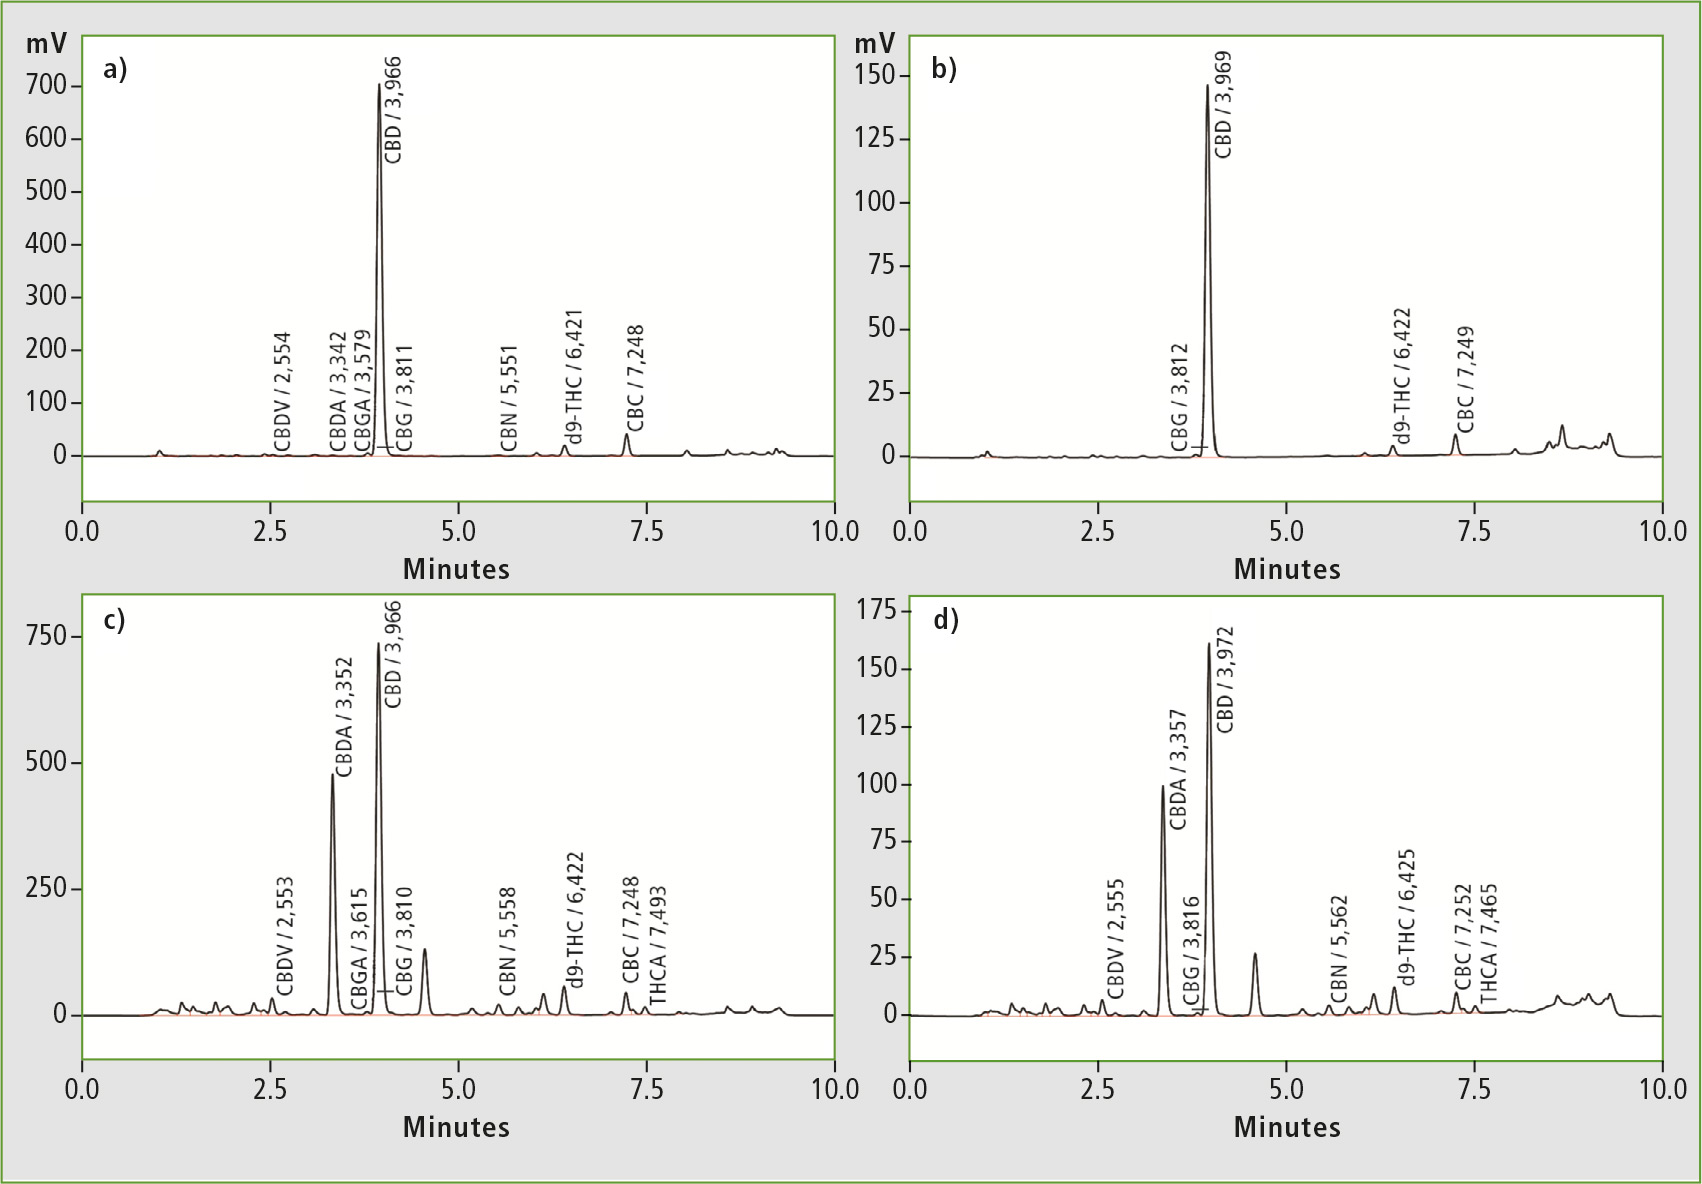 Figure 2: Representative chromatograms for total cannabinoid content (a + c) and CBD content (b + d) in two different hemp oils
Two of the five oils tested were clear with a weak yellow/green coloration and showed high ratios of CBD to total cannabinoid content (92 %). Both samples also tested close to label claim at 95 % and 92 % respectively. This led to the assumption that each of these oils was a product of multi-step purification after extraction.
A third sample on the other hand was not transparent, and brown/ green and gritty in appearance. It also exhibited a distinctly “earthy” odor and revealed the highest content of CBD and total cannabinoids, with the lowest ratio of CBD to total cannabinoids (59 %). It was most likely the result of crude extraction only, with no further refinement. Although its CBD % of label claim tested the lowest (81 %), this sample contained the highest level of CDB compared to all other oils tested.
The two remaining hemp oils tested higher than label claim at 122 % and 200 % respectively, calling into question the type and accuracy of testing used to justify label claim.
All samples contained less than 0.3 % d9-THC, as expected from hemp products. This study showed that in three out of five randomly selected samples the actual concentration of CBD did not comply with the stated content, and provides a simple and fast assay for CBD and total cannabinoid content for improved quality control of cannabis products.
Terpene profiling by GC-MS
Terpenes and terpenoid compounds are produced in trichromes (where THC is generated) and give cannabis its unique flavor and fragrance. Aside from their aromatic properties, terpenes also have advantageous health benefits. They act as essential, medicinal hydrocarbon building blocks and have a synergistic relationship with cannabinoids, influencing the overall homeopathic effect. From the pine odor of pinene to the citrus-like smell of limonene, characterization of terpenes is achieved easily using gas chromatography. With the Shimadzu GCMS-QP2020, HS-20 head space sampler and NIST spectral library more than 3,000 flavor and fragrance compounds can be identified for most efficient terpene profiling.
Cannabis has over 140 terpene components, many of which are of medicinal interest [5]. Predominant terpenes in cannabis include
- b-myrcene, which has antibiotic properties and enhances the THC muscle relaxant effect,
- a-pinene, which improves the THC bronchodilator effect and exhibits anti-inflammatory properties and
- b-caryophyllene, which also acts as an anti-inflammatory agent and increases the THC gastric cytoprotective effect, amongst other health benefits [6, 7].
The concentration of individual terpenes varies by strain, can be anywhere from 0.1 to 1.5 % of its total dry weight and can vary depending on harvest time, drying and storage conditions. Terpene levels can decrease over time and can, after three months of storage, be reduced by more than half [8].
The decrease in terpene amount over time varies for different terpenes. Due to the uniqueness of terpene profiles, they can be used by cultivators as a “fingerprint” to partially ID the specific strain in question. As an example, the analysis of several strains of cannabis for 41 terpenes using GC-MS with headspace injection is described here.
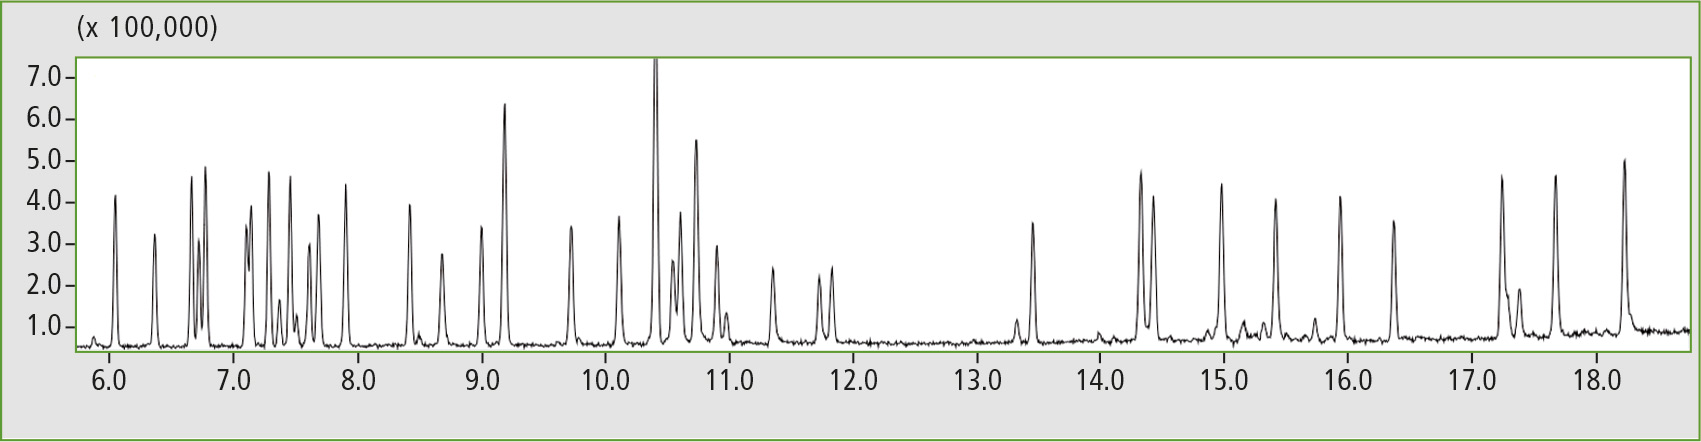 Figure 3: TIC chromatogram of terpene standard
A five-point calibration curve was created with concentrations ranging from 12.5 – 100 µg/mL. A part of the flower weighing 1.0 gram was frozen, followed by grinding to ensure a representative sample. Ten to 30 mg of the flower were then weighed into a headspace vial and capped. The final result was calculated to give wt %.
The first sample of cannabis, CB Diesel, was analyzed shortly after harvest. The resulting wt % of terpenes was similar to that in current literature [5]. The two other samples, Blue Dream and Haze Wreck, were stored at ambient temperature and exposed to light for one month prior to analysis. It has been demonstrated that different storage conditions can change terpene results over time, which should be taken into consideration when analyzing cannabis samples (figure 4).
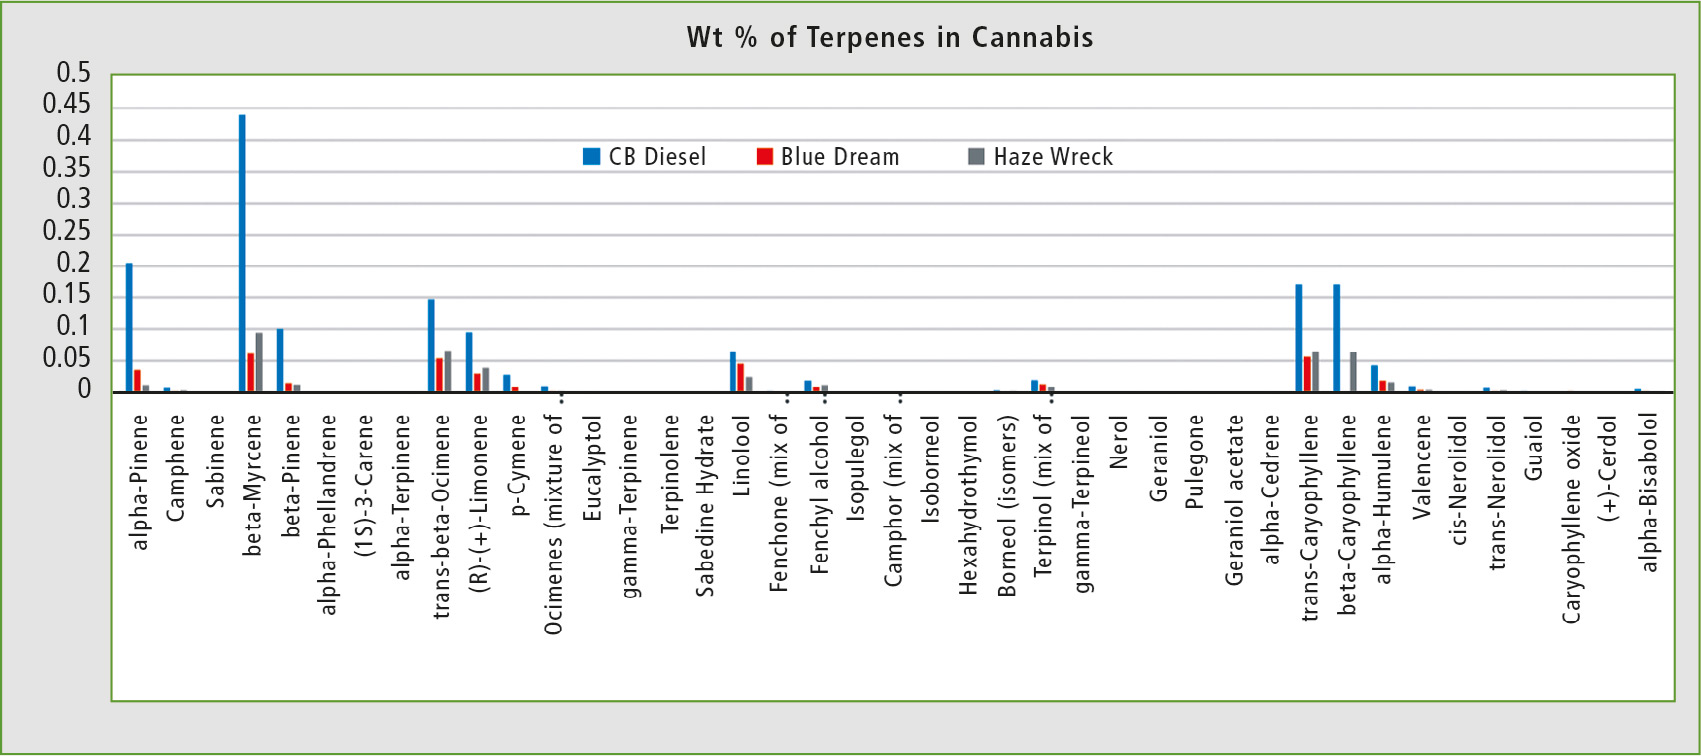 Figure 4: Terpene distribution in three different strains of cannabis: CB Diesel, Blue Dream and Haze Wreck
Pesticide screening by LC-MS-MS
Pesticides are used in commercial cannabis grow operations to kill insects and spiders that thrive on cannabis plants. Above certain levels pesticides may be carcinogenic and mutagenic, causing serious harm to consumers, especially immuno-compromised medicinal cannabis users. Sensitive and selective detection of chemical residue contamination is necessary for consumer protection. QuEChERS extraction and LC-MS analysis offer effective and efficient detection of pesticides commonly employed during cannabis cultivation.
Pesticide-free organically-grown cannabis was used for spiking studies and calibration curves. A variety of cannabis samples offered for retail sale, including cannabis concentrates, were then analyzed for pesticides.
Samples were prepared according to the QuEChERS extraction protocol (figure 5) and analyzed using a Shimadzu Prominence HPLC with LCMS-8050 triple quadrupole mass spectrometer. Electrospray ionization in continuous polarity switching mode was used for detection.
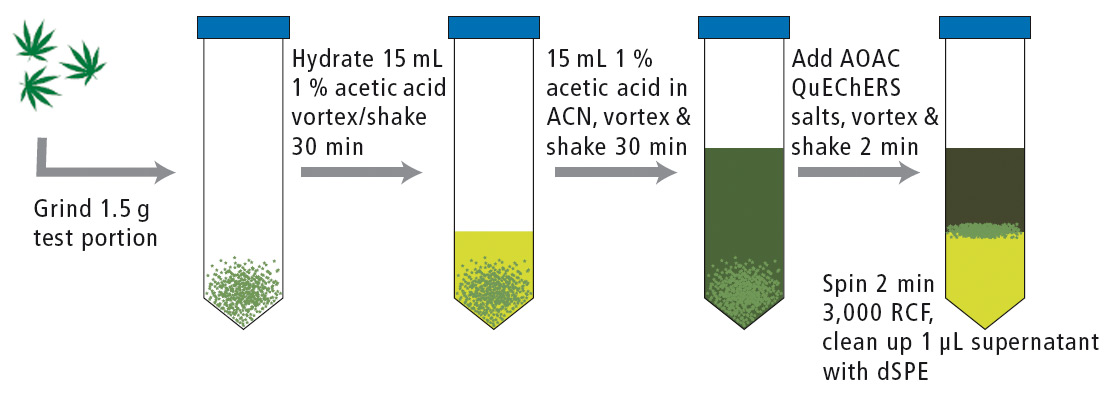 Figure 5: QuEChERS extraction of dried cannabis flower for pesticide analysis
Optimized MRM settings were used for each compound and at least one quantifier and one qualifier transition were selected. The retention times were determined and used to program the MRM segments for optimum duty cycle. Figure 6 shows a representative chromatogram of pesticide mix spiked in cannabis matrix at an intermediate level (31 ppb).
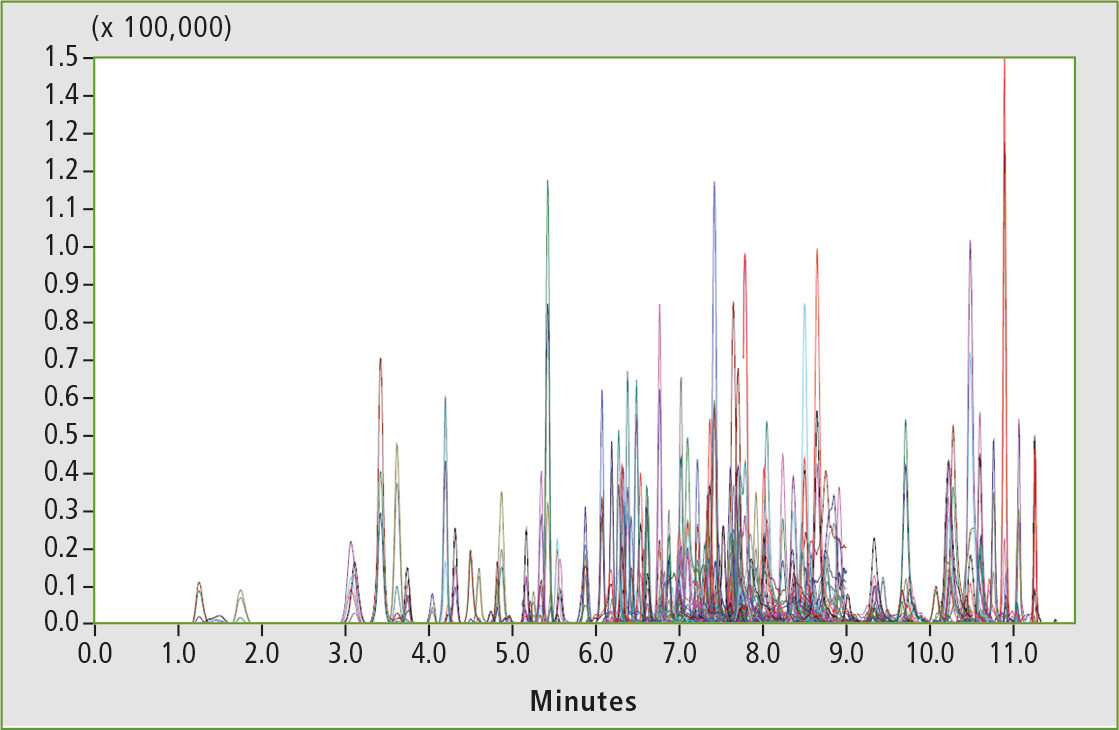 Figure 6: Representative chromatogram of pesticide mix spiked in cannabis matrix
The calibration curve was prepared in spiked matrix over the range of 20 to 2,000 ng/g dried flower weight. Limits of quantitation were determined by measuring samples in triplicate at various levels. Signal-to-noise of at least ten to one and RSD of 20 % or better were required at the limit of quantitation. In addition, reproducibility of three QC replicates in three different cannabis strains was also required to be within 20 % RSD.
The most commonly detected pesticide was piperonyl butoxide which finds wide use in pesticide formulations to enhance activity of the main ingredient. It was detected over a wide range of concentrations. Myclobutanil, an antifungal known to be used in cannabis cultivation, was detected in a number of samples as well. Among the cannabis concentrates, a high percentage tested positive for one or more pesticides.
Literature
[1] Perry G. Fine, Mark J. Rosenfeld, Rambam Maimonides Medical Journal, October 2013, Volume 4, Issue 4.
[2] Klein TW, Newton CA, Adv Exp Med Biol. 2007;601:395-413.
[3] LM Borgely, et al., “The pharmacologic and clinical effects of medical cannabis”, Pharmacote-herapy (Review) 33 (2):195-209 (February 2013).
[4] Kerstin If?and, Franjo Grotenhermen Cannabis and Cannabinoid Research Volume 2.1, 2017 DOI: 10.1089/can. 2016.0034.
[5] Giese, M.W., Lewis, M.A., Giese, L. and Smith, K.M. Development and Validation of a Reliable and Robust Method for the Analysis of Cannabinoids and Terpenes in Cannabis. Napro Research, California, 2015.
[6] Parland, J.M., and Russo, E.B. Cannabis and Cannabis Extracts: Greater than the Sum of Their Parts? The Haworth Press, Pennsylvania, 2001.
[7] E. Russo, Taming THC: Potential Cannabis Synergy and Phytocannabinoid-Terpenoid Entourage Effects, British Journal of Pharmacology 163 (2011) 1344.
[8] Chemistry and Analysis of Phytocannabinoids and Other Cannabis Constituents. Humana Press, New Jersey.
Shimadzu does not support or promote the use of its products or services in connection with illegal use, cultivation or trade of cannabis products. Shimadzu is not condoning the use of recreational nor medical marijuana, we are merely providing a market summary of the cannabis testing industry.