Olive oil is top source of vitamin E
A quantitative fluorescence analysis of tocopherols
Tocopherols are methyl-substituted chromanols with a side chain consisting of three isoprenes. The four α-, β-, γ- and δ-tocopherols differ in the number and position of the methyl groups in the phenolic part of the chroman ring. The α homologue contains three methyl groups, while the β- and the γ-homologues are dimethylated positional isomers. The δ homologue is mono methylated. These substances all exhibit vitamin E activity, but the biological potential of R,R,R-α-tocopherol clearly surpasses the other homologues with 1.49 IU/mg [1].
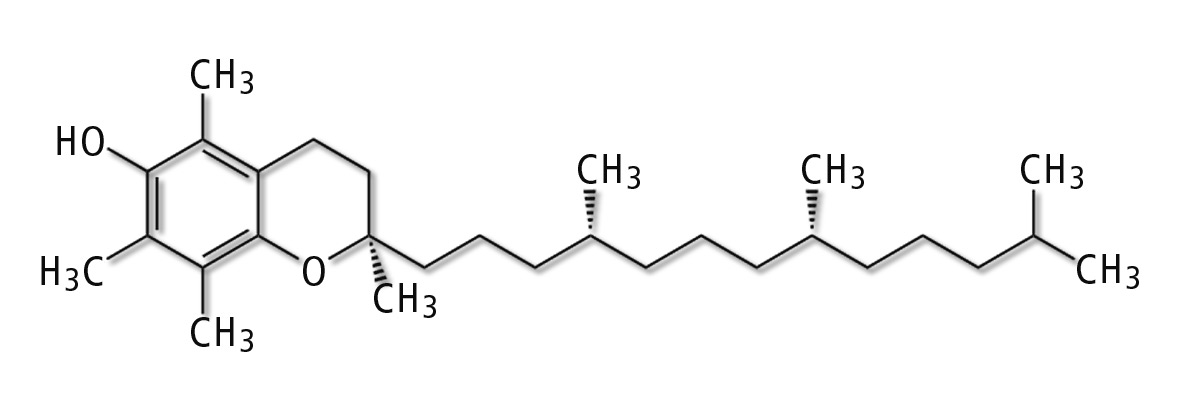 Figure 1: Chemical structure of α-tocopherol
Tocopherols are used, for example, in the food industry, because they effectively inhibit fat oxidation in food [2]. This effect is also evident in other biological systems such as the human body.
20 % of vitamin E requirements are contributed by fats and oils
The largest sources of vitamin E are vegetable oils. Based on data from the National Health and Nutrition Survey (NHAVES II), it is evident that fats and oils contribute more than 20 % to vitamin E requirements [1]. The daily dose required increases when the diet contains a large proportion of unsaturated fatty acids. For example, the necessary α-tocopherol consumption is 0.09 mg/g for monounsaturated fatty acids and 0.4-0.6 mg/g for diunsaturated fatty acids [3]. According to the National Research Council (1989), a 10 mg daily intake of vitamin E for men and 8 mg for women is recommended.
According to nutritional beliefs, extra virgin olive oil, despite its high content of monounsaturated fatty acids, is suitable for supplementing the daily vitamin E intake and for protection from vitamin E deficiency [4, 5]. Today, it is recognized worldwide as a health promoting oil, which is why extra virgin olive oil is becoming increasingly important in many countries. As a result, large volumes of oil are exported from Italy, Spain and Greece to the United States, Australia and Japan [6, 7].
High sensitivity of fluorescence spectroscopy
Fluorescence spectroscopy is very suitable for component analysis of olive oils. The method has a higher sensitivity than, for example, UV/Vis spectroscopy, since the signal-to-noise ratio is significantly higher. Also, fluorescence spectroscopy can be applied in three dimensions, which is an advantage for particularly complex compositions of samples.
In 3D fluorescence spectroscopy, the associated emission spectra are applied for a range of excitation wavelengths. Figure 2 shows a 3D spectrum of commercial olive oil. In addition to the excitation wavelength, fluorescence activities in the range of 290-340 nm, 350-450 nm and 660-680 nm are present. The emission at around 670 nm (Ex: 400 nm) is typical for chlorophyll, while the broad band between 350 nm and 450 nm is caused by polyunsaturated fatty acids and their oxidation products. The last remaining emission peak at about 320 nm is attributable to vitamin E [8].
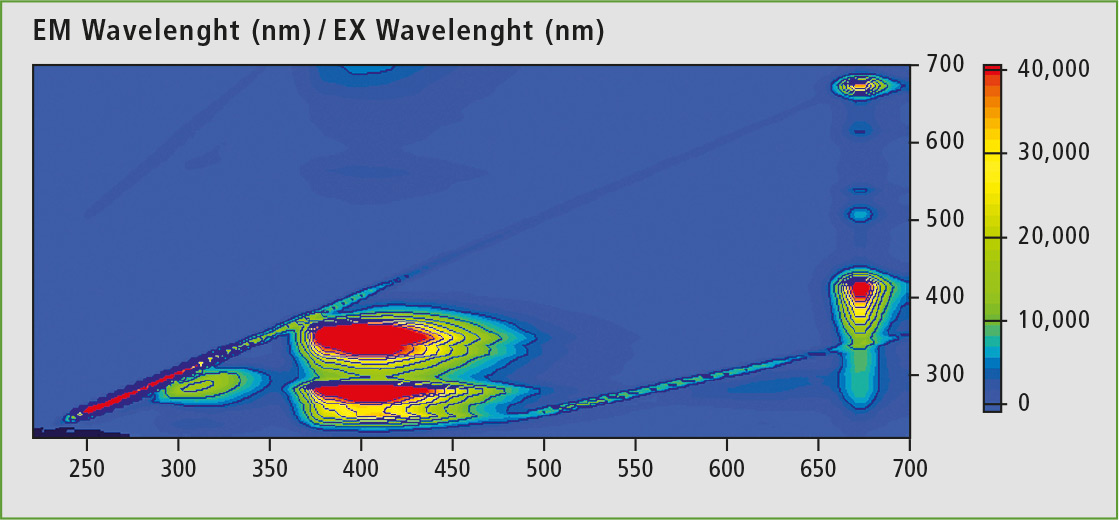 Figure 2: 3D scan of hexane diluted olive oil (1 vol.-%)
The concentration of fluorescence-active chromophores in pure olive oil is very high. In order to reduce the intensity of the fluorescence, it is possible to rotate the sample 30° or 60° to the excitation beam. In this way, the volume traversed by the excitation beam is reduced.
However, this does not affect quenching effects within the sample. In order to reduce this, olive oil is diluted with n-hexane (1 vol.-% olive oil) for measurement. This also impacts on quantification of vitamin E in olive oil, since significantly fewer matrix effects occur [4]. Figure 3 shows a comparison of the measurement of a dilute hexane solution (1 vol.-%) with a higher concentration (30 vol.-%). The spectrum of the higher concentrated oil-hexane solution (black) clearly shows the matrix, in addition to the tocopherol peak at about 320 nm, which makes it difficult to evaluate the peak area amongst others.
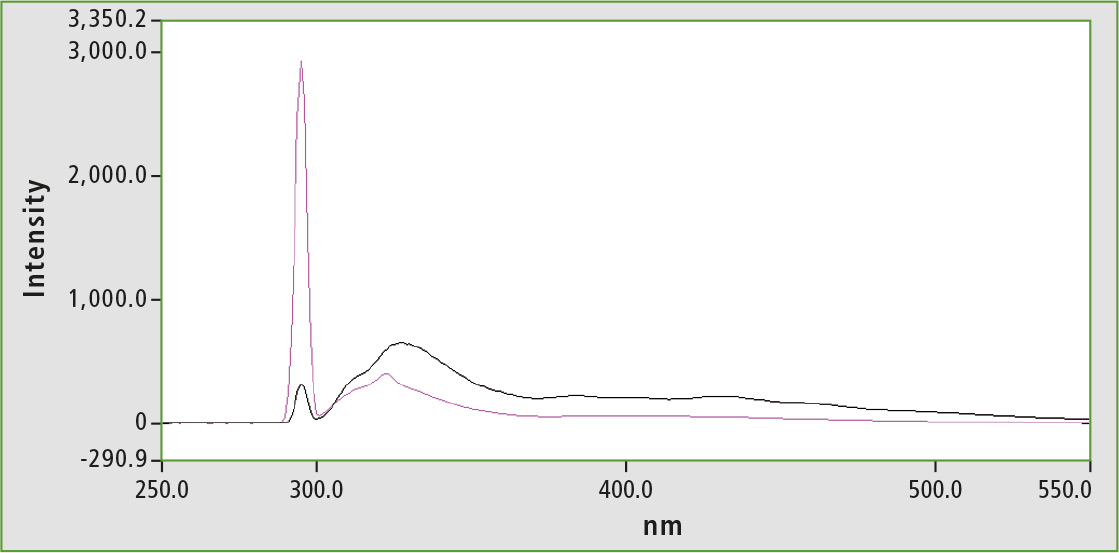 Figure 3: Range of diluted olive oil 1 % v/v, in n-hexane (purple), spectrum of diluted olive oil 30 % v/v, in n-hexane (black)
Quantitative assessment of vitamin E content
To quantify the vitamin E content in olive oil, an external calibration is performed. To test the dynamic range, calibration solutions with 0.6 – 75 ppm α-tocopherol prepared in hexane are used and measured at an excitation wavelength of 290 nm. It is noticeable that the sensitivity to the higher α-tocopherol concentrations decreases, so a calibration in the range of 1 – 20 ppm is therefore the most suitable.
All measurements were also done with the synchronous technique. Excitation and emission wavelengths were scanned, with both wavelengths at a constant distance from each other. Excitation peak in the spectrum was significantly attenuated, as well as second order light and matrix effects of the sample. This resulted in much narrower peaks. These are usually easier to evaluate, but have a lower intensity [9].
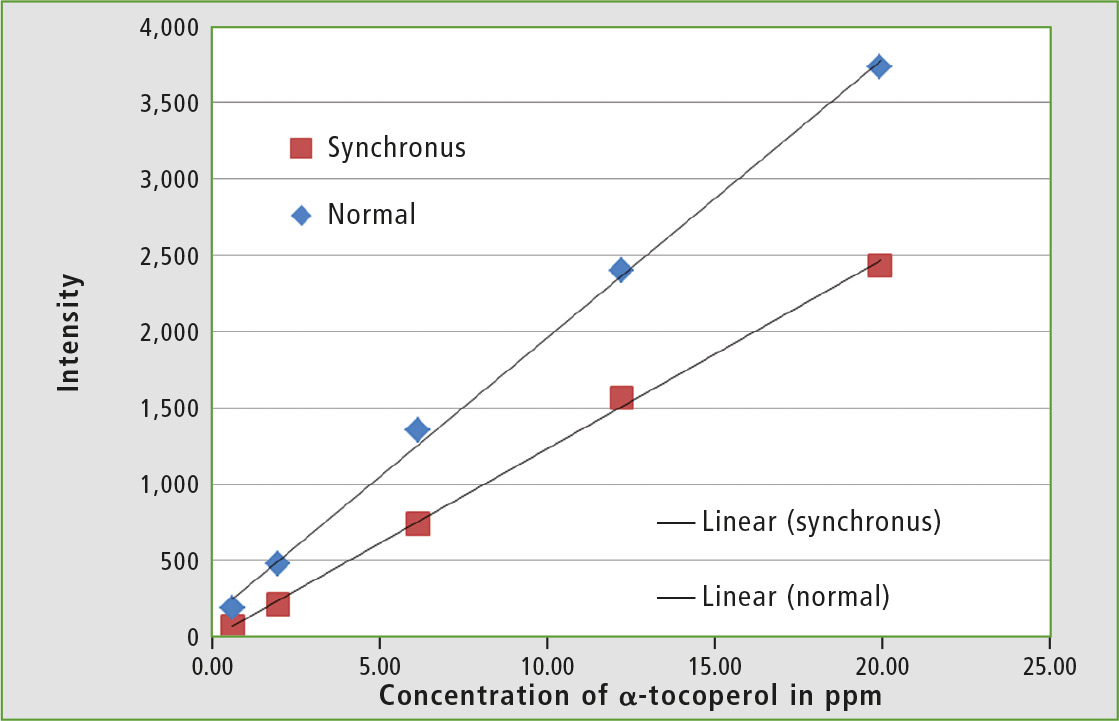 Figure 4: Calibration of α-tocopherol in hexane normal and with the synchronous technique and respective calibration lines
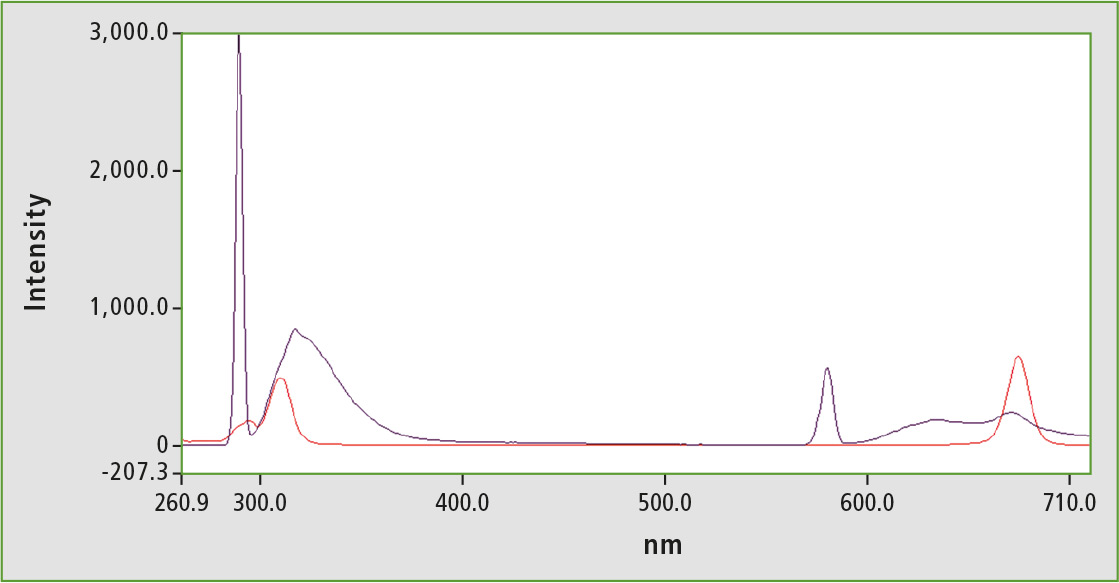 Figure 5: Fluorescence spectrum of an olive oil sample (black); Synchronous scan of an olive oil sample (red)
Normal and synchronous measurement
For testing, an olive oil-hexane solution (1 vol.-%) was measured normally and synchronously. The α-tocopherol peak is very small, so that the sample can be arranged at the lower end of the calibration line. Oil-hexane solution thus contains approximately 1-2 ppm α-tocopherol, while a slightly higher value is deduced using calibration with synchronous technology. For a reliable calibration, it is recommended to increase the proportion of olive oil in the hexane solution by a few percent. A compromise between good quantifiability and as few matrix effects as possible for the olive oil concentration has to be found.
Additionally, fluorescence spectra of hexane solutions with higher α-tocopherol concentrations have been measured in order to see how the fluorescence reacts at higher concentrations. The resulting plot of intensities versus concentration (figure 6) shows that above a concentration of 100 ppm, quenching effects occur within the sample and a linear correlation between intensity and concentration is no longer present. Therefore, it makes no sense to measure undiluted olive oil.
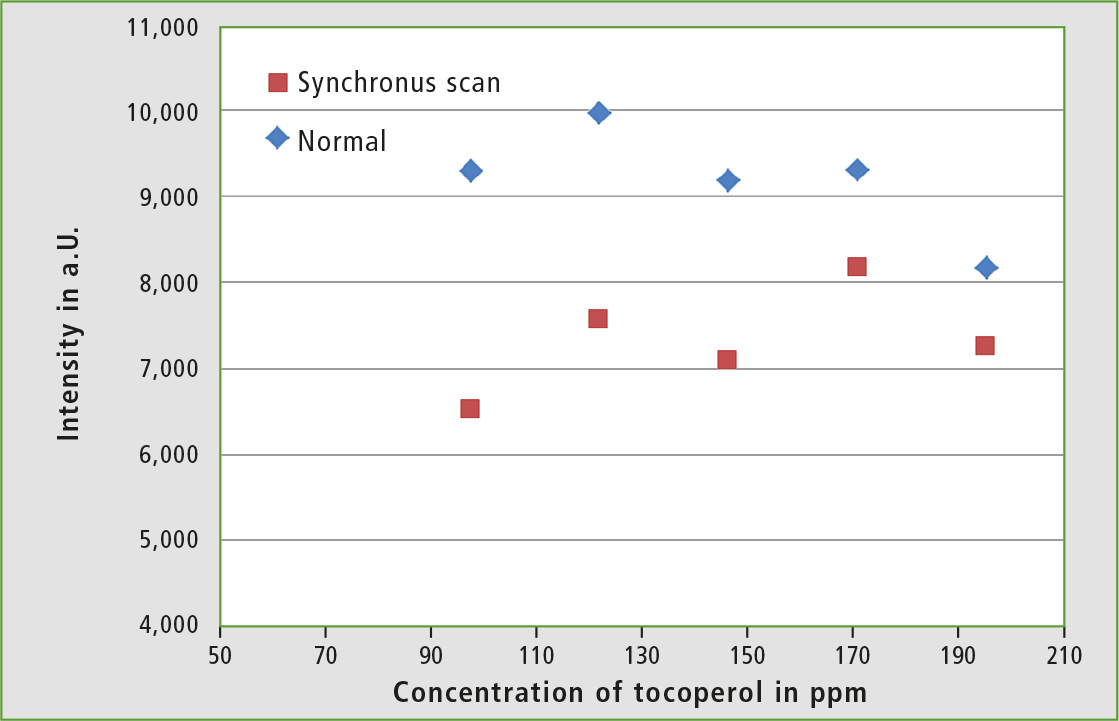 Figure 6: Calibration of an α-tocopherol-hexane solution in the range of 80-200 ppm (Ex: 290 nm)
Summary
Vitamin E is a quality feature of olive oil, but quantification by fluorescence spectroscopy is challenging. In general, sufficient dilution of the olive oil with hexane to minimize quenching within the sample and to ensure system calibratability is necessary. However, the sample should only be diluted to the extent that the α-tocopherol concentration is still approximately 10 – 15 ppm. For samples with a high amount of matrix, it may be useful to measure the fluorescence in synchronous mode, as it minimizes interfering effects.
Authors
Aurelia Bertini, Hochschule Niederrhein
Manos Barbounis, Asteriadis S.A.
Vassilis N. Kamvissis, Sevitel
Literature
[1] Eitenmiller, R.R.; Landen, WO, Jr. Vitamin E. Tocopherols and tocotrienols. In Vitamin Analysis for the Health and Food Sciences; CRC Press: Boca Raton, FL, 1999; p 109.
[2] Kamal-Eldin, A; Andersson, R. A multivariate study of the correlation between tocopherol content and fatty acid composition in vegetable oils. J. Am. Oil Chem. Soc. 1997, 74, pp. 375-380.
[3] Belitz, HD; Grosch, W. Food Chemistry, 2nd Ed.; Spinger publishing house: Berlin, Germany, 1999.
[4] Kafatos, A; Comas, G. Biological effects of olive oil on human health. In Olive Oil; Kiritsakis, AK, Ed.; American Oil Chemists’ Society: Champaign, Il, 1990; Chapter 17, pp. 157-181.
[5] Lenart, EB; Willet, WC; Kiritsakis, AK. Nutritional and Health aspects of olive oil. In Olive Oil Kiritsakis AK Ed: Food and Nutrition Press: Trumbull CT, 1998; Chapter 16, pp. 299-322.
[6] Petrakis, C. Good Manufacturing Practice (GMP) guidelines for virgin olive oil production. Grasas Aceities 1994, 45, pp. 53-54.
[7] Eleni Psomiadou, Maria Tsimidou, Dimitrios Boskou, a-tocopherol Content of Greek Virgin Olive oils, J. Agric. Food Chem., 2000, 48 (5), pp. 1770-1775.
[8] Kyriakidis & Skarkalis: Journal of AOAC Internattional Vol. 83, No. 6, 2000.
[9] Sikorska E., Khmelinskii I., Sikorski M., Analysis of Olive Oils by Fluorescence Spectroscopy: Methods and Applications, InTech (2012).