Preparative LC and LCMS
Preparative LC as well as the combination of preparative LC with MS detection is used in several steps in drug development.
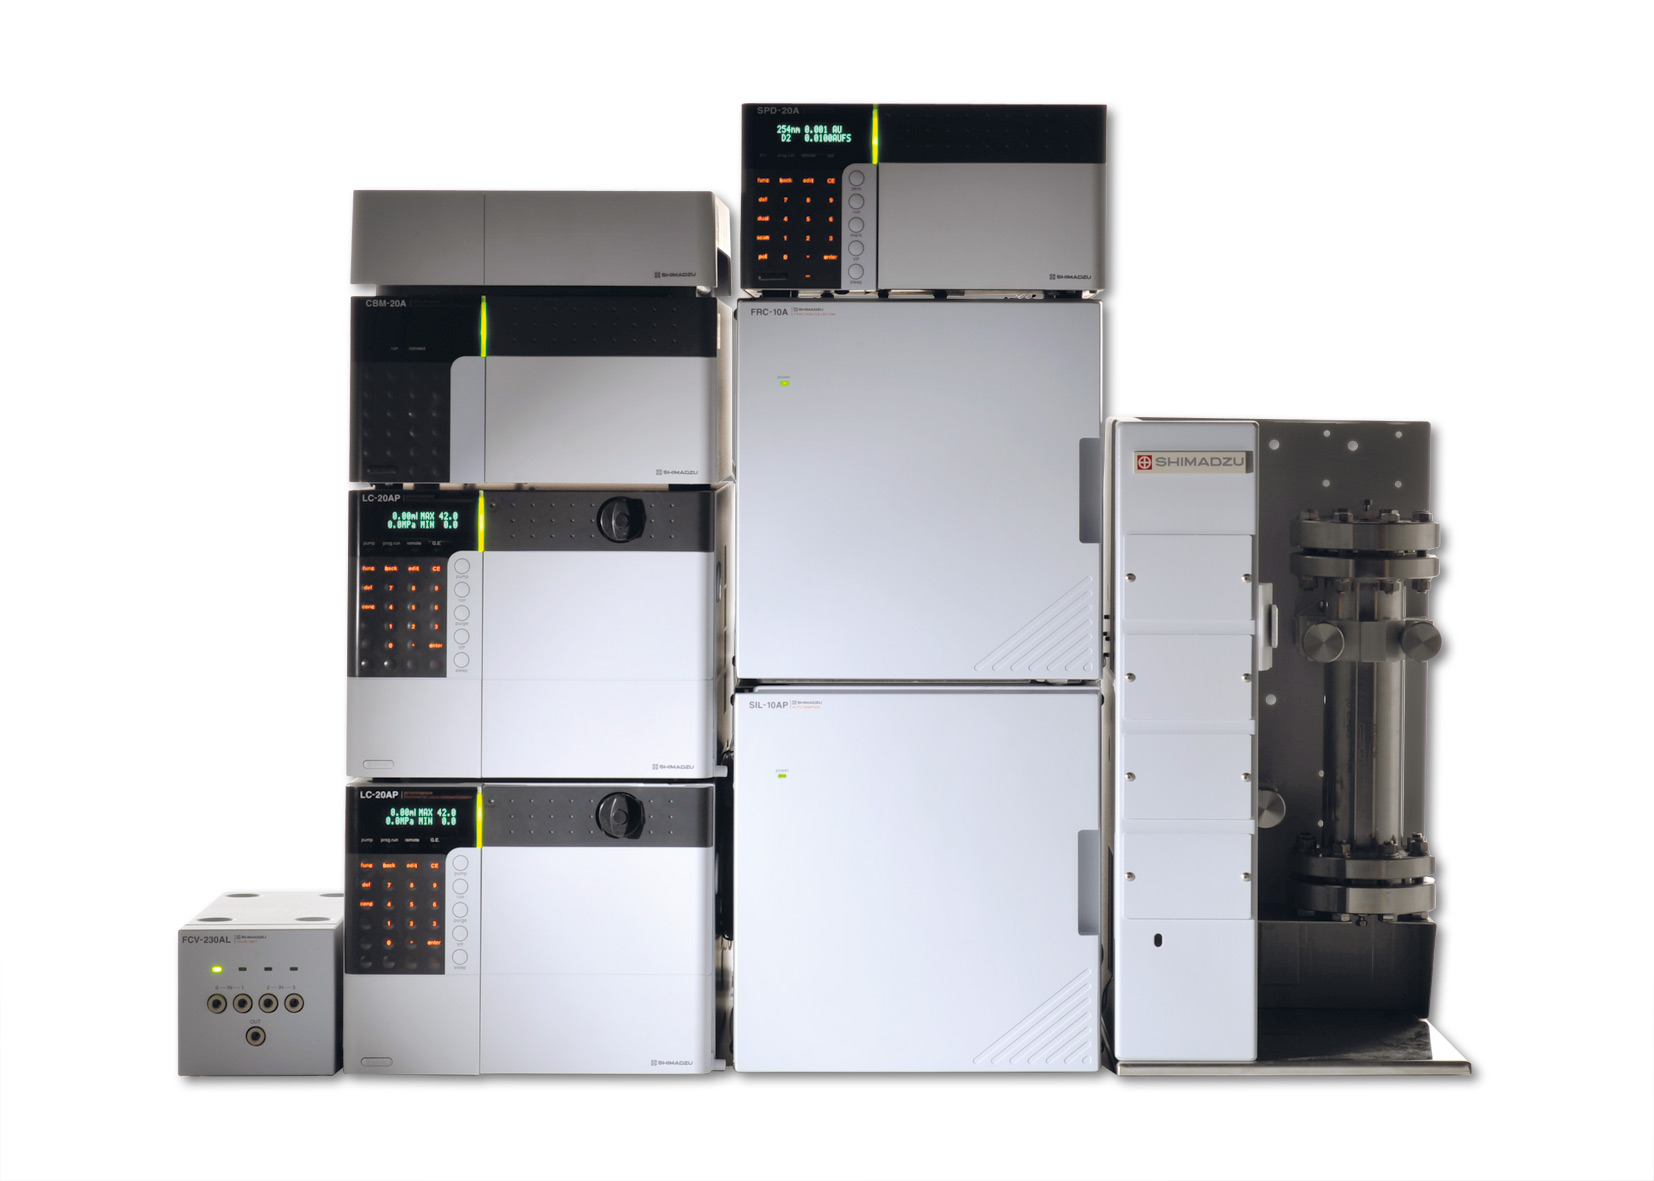 Figure 1: Preparative LC systems with automatic sample injection and fraction collection
A preparative system can be used to recover high purity components from some types of liquid extract obtained either from a synthesis reaction or from a natural substance by separating and purifying the target compounds. Obtaining these target compounds at high purity enables their structural analysis, permitting evaluation and analysis of their various functions while allowing their subsequent processing to be conducted more reliably. Since a preparative system must separate the target components from the coexisting substances in a sample, the basic system configuration comprises of solvent delivery pumps, sample injector, column and detector, as in a typical LC system. Additional is a mechanism for collecting fractions consisting of the target substances, thereby completing the basic configuration of a preparative system.
Efficient collection of target compounds is key
The objectives of a typical LC system are to conduct quantitative and qualitative analysis, but a preparative system is used more for so-called “pretreatment” with the objective of actually obtaining the necessary compounds for evaluation and analysis, as well as for subsequent processing. It is therefore important that target compounds are obtained quickly and at high purity. Just as with a typical pretreatment process, productivity is the key point in a preparative system. To ensure that the intended evaluation and analysis operations can be started as soon as possible following the preparative process to achieve the highest possible productivity, an appropriate system should be able to separate the quantity of compounds and integrate a detection principle that can most effectively ensure collection of the all possible target compounds.
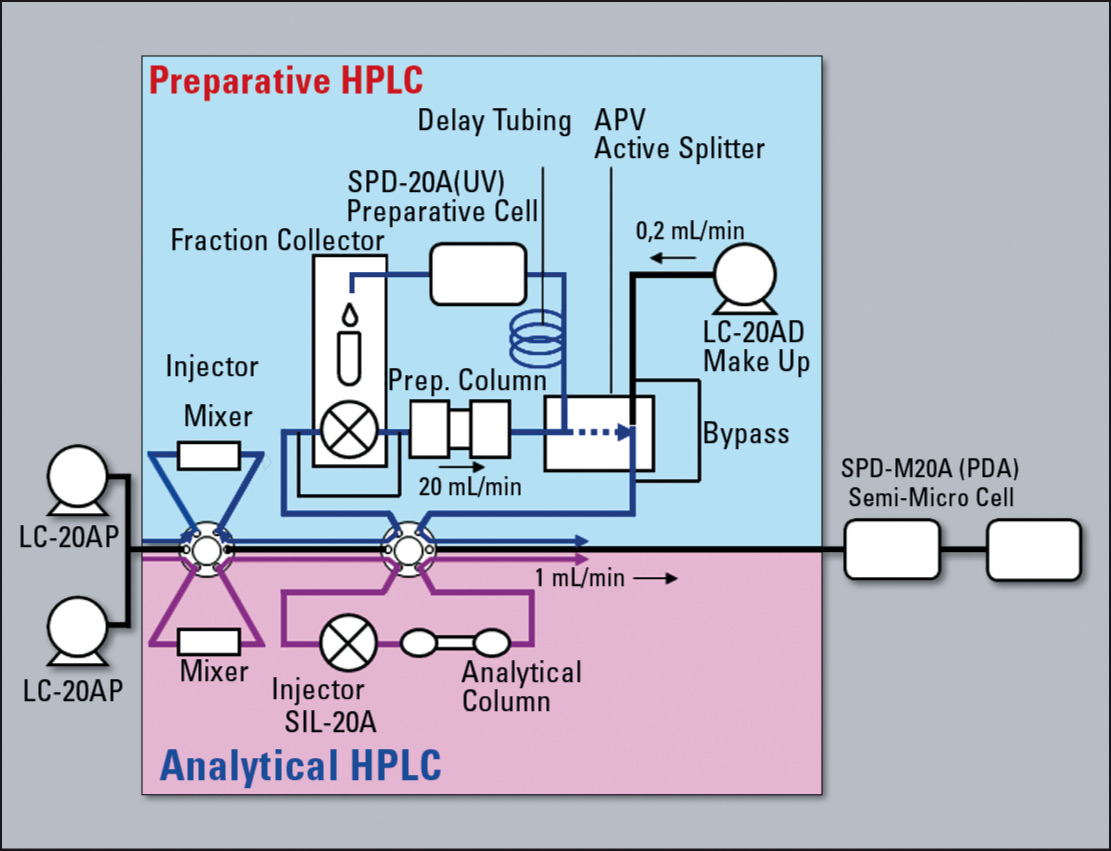 Figure 3: Configuration schema of prep LCMS system
What is the optimal detector?
Most simple solutions are based on UV detectors (ideally multi-wavelength or photo diode array). If the target compound or the coexisting impurities in the sample solvent have no optical absorbance, detectors based on principles other than optical absorbance detection such as ELSD (evaporative light scattering detector) and MS (mass spectrometer) can be used as supplementary detectors to improve purification efficiency, thereby improving productivity.
Since ELSD and MS detectors rely in principle on nebulization of the column eluate inside the detector, the target substances emerging from these detectors cannot be recovered. To resolve this problem, most of the column eluate is directed to the fraction collector, and the remaining micro volume is introduced into the ELSD or MS. To accomplish this, an active APV splitter (Automated Proportioning Valve) is used to split the flow line. In addition, if the volume of eluate to be introduced into the ELSD or MS detector is ultra small, a make-up pump is used to augment the mobile phase flow and maintain steady detection by the ELSD or MS.
Determination of the optimum preparative system
Once the total amount of fraction necessary for evaluation and analysis of the target compounds and subsequent processing is calculated and the detector has been selected, the next step is to determine what scale of fractionation is required. The amount of sample that can be injected at one time (load with respect to column) to maximize productivity must also be determined. Once the maximum sample injection volume is known, the number of required fractionation runs can be calculated based on the target fraction quantity. This allows determination of the optimum preparative system based on time (total time to collect the required fraction) and cost (purchase price of preparative system and column, and solvent expense). This type of examination can be conducted efficiently by first using a general purpose LC (conventional LC).
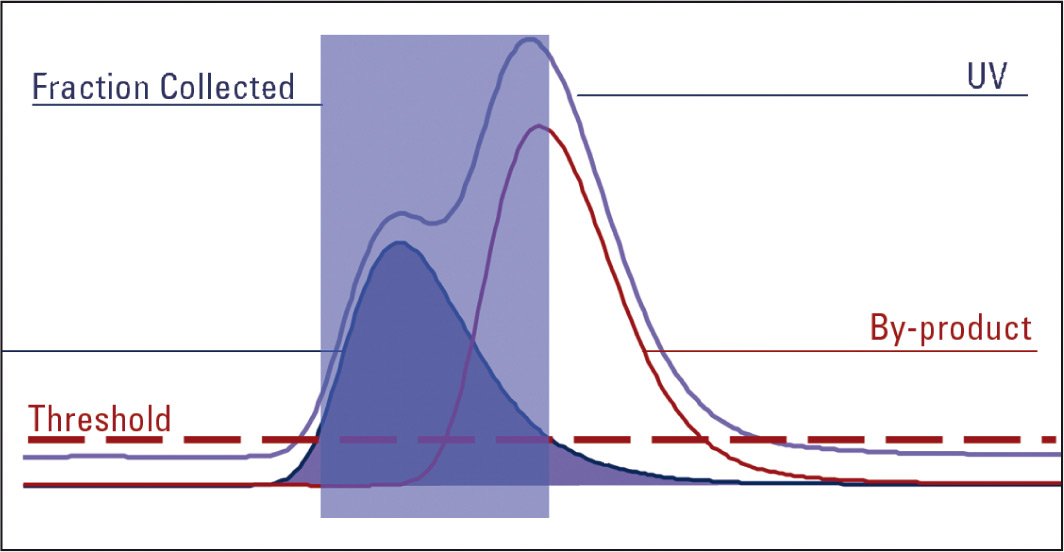 Figure 4: Fraction tiggered by MS only
When an UV trace is used to trigger fractions and both slope and threshold are triggered, the inflection in the UV trace is detected where the by-product starts to elute and the fraction tube being collected to is automatically changed.
The same amount of fraction is still collected but this time into two tubes. The first tube contains the pure target product. Therefore purification has been achieved.
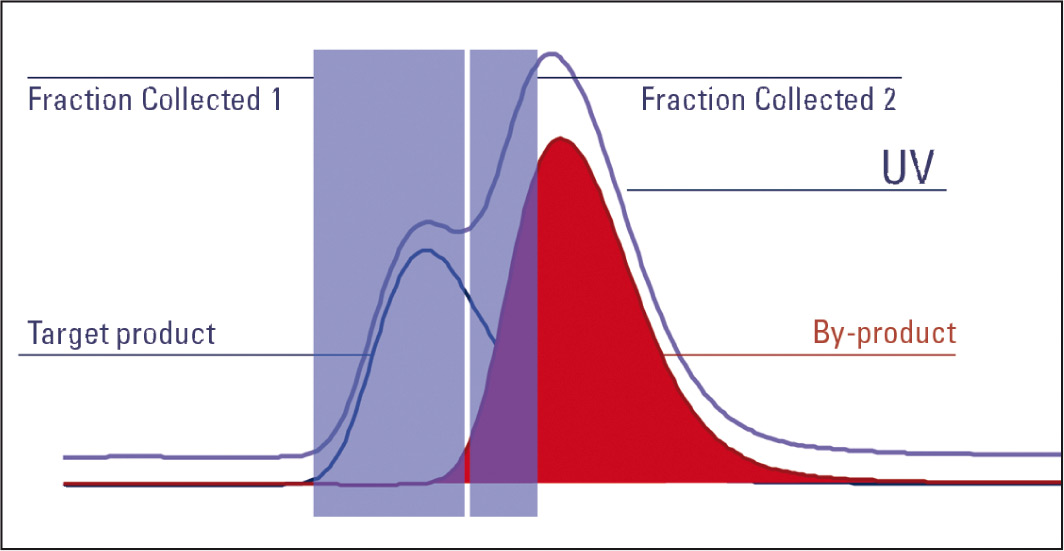 Figure 5: Fraction tiggered by combination UV and MS signal
With MS, only a specific product can be targeted. In order to trigger a fraction on the target product the trace for target product ions m/z is extracted and the collection of fractions using this single mass’s trace is triggered. Co-eluting substances may also be present. Therefore, with a partial co-elution the target product continues to collect although the by-product has started to elute. This leads to contamination of the target product’s fraction with the by-product. Purification has therefore not been achieved.
It is recommended that the triggering option for the UV trace be set to slope due to the excellent peak shape achieved by the UV detector; the MS should trigger on an intensity threshold since the MS only considers the target ion and is very sensitive. The AND logic is used to combine the two triggers i.e., both the MS and UV trace must trigger together for the fraction to be collected. This enables narrowing the collection down to the product of interest, reducing fraction width and therefore helping to remove the problem of contamination from other products eluting close to the product of interest. Combining the power of slope and threshold along with the MS and UV trace both being considered, a target compound can be isolated even in a complex mixture with many products eluting close to each other.
If the concentration of the fractionation target compound in the sample is known, the absolute injection quantity of the fractionation target compound can be obtained from this concentration and the sample injection volume. To efficiently use the preparative LCMS for fractionation – Mass Directed Purification signals from UV detector as well as m/z values obtained with the LCMS are applied. The following example (see box below) shows the advantage of combining both signals.
Transfer analytical condition and separation to preparative scale
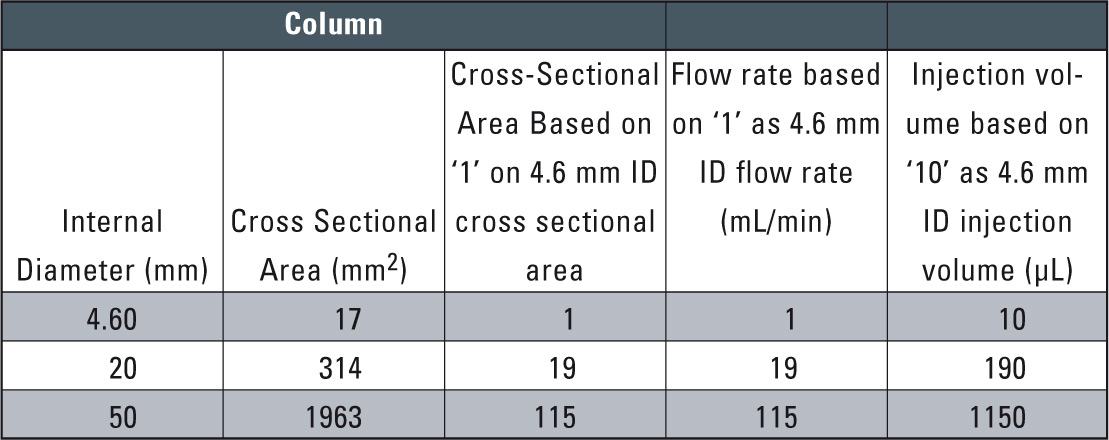 Table 1: Relationship between Column Cross-sectional area and Flow rate / Injection volume (out of Technical Report 31)
After examining conventional-size column conditions, the next step is to scale up from analysis to preparative level. To smoothen this transition, a preparative column is selected using the same packing material as in the analytical column. With the same packing material, the mobile phase flow rate and sample injection volume need only be increased according to the analytical column and preparative column cross-sectional area ratio to obtain nearly the same chromatographic pattern (see table 1).
An example in which the scale-up was conducted using the same packing material is shown in figure 6. Here, the 4.6 mm I.D. column used for the analytical scale was exchanged with 20 mm I.D. column for the preparative scale. Since the cross-sectional area of the 20 mm I.D. column is about 19 times that of the 4.6 mm I.D. column, the solvent delivery flow rate was scaled up from 0.8 mL/min to 15 mL/min, while the sample injection volume was scaled up from 50 µL to 1 mL. As a result, nearly equivalent chromatographic patterns were obtained.
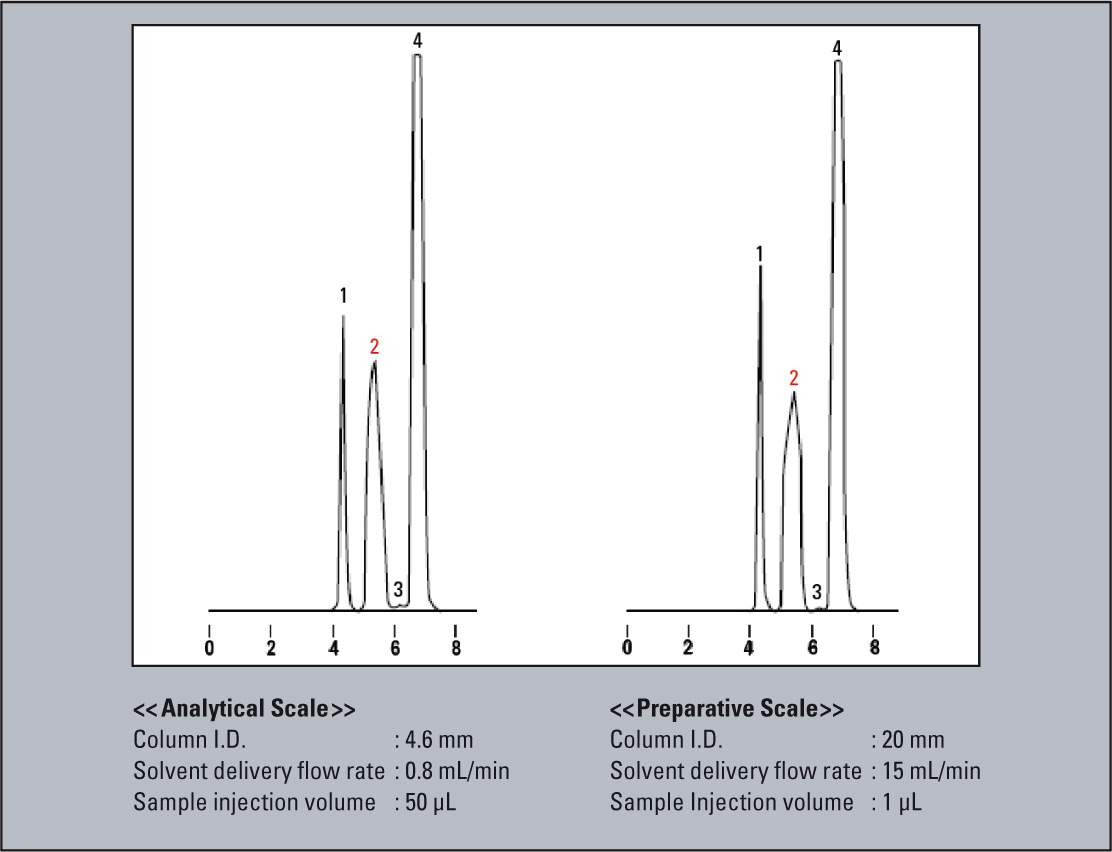 Figure 6: Example for scale-up
At this point, further handling of the fractionated compounds usually determines the next steps. If the target purity is not achieved because of insufficient separation, the sample injection volume and column length etc. must be reexamined. The same applies with gradient conditions.
If high sensitivity is required while using a small injection volume in this purity confirmation analysis, the usage of an analytical system for verification rather than a preparative system is suitable.
These reprocessing steps are closely related to easy-to-use software to provide a fast overview of the results.
Open Solution software
There is a growing demand for multifunctional software that can be used to set conditions and perform high-level analysis in an easy and intuitive way. But, what would be the ideal software which could easily be used by anyone? From the view of day-to-day operations, access to the internet is meanwhile considered as essential to communicate by e-mail and to access readily available web-based information.
If this effortless Internet Explorer could be used for LC and LC/MS analysis, a reduction or even elimination of the cost of training to impart the expertise for software operation could be avoided. Furthermore, there would be no need for software licensing for each PC or user, thereby reducing even further the overall costs associated with analysis related operations.
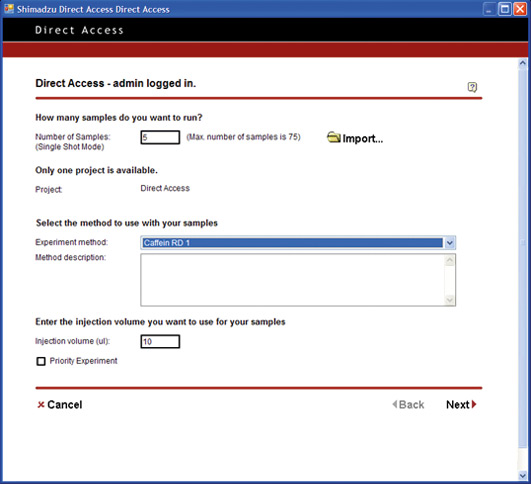
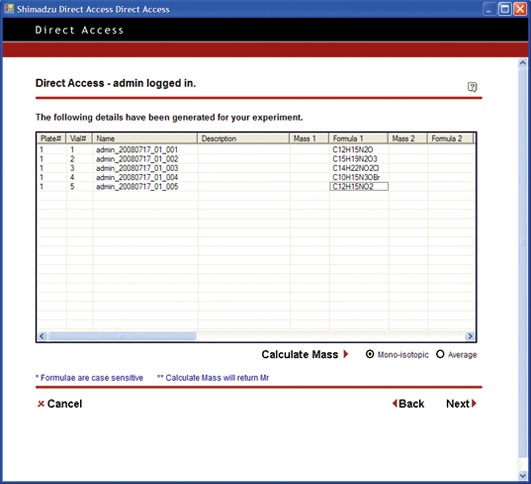
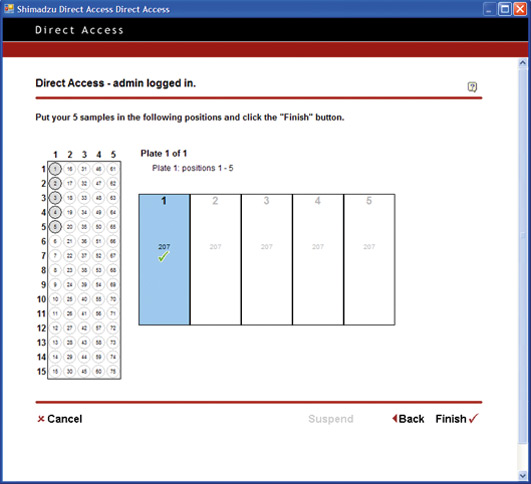 Figure 8: Open Solutions – How to setup samples for analysis
Might it be possible to use Internet Explorer for LC and LC/MS analysis?
At this time, there is probably a small advantage to be gained by running the currently used LC and LC/MS software in their current states under the Internet Explorer environment, since the software operations would remain basically unchanged. In general, the following criteria would need to be satisfied for Internet Explorer to be effectively employed for controlling analysis: the ability to
- construct an open access environment
- display sufficient information in the Internet Explorer window
- output information in printed as well as electronic format (PDF output) Note 1.
Once these problems are resolved, analysis using Internet Explorer will become a reality. Furthermore, since Open Solution runs only on the PC that is directly connected to the analytical instrument, it can also run in stand alone mode, so any future lab network construction could be accomplished without wasting past investments.
 Figure 7: Website Shimadzu (Internet Explorer)
A true open-access environment
The ability to construct an open access environment within the Internet Explorer environment, as indicated above, is critical. “Open access” refers to access by whoever, whenever, wherever, with respect to any data, and for whatever reason, while satisfying a given set of security conditions. The possibilities become greatly extended if this open access environment is achieved using an Ethernet network, as this overcomes positional and geographical restrictions to allow information sharing from any PC on the network. This defines a true open access environment.
Open Solution is a newly developed software application which achieves this open access environment.
Open Solution is a software enabling control of the Shimadzu high performance liquid chromatograph prominence and the ultra high performance liquid chromatograph (Nexera and prominence XR), in addition to the LCMS-2020 mass spectrometer – not through direct operation of their control software, but via open access.
Open Solution utilizes the Internet Explorer, thereby eliminating both the need to install special software on every PC terminal and the requirement for additional software licenses. By simply installing Open Solution on the PC directly connected to the analytical instrument, operations such as viewing analysis results and outputting reports can be conducted from any PC on the network.
Open Solution pushes the limit
Elimination of every unnecessary mouse click is a wish shared by all lab personnel. Analysts believe, correctly, that their job is to conduct analysis and not operate instruments. There is justifiable frustration with the complicated PC operations which actually impede the efficiency with which analysis might otherwise be conducted.
Open Solution pushes the limit to achieve a simplified level of PC operation. From login to analysis start, the process is reduced to a level equivalent to operating a simple lab device such as a pH meter or electronic balance. The PC operations are reduced to One-Two-Three: (Step 1) Log in / (Step 2) Specify number of vials, and set vials in place / (Step 3) Start.
The rest can be left to the instrument. The analysis may even be completed by the time the analyst returns to the office.
In addition to simplifying PC operation to the greatest extent possible, the ease with which analysis results can be checked is also important to increase analysis throughput. Since analysis results are displayed in the Internet Explorer window when using Open Solution, the information to be displayed can be limited to the minimum required without performing complicated operations.
The information in this window is organized in a simple, easy-to-understand manner. For example, the sample rack and loaded vials are displayed graphically, so a quick glance allows a comparison of the samples (vials) with the analysis results. The window layout can of course be changed to suit individual preferences (see figure 9 and 10).
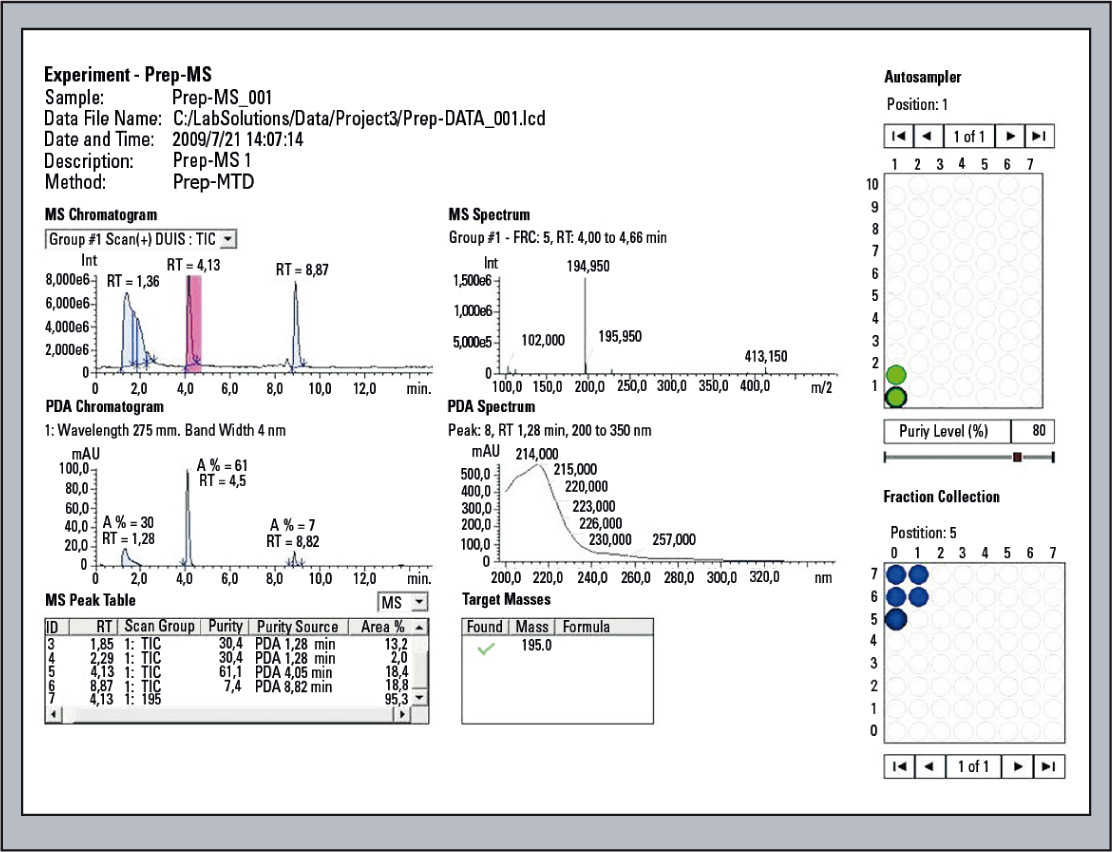 Figure 9: Display of the Analysis results with Open Solution
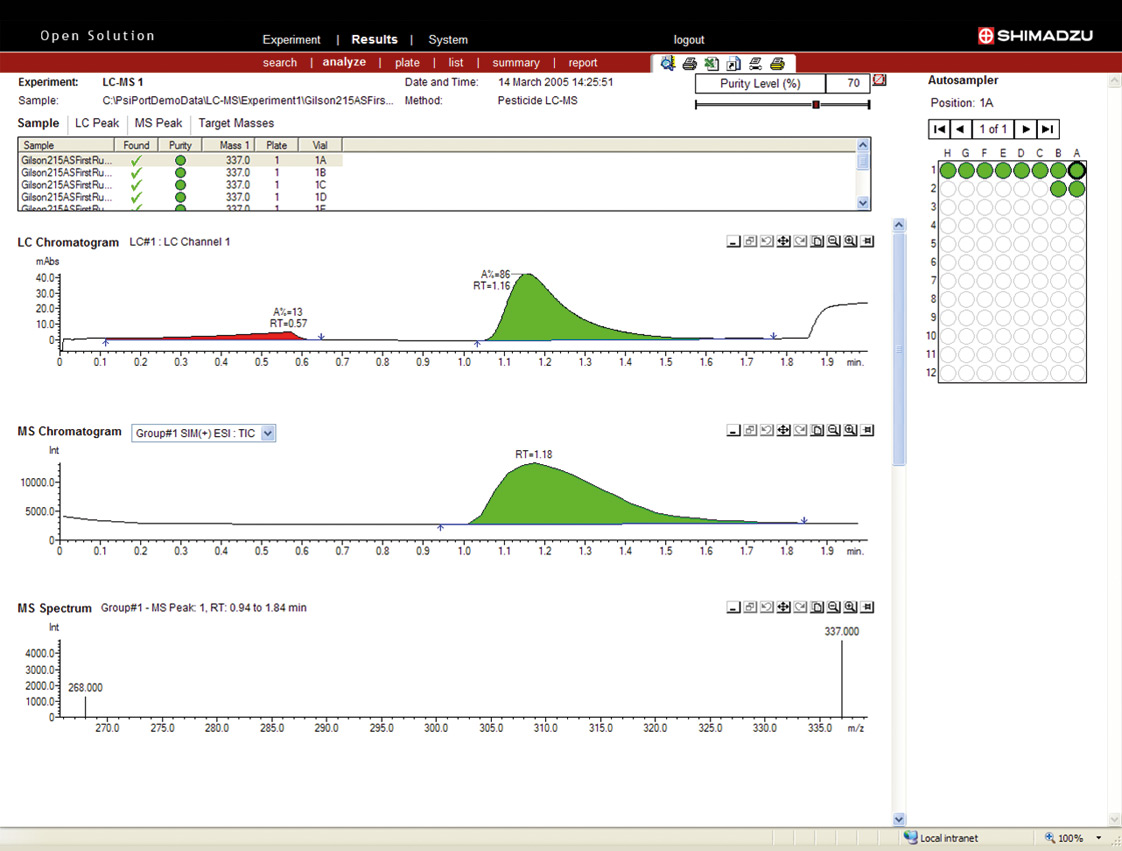 Figure 10: Peak purity analysis
Moreover, when outputting the analysis results, the information displayed in this window can be printed and outputted easily in a predefined format.
The ability to perform these operations from any PC on the network is certainly one of the big advantages of open access.
Ease of data retrieval is also important for improving analysis throughput. Where data from a previous analysis is required for verification of suitability of conditions in the current analysis, this data may be located among huge amounts of analysis data. The time needed to retrieve this data may counterbalance any time benefit achieved up to then.
Hyperlink function for high-speed access to analysis results
In such situations, the Windows search function would typically be used, but this may be very time consuming depending on the file structure and other factors. Open Solution addresses this limitation using the hyperlink function to achieve high-speed access to analysis results. For example, an e-mail message is generated and transmitted to inform that an analysis is complete, and the URL specifying the location of the stored results is included. Just clicking on the URL hyperlink will display the analysis results in the Internet Explorer window. Furthermore, by clicking on a vial in the sample rack diagram, the display switches to the analysis results obtained from that sample. In this way, the analysis results obtained from another vial in the same rack can also be viewed instantly.
Open Solution supports prominence / Nexera system configurations including the pumps, autosampler, column oven and all detectors, and because of this supports measurement using multiple detectors simultaneously. Furthermore, rather than just a single system, multiple systems can be used in the open access environment provided by Open Solution. If collective data management is also required, use of a server PC is supported.
Open Solution provides an open access environment
Open Solution can effectively fill the requirements of a preparative LC or preparative LC/MS open access environment. In the case of LC/MS, for example, the mass of a target compound can be used to obtain a purity fraction higher than possible with a UV detector, but the seamless synchronization of the LC/MS and fraction collector provided with Open Solution allows fractions to be easily verified and reliably collected at very high speed. As described above, there are great advantages to be realized in an open access system comprising a closed network in a laboratory that is linked to an open network in a separate office environment. The introduction of Open Solution provides an open access environment which can be utilized to its maximum to achieve great efficiencies in LC and LC/MS analysis in the analytical laboratory.
Remark
Further information can be found in technical reports No. 29 (Open Solution: Open Access Environment by Web Browser) and 31 Basic techniques of preparative Liquid Chromatography and Apporaches to Efficency Improvement (1)