Analysis and evaluation of chiral drugs in biological samples
Nexera UC-MS/MS for highly sensitive SFC analysis
Projects in drug discovery and safety are constantly aiming at the development of novel and safer drugs, therapeutics and diagnostics. During API (active pharmaceutical ingredient) development, drug stereoisomerism is recognized as an issue having clinical and regulatory implications.
Enantiomers have essentially identical physical and chemical properties, while potentially showing large differences in toxicity.
Stereoisomeric composition of a drug with a chiral center should therefore be well documented. To evaluate the pharmacokinetics of a single enantiomer or any mixture of enantiomers, manufacturers must develop quantitative assays for individual enantiomers early in the drug development stage.
One of the challenges of chiral separations is the fact that enantiomers exhibit the same physical and chemical properties, so they can only be separated in a chiral environment.
For chromatographic separations chiral stationary phases are available that enable the separation of stereoisomers. In order to determine the stationary phase that offers optimum selectivity for the chiral separation problem at hand, screening runs are usually performed, testing several chiral columns at a time. Normal phase HPLC is often the method of choice, however, SFC has frequently been proven to be the superior method for the separation of chiral compounds.
This article presents an example of the selectivity and sensitivity of drug level monitoring in a biological sample and the evaluation results of the analytical method as an application to pharmacokinetics research of chiral drugs using SFC-MS/MS, after having selected an appropriate column.
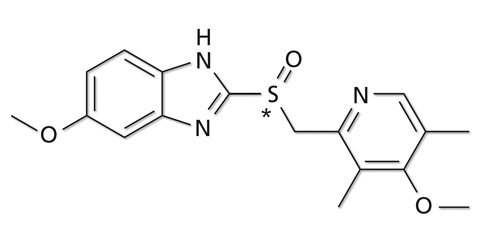 Figure 1: Structure and chiral center of omeprazole
Analysis of omeprazole in a plasma sample
The applicability of human plasma matrix to SFC was evaluated using the enantiomeric drug omeprazole, a well-known proton pump inhibitor, as an example. Figure 1 shows the chemical structure of omeprazole. For the preparation of a blood plasma sample, 20 µl of plasma were mixed with 250 µl of acetonitrile for protein precipitation. The supernatant was mixed with acetonitrile and alkalized with 28 % aqueous ammonia. Three µl of the resulting sample solution were injected for analysis. The analytical conditions for SFC-MS/MS analysis are displayed in table 1.
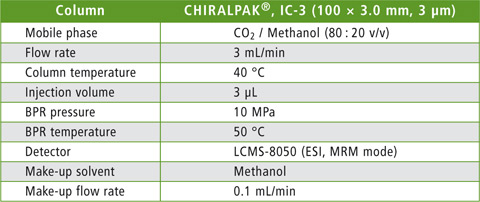 Table 1: Analytical conditions
Daicel’s CHIRALPAK® IC-3 analytical column was identified as the most appropriate separation column in an initial column screening. Detection was performed using the Shimadzu LCMS-8050 triple quadrupole mass spectrometer.
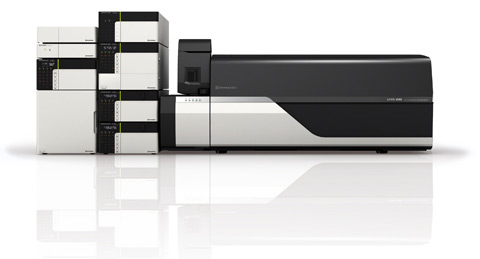 Figure 2: Nexera UC SFC-MS system
A calibration curve was created using human plasma samples containing 1, 2, 10, 20 and 100 µg/L of omeprazole standard. Figure 3 shows the MRM chromatograms of the samples spiked with 2 µg/L and 20 µg/L respectively, and the two omeprazole enantiomers (A) and (B) are well separated. Linearity of the calibration was R2 > 0.99 for both isomers.
The method produced good repeatability tested by five injections of the 2 µg/L sample with RSD values of peak area of 4.4 % for both omeprazole (A) and (B). Recovery was determined from a 10 µg/L sample compared to analysis of stock solution. Recovery rates of 101.1 % and 100.5 % respectively were obtained.
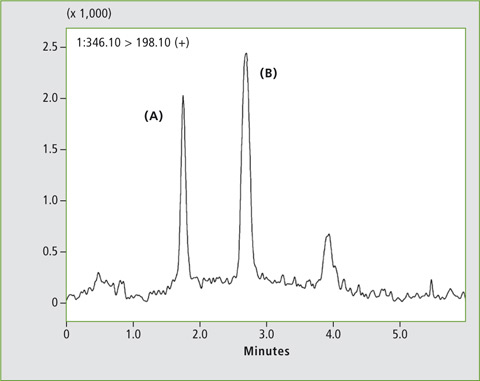
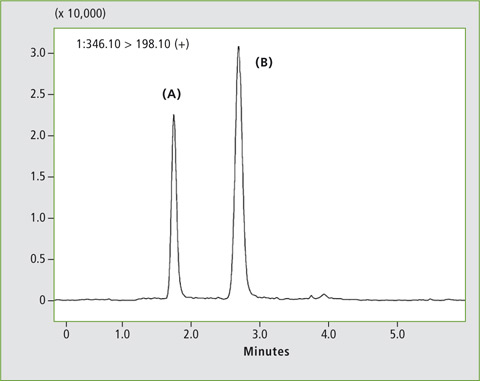 Figure 3: Chromatogram of a plasma sample spiked with a) 2 µg/L and b) 20 µg/L omeprazole, analysed with the Nexera UC LC/SFC switching system
Analysis of rabeprazole in a plasma sample
Rabeprazole, known as a gastric acid secretion inhibitor, has a similar chemical structure to omeprazole, suggesting the possibility of successful chiral separation under similar analytical conditions. Rabeprazole was therefore analyzed in a plasma sample using the same analytical conditions as described for omeprazole in the previous section. The chemical structure of rabeprazole is shown in figure 4, where the structural similarity to omeprazole can easily be recognized.
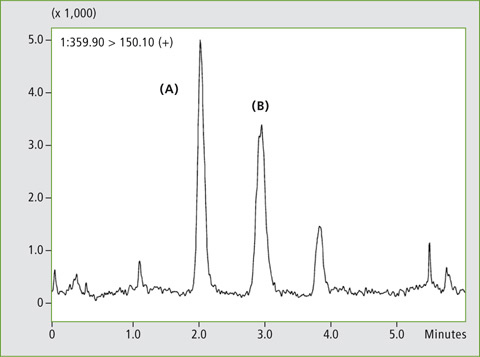
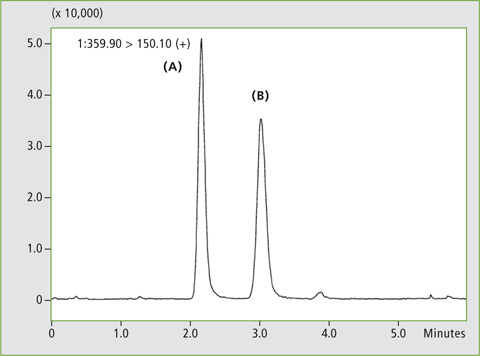 Figure 4: Chromatogram of a plasma sample spiked with a) 3 µg/L and b) 30 µg/L rabeprazole, analysed with the Nexera UC LC/SFC switching system
A calibration curve was generated using human plasma samples containing 0.3, 1, 3, 10 and 30 µg/L of rabeprazole standard. Figure 5 shows MRM chromatograms of the samples spiked with 3 µg/L and 30 µg/L respectively. The two rabeprazole enantiomers (A) and (B) are well separated. Linearity of the calibration was R2 > 0.99 for both isomers.
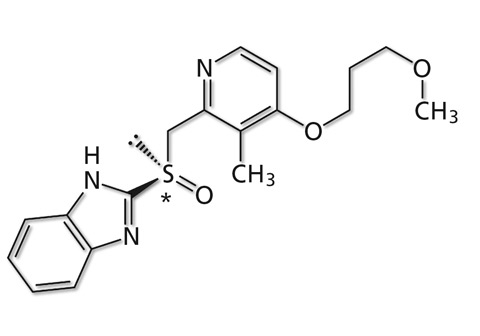 Figure 5: Structure and chiral center of rabeprazole
The method achieved good repeatability tested by five injections of the 10 µg/L sample with RSD values of peak area of 1.8 % and 2.4 for rabeprazole (A) and (B) respectively. Recovery was compared to analysis of stock solution as 102.5 % and 100.1 %. Table 2 summarizes the linearity, peak area repeatability and recovery rate for each compound. These results verify the applicability of this method to the practical analysis of plasma samples.
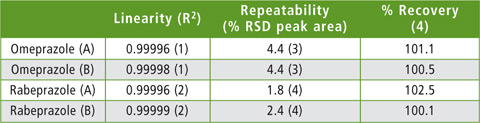 Table 2: Results for linearity, repeatability and recovery rate for the determination of omeprazole and rabeprazole in plasma samples