Shining green
Tracking down microplastics with fluorescence
Marion Egelkraut-Holtus, Shimadzu Europa GmbH
Albert van Oyen, Erwin Jansen, Carat GmbH
Where does microplastic come from?
Microplastics are one of the greatest global challenges for humanity, wildlife and the environment. They originate from larger pieces of plastic that have weathered or are already contained in everyday objects, for example in cleaning products, cosmetics or textiles. Microplastics enter the oceans through wastewater; sewage treatment plants can only filter them out to a limited extent. Once in the sea, these plastics can no longer be removed. Microplastics are found at all depths of the oceans, enter the food chain from there and are ingested by microorganisms that are important food for fish. The fish, in turn, feed marine mammals, birds and humans.
This third part of the series of articles on polymer analysis is about fluorescent microplastics and how they can benefit research using fluorescence spectroscopy. In the last two issues of Shimadzu Magazine, polymers from beverage bottles in the food sector were detected
Marion Egelkraut-Holtus, Shimadzu Europa GmbH
Albert van Oyen, Erwin Jansen, Carat GmbH
Media, environmental protection organizations and authorities report on microplastics. These particles pose danger to humans and animals and are already found in their excretions. But research on the direct impact of microparticles in the body is in its infancy.
Since many publications keep developing theoretical models and work with “freshly generated” microplastics, the idea here is to recycle used material, shred it and then use it for testing purposes. Thus, instead of putting new and more polymer into the environment, existing polymer is used; it is about micro quantities here, not kilograms or tonnes. And the materials are real-life samples with true properties of the microparticles that the organisms must deal with by necessity.
Microplastics are dangerous to the environment mainly because of their small size, which means that a large number of organisms ingest them, because they mistake them for food.
A next step in the development of innovations in environmental research could be fluorescent microplastics. They may make it easier to determine whether and where these materials accumulate in organisms. This would then enable better risk assessment.
According to an application, it should be possible to produce fluorescent microplastics using the lipophilic dye Nile Red. But here the question arises, why produce them when there are enough polymers with fluorophores
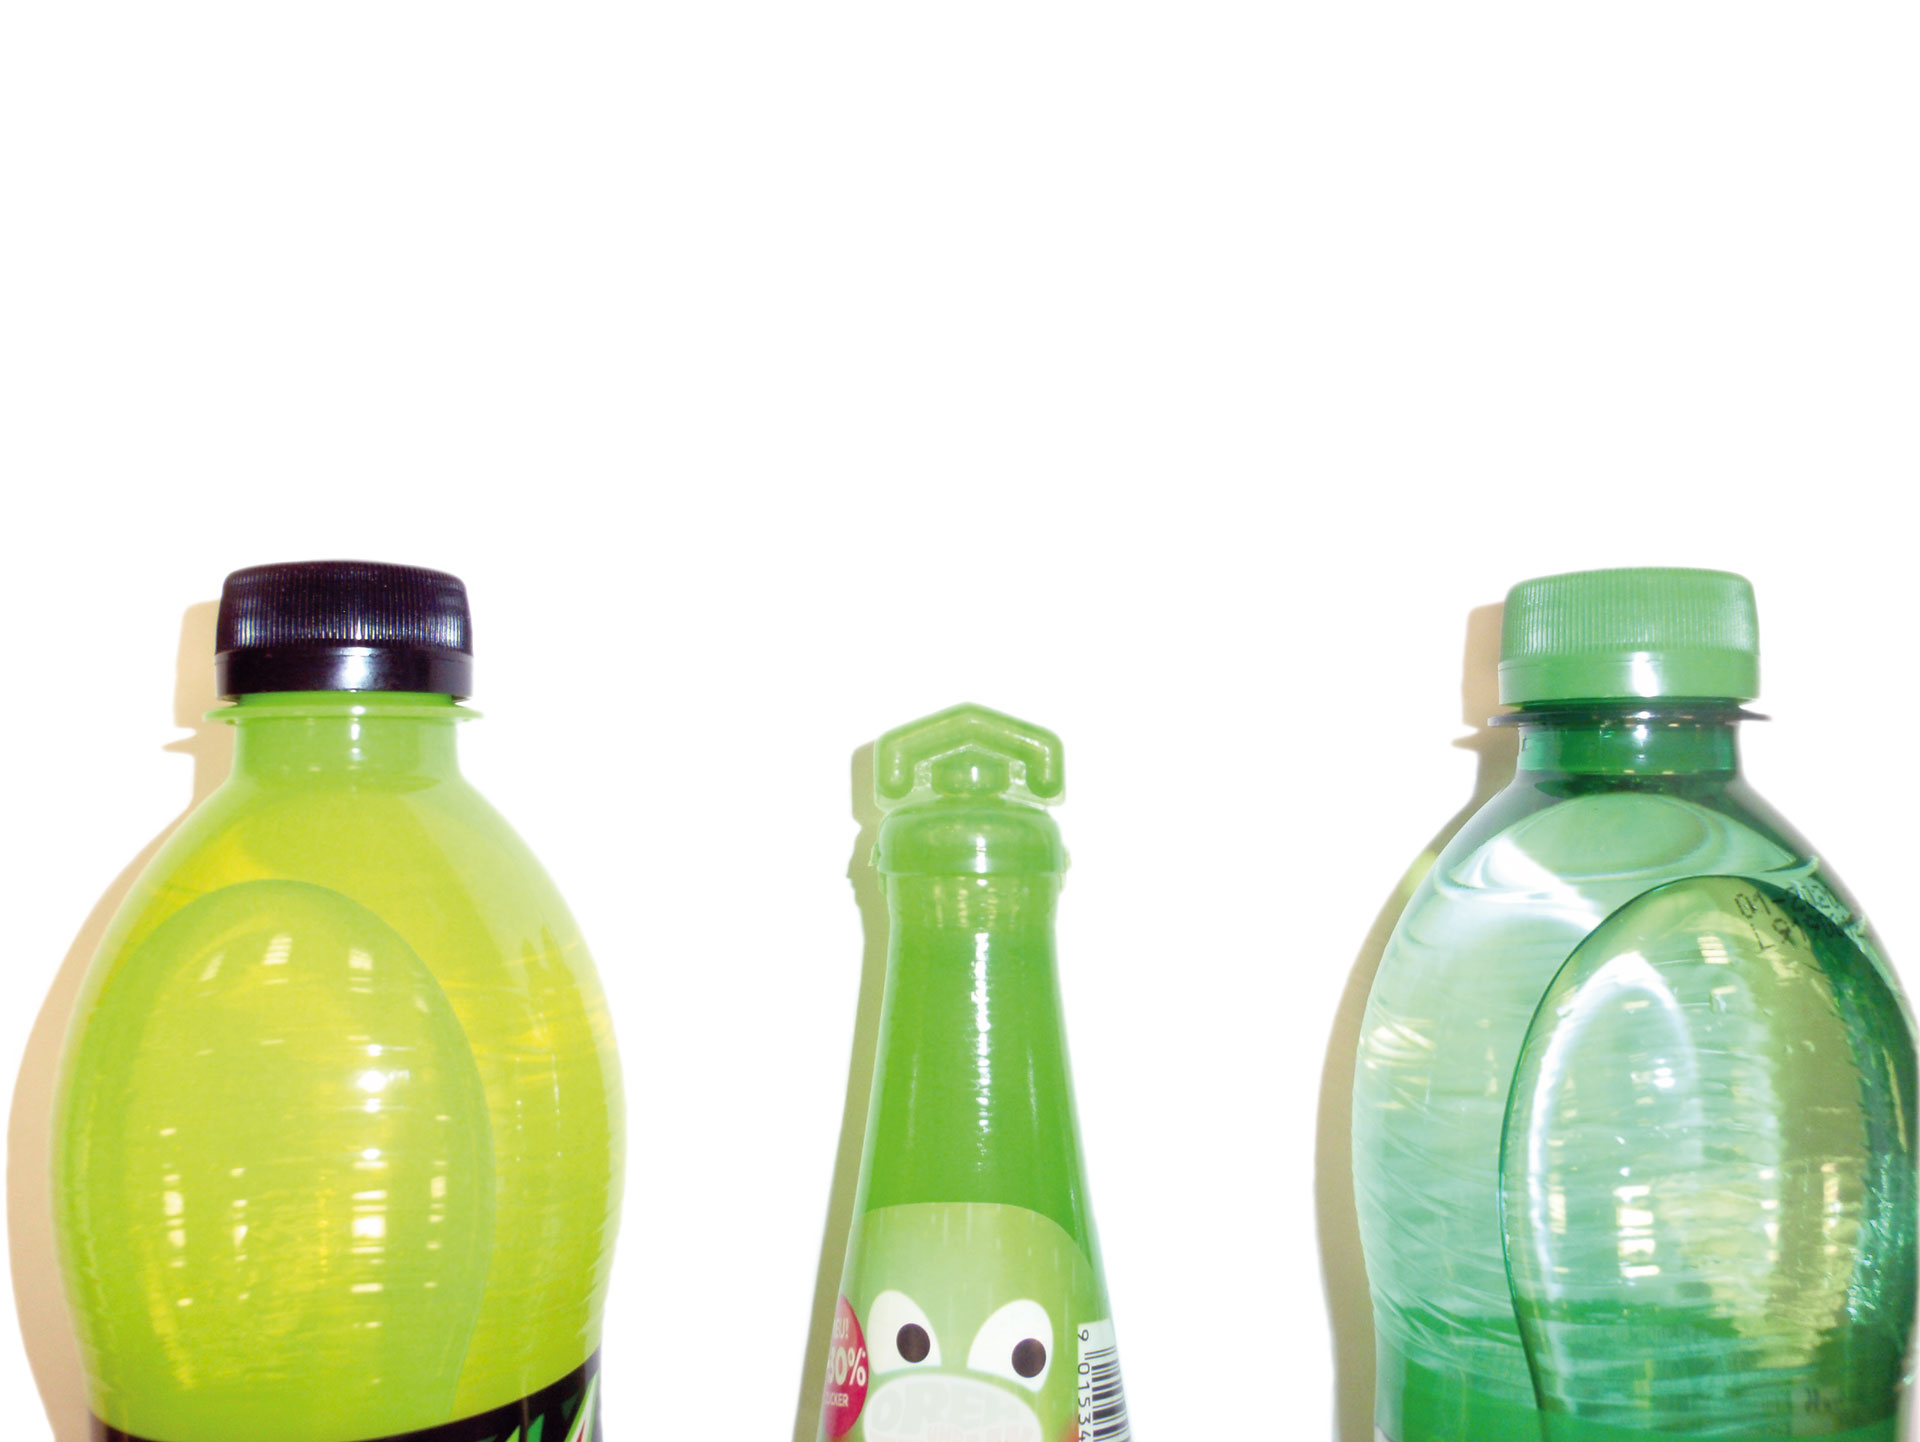
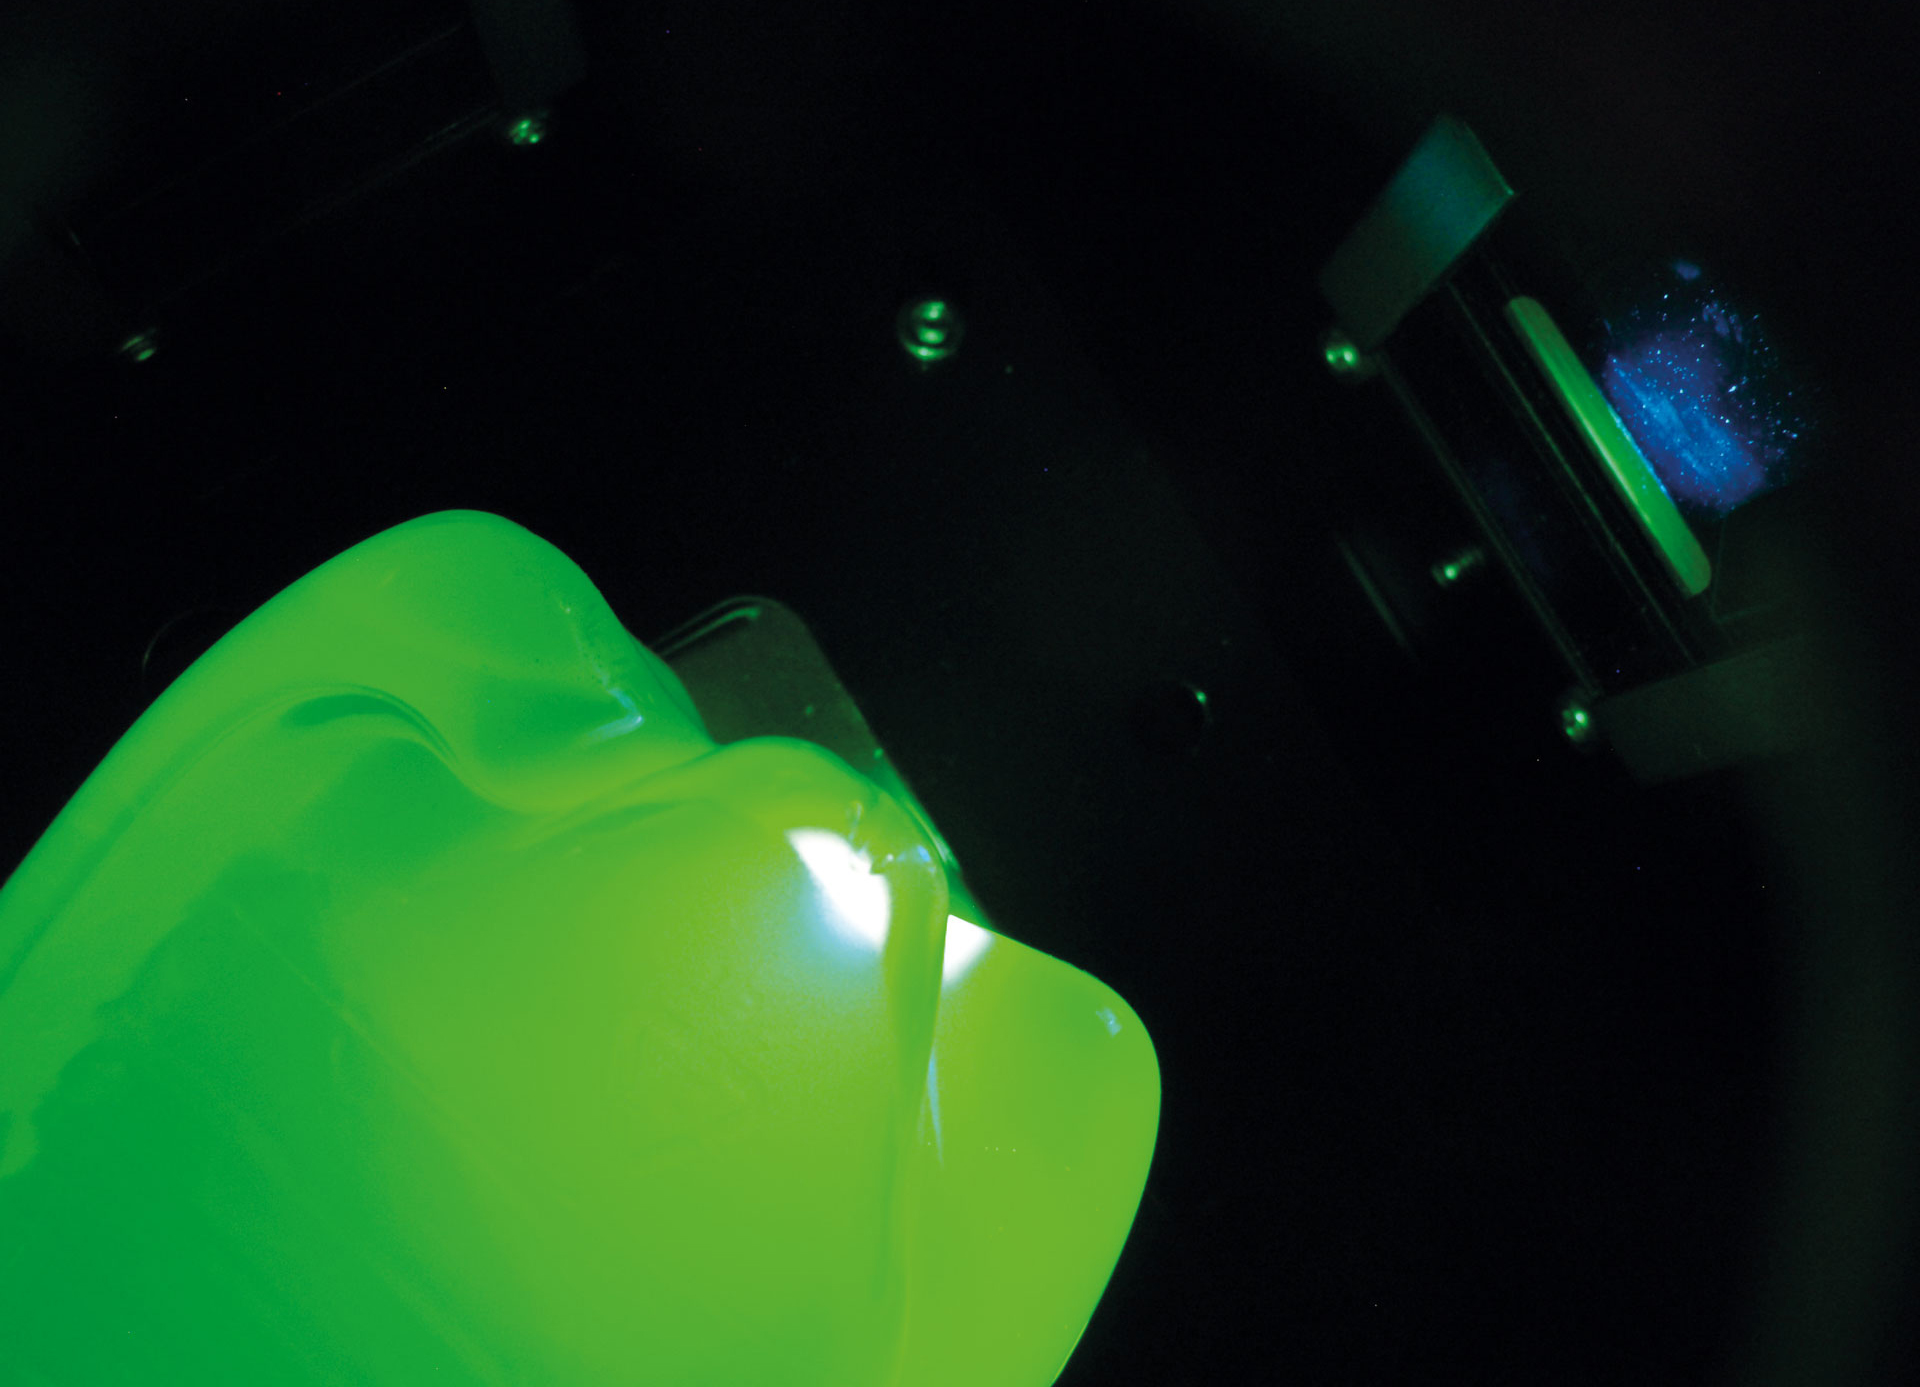
Figure 2: PET bottle bottom (caffeinated lemonade) and the fluorescence under a xenon light source. The bottle was mounted in the sample chamber of the RF-6000.
The Carat company from Bocholt, Germany has developed the idea further. It specializes in the analysis of thermoplastics. For the application at hand, Carat has found a way to break down, specify and certify the polymers. With the RF-6000 spectrofluorometer and a solid sample holder, Shimadzu has supplied a solution that can measure these small particles.
Measurement challenge microplastics
Microplastics lead to special requirements in analytical technology. Fluorescence is known for its high detection limits in liquids. Can this property also be transferred to particle size? In the two previous issues of the Shimadzu customer magazine
Microscopy is useful for samples smaller than 100 µm, for instance in the identification of particles with infrared spectroscopy. This third part of the article series looks at the identification or simply recovery of particles smaller than 500 µm with fluorescence spectroscopy. Common polymer granules in the size of 5 mm show more or less strong fluorescence, which arises from polymers with π-electron molecular structure (double bonds) or from fluorescent additives. Now PC (polycarbonate) and PET (polyethylene terephthalate) are being examined more closely.
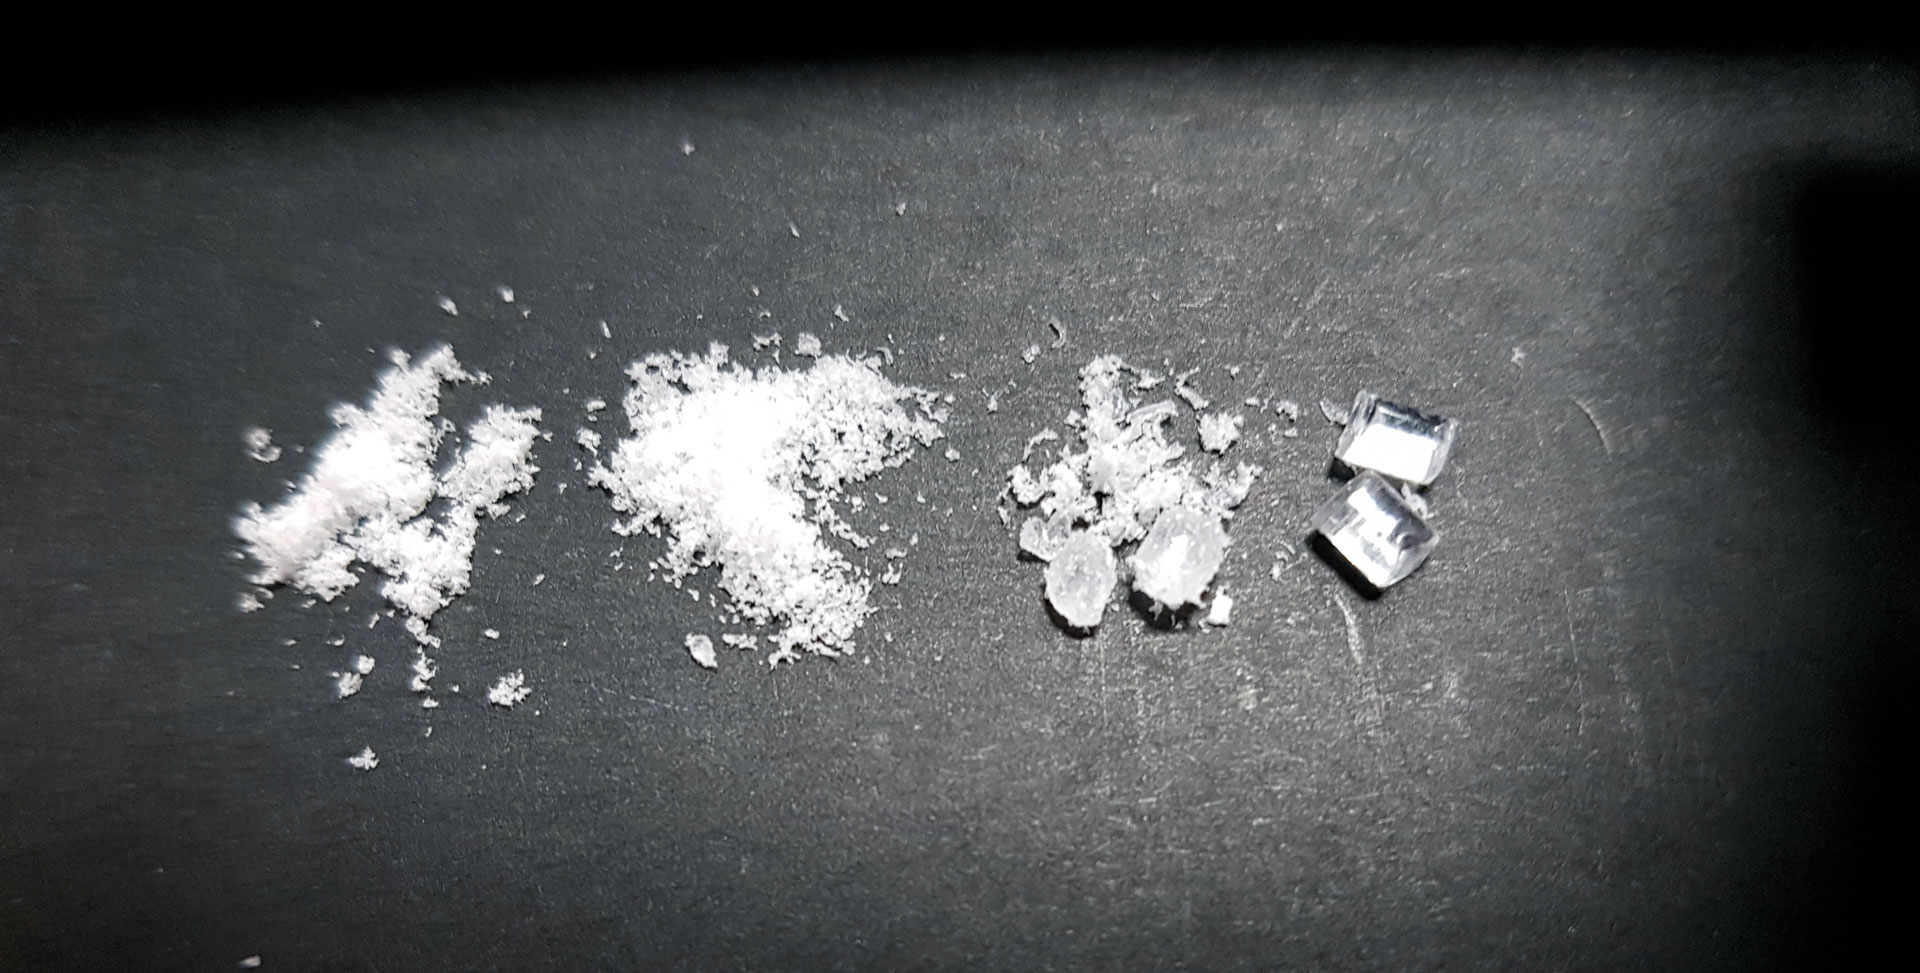
In order to simulate microparticles, polymers were ground to a size smaller than 500 µm using the cryo-mill (Carat’s method). The polymer particles
Sample preparation and analyses
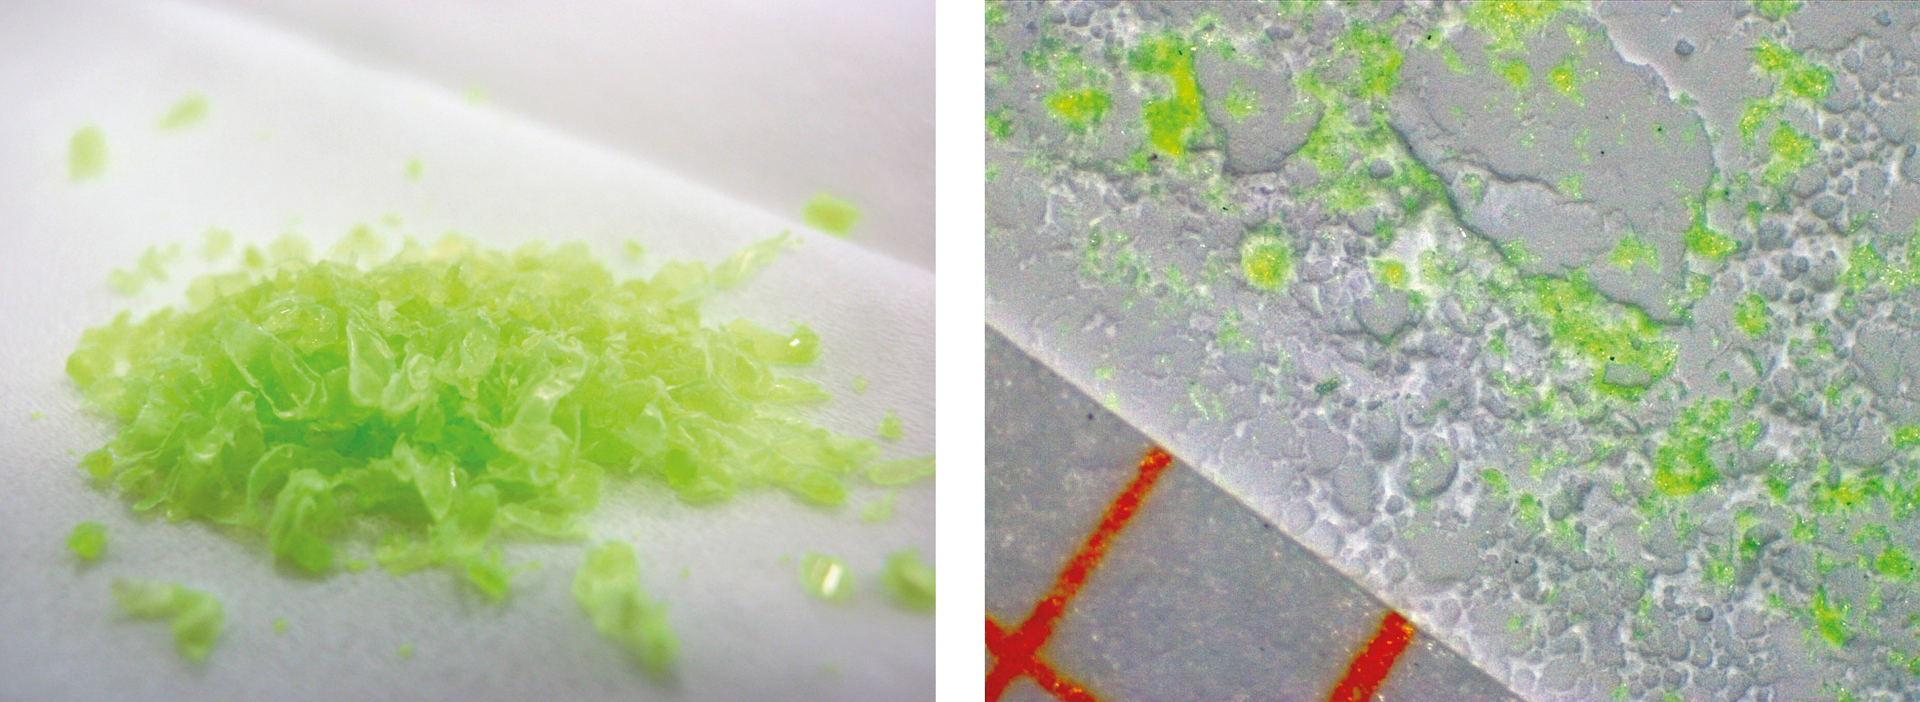
Particles from each fraction were scattered into the center of a bed of barium sulphate (BaSO4), acting as a fixative, and pressed down with a quartz plate (figure 4). These measurements consistently showed homogeneity down to below 500 µm and presence of fluorescence (figure 5). Depending on the polymer and/or additive, the fluorescence intensity is attenuated with the microparticles compared to higher concentrations (larger surface areas and layer thickness of the polymers).
In an experiment with PET microparticles, grinding of the bright bottle would be suitable. With a very small amount of microparticles, the fluorescence can still be intense, so a standard fluorescence instrument can detect the presence of the particle (figure 6). Measurement parameters and sample preparation were not changed for comparison reasons.


Conclusion
In this series of articles on the fluorescence of polymers, various fields of application were addressed. Polymers from beverage bottles in the food sector
This shows that fluorescence can be used as an excellent instrument for quality control. For all plastics, it could be shown that intrinsic fluorescence occurred or that additives (e.g., Lumicolor admixture yellow, green and others) are responsible for the fluorescence and that their matrix releases fluorescence except for one PP sample.
The detection limits of fluorescence spectroscopy mean that microplastics smaller than 500 µm can also be examined. Here, the concentration of the fluorophores influences the detection limits in relation to the particle size. This is an important argument for polymers that emit weak fluorescence. Residue analysis from filtration, where microplastics are expected, was not considered here. This will be a subject for future analysis.
As a prospect, it is possible to envisage solutions in the near future that can use fluorescent markers invisible to the human eye to better sort recycled PET bottles and increase recycling capabilities to food packaging levels in order to achieve the EU requirement of 95 % purity for food quality in recycled PET. [4]
Literature
- „Impact of marine debris on Antarctic fur seals Arctocephalus gazella at Cape Shirreff: diet dependent ingestion and entanglement Preliminary results”, Elisa L. Bravo Rebolledo & Jan A. van Franeker IMARES, PO Box 57, 1780 AB Den Helder, The Netherlands (Visiting address: Ankerpark 27, 1781 AG Den Helder)
- „Detektion von Mikroplastik im (Ab-)Wasser – Die Suche nach der Nadel im Heuhaufen?“, Sturm, M.T., Kluczka, S., Wilde, A., Schuhen, K., Analytik NEWS (30.05.2018)
- „Marine microplastic: Preparation of relevant test materials for laboratory assessment of ecosystem impacts”, Susanne Kühn et al., Chemosphere Volume 213, December 2018, Pages 103-113
- „New fluorescent tech can light up food packaging recycling rates”, Plastics Today