
How much fluorescence does a polymer show during quality control?
Polymers and fluorescence – Part 2: Fluorescence spectroscopy of industrial base polymers
As described in Part 1 of the last issue, polyethylene terephthalate (PET) can be examined easily with fluorescence spectroscopy, simply by applying a piece of the PET bottle wall in order to analyze the fluorescence. This revealed fluorophores that might not have been suspected in the transparent, colorless or slightly bluish-clear polymer pieces.
In the next step, polymers are examined that originate not from the consumer sector, but rather as “new” or “recycled” directly from industrial production. For this purpose, crystal clear and colorless polymers were selected, such as polycarbonate (PC), polystyrene (GPPS), styrene acrylonitrile (SAN) and a recyclate of polycarbonate (PCrec).
The industrial polymer variants listed here are used for example as “glass replacements” in industry due to their hardness (impact resistance) and durability. Some of the granules have a cylindrical or slightly cloudy lenticular shape. The biopolymer granules examined, such as polylactides (PLA) and polybutylene succinate (PBS) were transparent and colorless, with slight turbidity. The non-aromatic polymers such as polypropylene (PPhomo), polyethylene (PE) and polyvinyl chloride (PVCsoft), also appeared as colorless, opaque and soft granules in lenticular form.
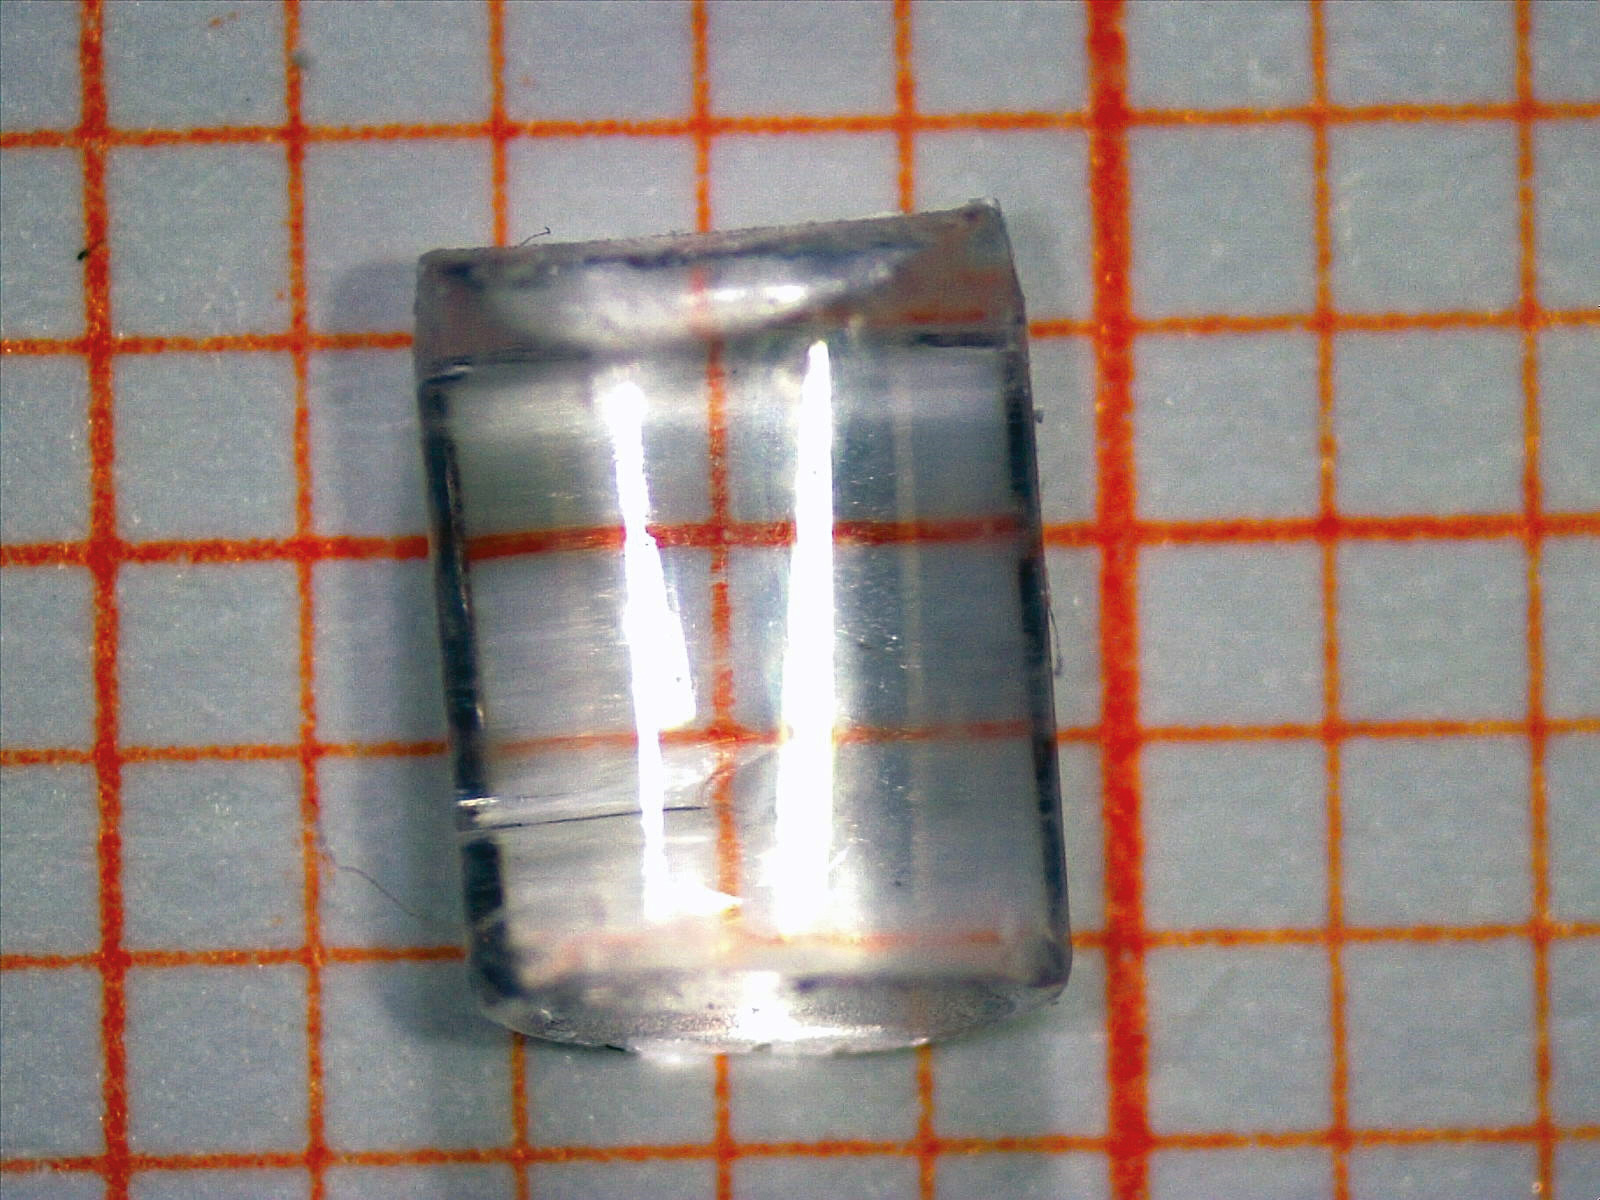 Figure 1: A typical polymer granulate in crystal clear and colorless cylindrical form on graph paper. The orange grid in the background of the granulate corresponds to 1 mm per square.
In this application, “industrial” polymers and recycled polymers are all colorless, transparent or turbid. It is expected that all polymers would show their natural fluorescence.
Fluorescence can occur when the molecule absorbs much energy. Considering the molecules of PC, GPPS, SAN and PET, all structures contain high-energy ring systems.
Fluorescence and phosphorescence
When an electron in the ground state S0 is exposed to light, the energy of the electron in the molecule is changed. This elevates it to the excited state S1 with a higher energy level (see figure 2). This excited state is not stable in the long term and changes rapidly as it approaches the ground state. The excited electron decays by radiating the energy through heat or light. The radiative transition from state S1 to S0 that emits a photon is called fluorescence. The alternative excitation from T1 to S0 is called phosphorescence. In the T1 state, three electrons are at a higher energy level (excited triplet state). S1 is the excited singlet state (1 excited electron in higher energy levels).
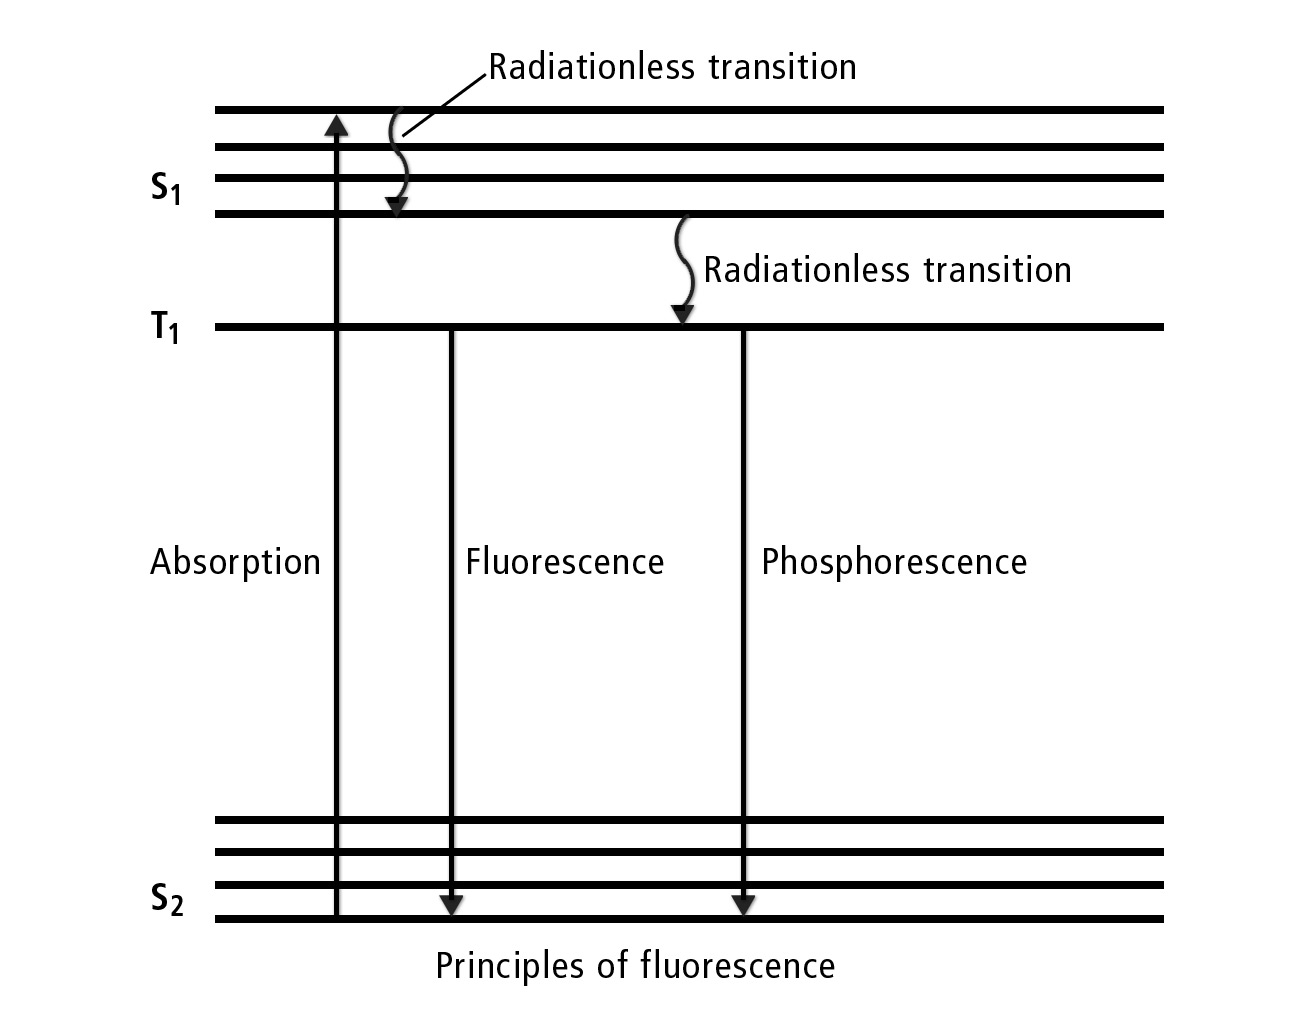 Figure 2: The imaginary axes would be seen as follows: The X axis corresponds to time and wavelengths; the Y axis represents energy. The excitation by light (arrow upwards) at the time 00:00 at a given wavelength leads after a short time (dwell time in S1 and release of first energy) to a wavelength offset to longer wavelengths. Therefore: Fluorescence needs an excitation/light source and appears shortly after excitation with higher wavelengths. Another conclusion is that if hard radiation is reduced by energy, it becomes softer or changes from short wavelength (hard) to long wavelength (soft) radiation.
Polycarbonates contain several phenyl-based molecular groups, which are very energy-rich due to the π electrons of the double bond in the ring. In fluorescence, electrons can be lifted into higher energetic orbitals (S1) from a high-energy ring system using hard radiation. This energy level is unstable, and the electron leaves this orbital emitting photons (luminosity = fluorescence).
The importance of the phenyl group
The general structure of the PC is

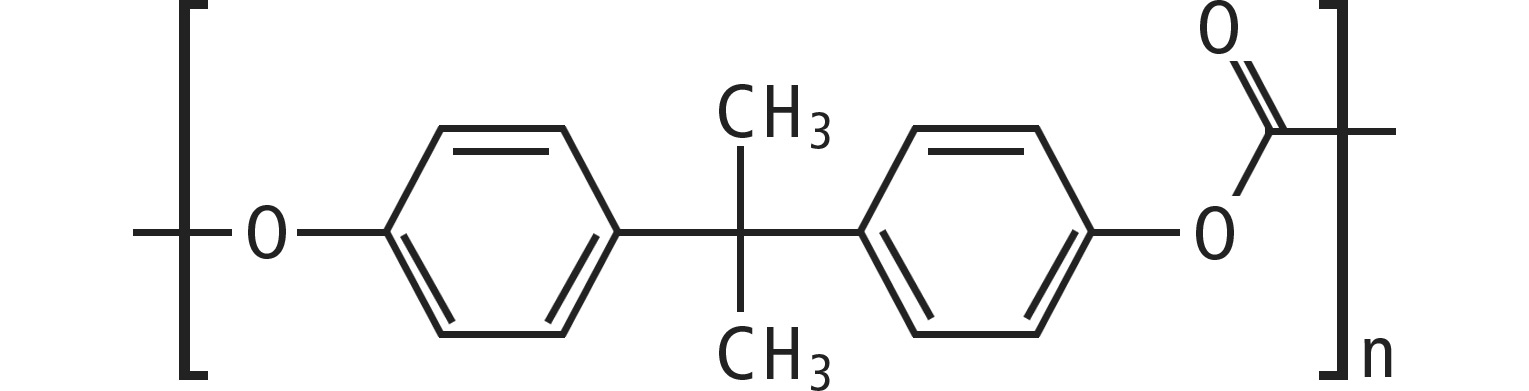
The molecular structure shows 2-ring systems (phenolic) and a carbonyl group with the usual -C=O double bond, which is softened electronically by the position in the ester group R-CO2-. There are enough π electrons available for fluorescence.
In the polycarbonate used in this application, the PCmonomer is based on BPA (bisphenol A). Recycled PC samples should be identifiable for quality control purposes, as these traces may contain fluorescent additives.
Chemically speaking, SAN consists of styrene and acrylonitrile. The dominant molecular structure is again the phenyl ring from the styrene component.
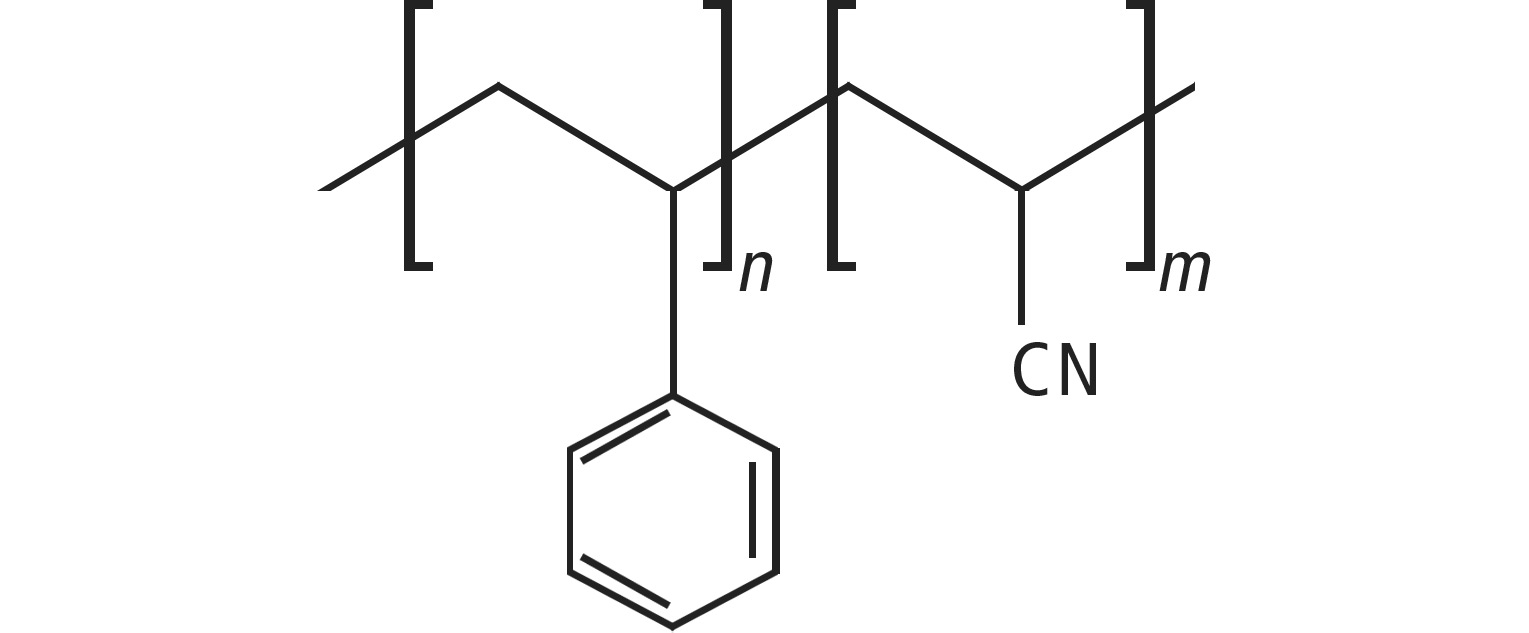
SAN

mono-PS
Since the phenyl group plays an important role in the molecular structure of all polymers under consideration, it can be assumed that the analytical fluorescence wavelength pairs are found in the same regions.
Polylactides and polybutylene succinate are chain molecules containing an ester group, which are equipped with high-energy electrons as shown in the structures.
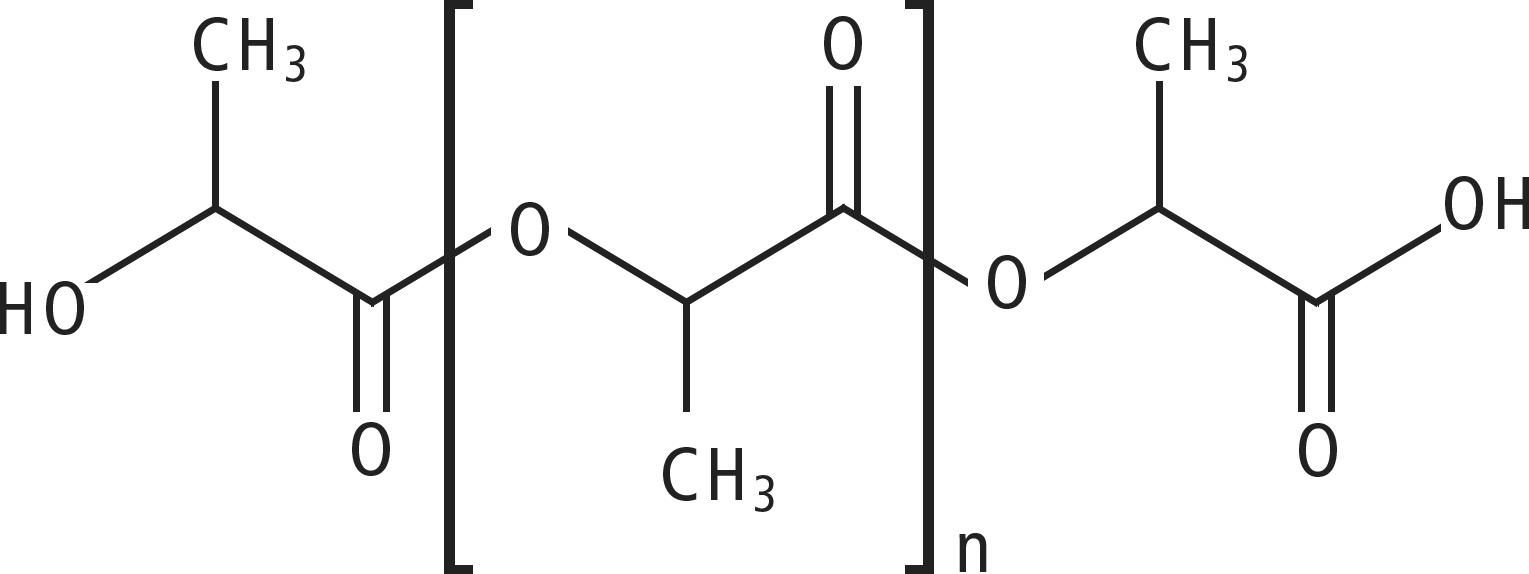
PLA
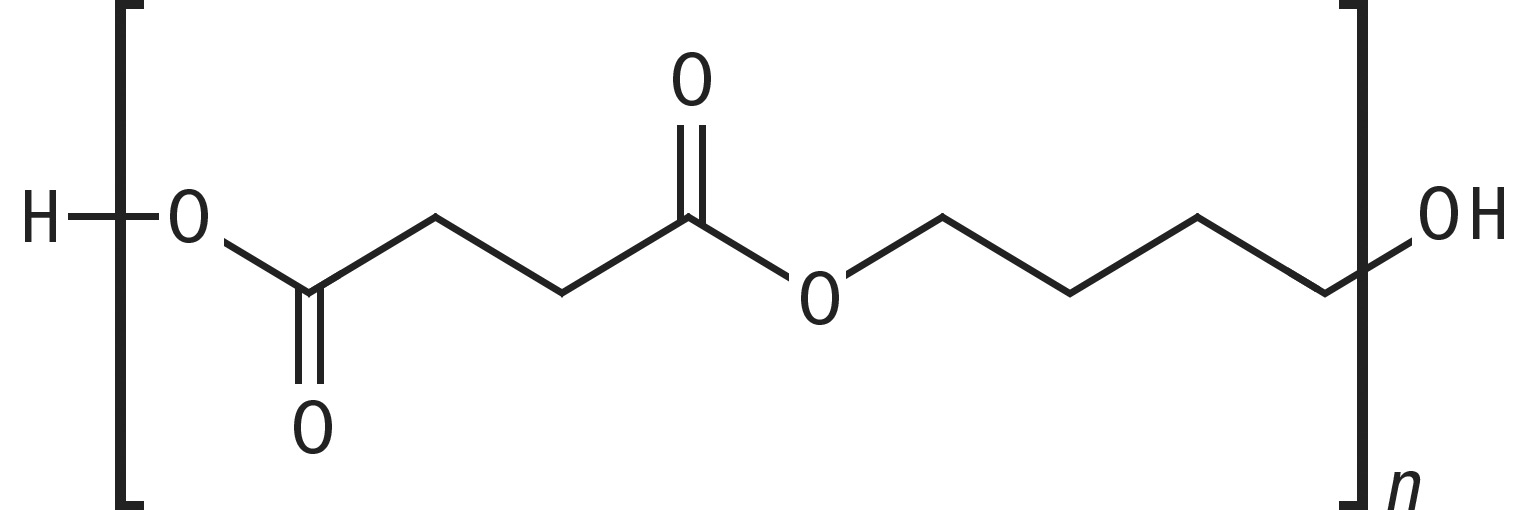
PBS
PE, PP, and PVC on the other hand are chain molecules in which no surplus energy-rich π electron compounds or aromatic elements are available for fluorescence.

PE

PP

PVC
Sample preparation
The sample size and position within the barium sulphate (BaSO4) bed in the holder for solid samples must be taken into account in the measurements. The experiment with the granules showed that the slit geometry of the light spot plays an essential role. The projection of the slit (rectangle) aims exactly at the center of the round holder. The inside diameter of the BaSO4 bed is 2.5 cm. Depending on the selected slit, this round surface is illuminated in a more or less rectangular fashion. The granulate was embedded in the center of the holder and sealed with a quartz plate. This is important to note because the granules are not flat and cannot be homogenized with BaSO4 due to their size and strength. BaSO4 is used here as a fixing powder.
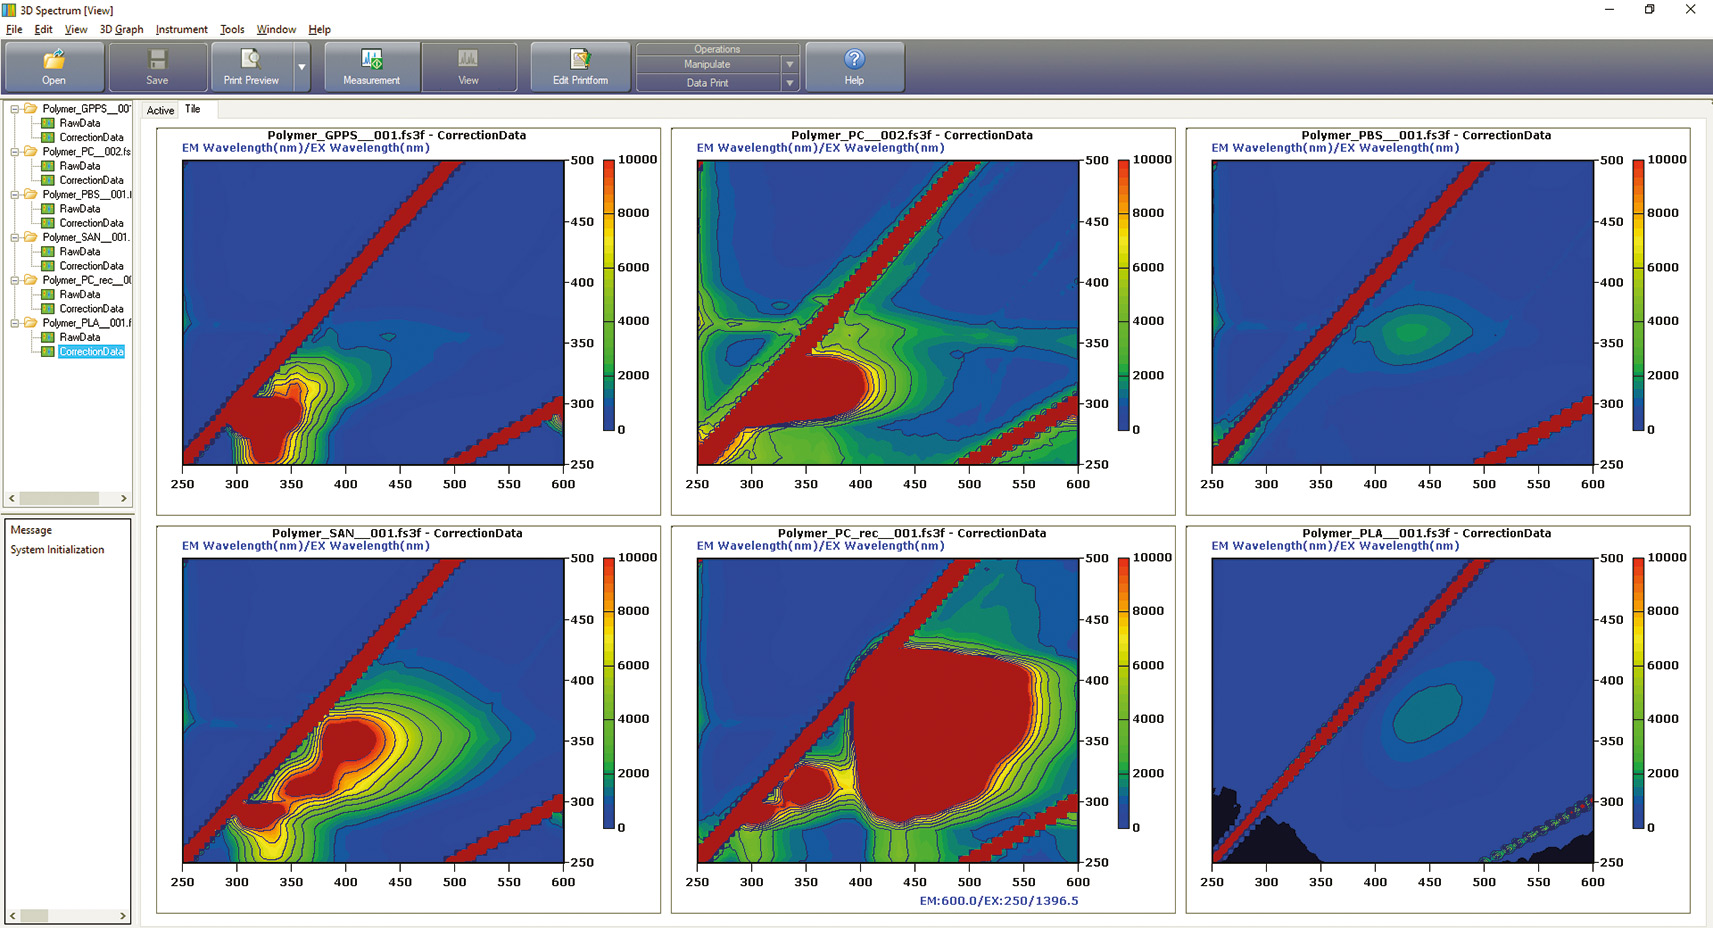 Figure 3: Fluorescence spectra of six different polymers: top left to right – GPPS, PC and PBS; bottom left to right – SAN, PCrec and PLA (for positions of the spots in the EEM see Table 1.
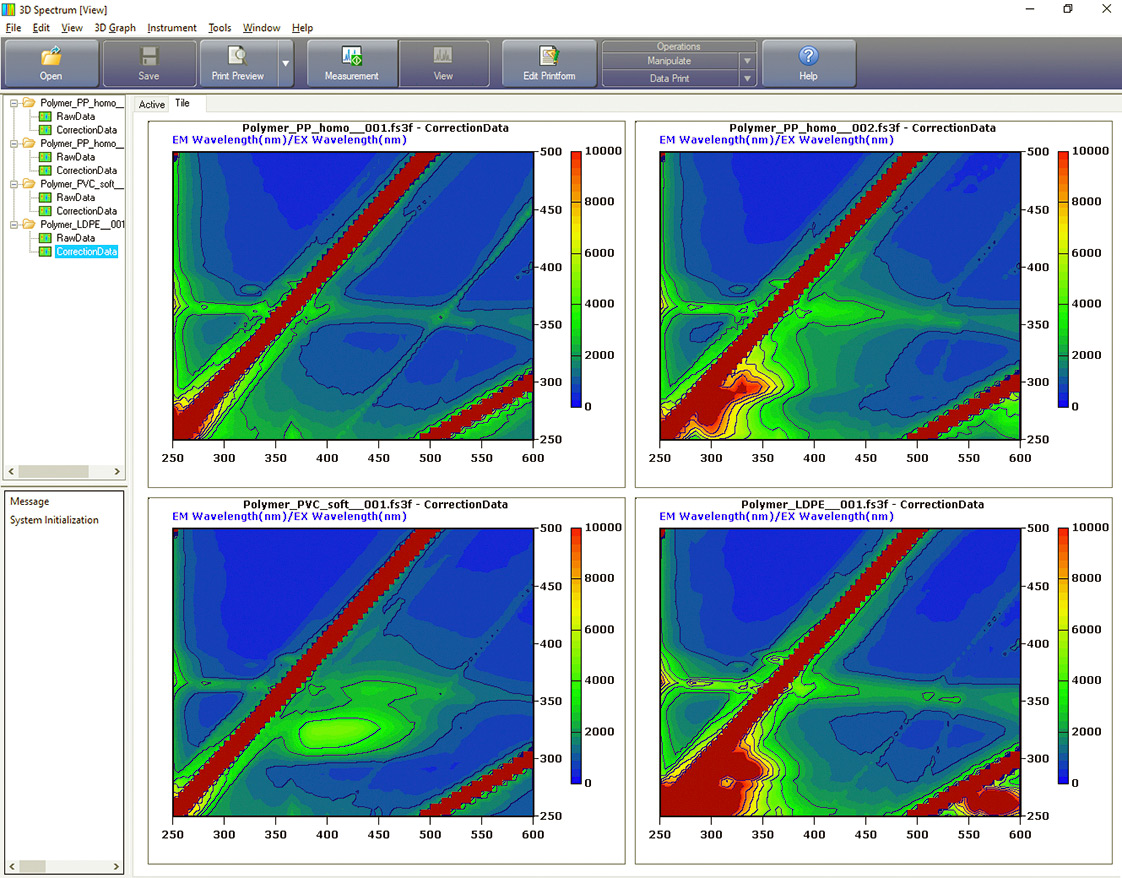 Figure 4: Spectra for long-chain non-aromatic polymers with the same scaling of intensity. Also at top left is the control EEM from the quartz plate above the BaSO4 bed. Top right PPhomo, bottom left PVCsoft and bottom right LDPE (low density polyethylene).
Evaluation of the measurements
Depending on the properties described, the different polymers also show different fluorescence. Figures 3 and 4 show the EEM (excitation emission matrix) matrices obtained.
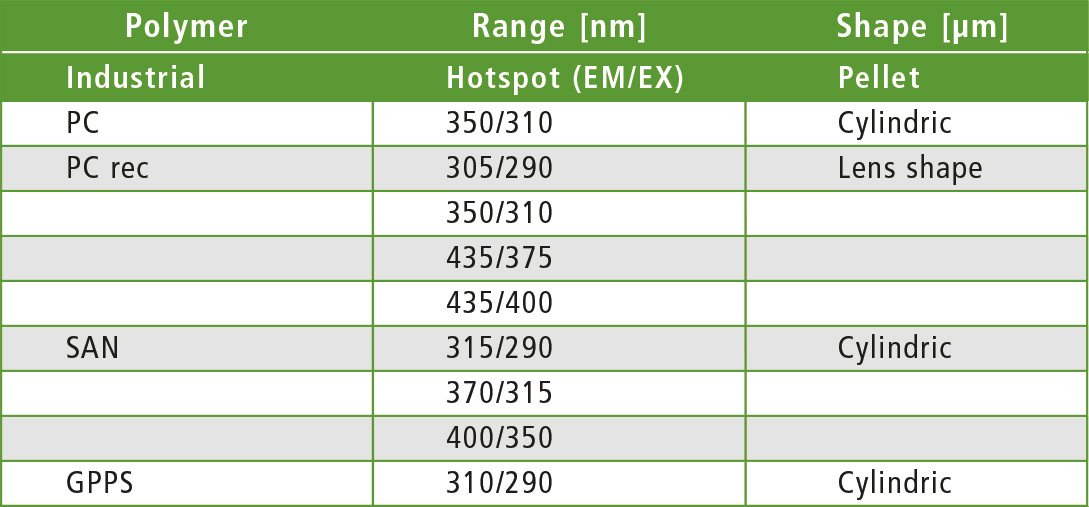
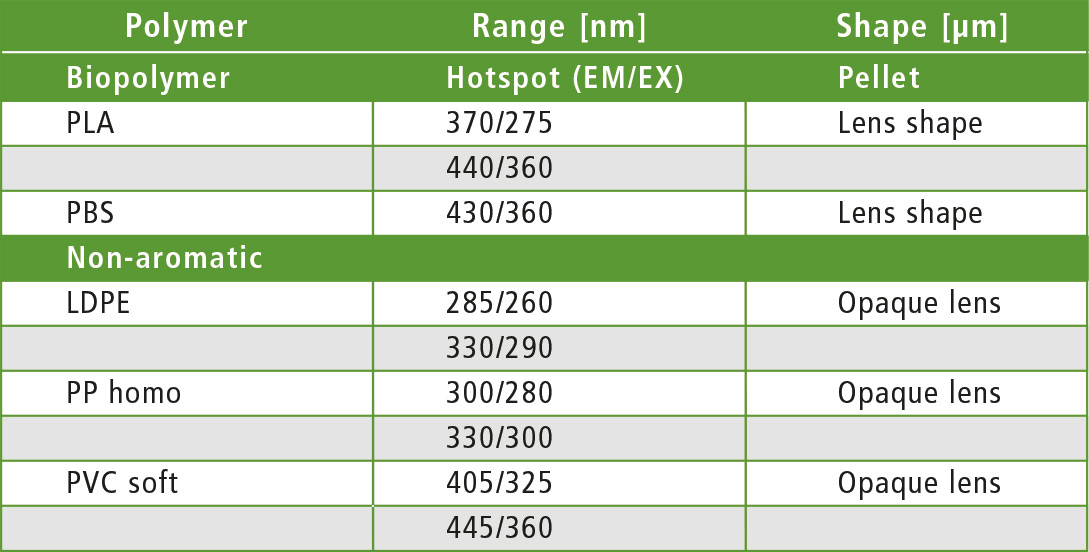 Table 1: Active fluorescence zones (hotspots) of the polymer granules in different forms – cylindrical and lenticular granules
Remarkably, fluorescence activities could be found in all polymers. The hypothesis “no fluorescence with LDPE and PP” was not met. It appears that additives are present that promote fluorescence. Comparison between PC and PCrec for example, demonstrates that by using an additive (for bleaching), the recyclate is supposed to appear colorless and transparent (table 1).
Conclusion
Each polymer used here has its own fluorescence spectrum. In the industrial plastics PC, GPPS and SAN, fluorescence is determined by the fluorescence activity of the phenyl ring. In contrast, the chain molecules of the plastics PLA and PBS fluoresce due to the presence of the ester. According to the molecular structure, steric constraints and different excitation positions in the compact PLA molecule, the PLA molecule has hard radiation corresponding to the energy demand, whereas the PBS with long CH2 chains requires less hard radiation. The non-aromatic polymers such as LDPE, PPhomo, and PVCsoft show fluorescence, although none is expected in these π electron-poor materials.
Fluorescence spectroscopy can therefore be used easily for quality control in order to make the “invisible” visible.