Hard x-ray for soft water
Quality control of zeolites for washing powder with EDX-8000P
Many washing powders contain zeolites for water softening. This role was fulfilled in the past by phosphates, leading to a notorious growth of algae and severe damage of aquatic ecosystems. Even though natural zeolites exist, they are specifically synthesized with defined stoichiometry and structure [1]. One widely used example is Zeolite A with an equal content of alumina and silicone. The advantage for technical applications is a well-defined anionic cage structure made from ([AlO2]12[SiO2]12)12– blocks as shown in figure 1.
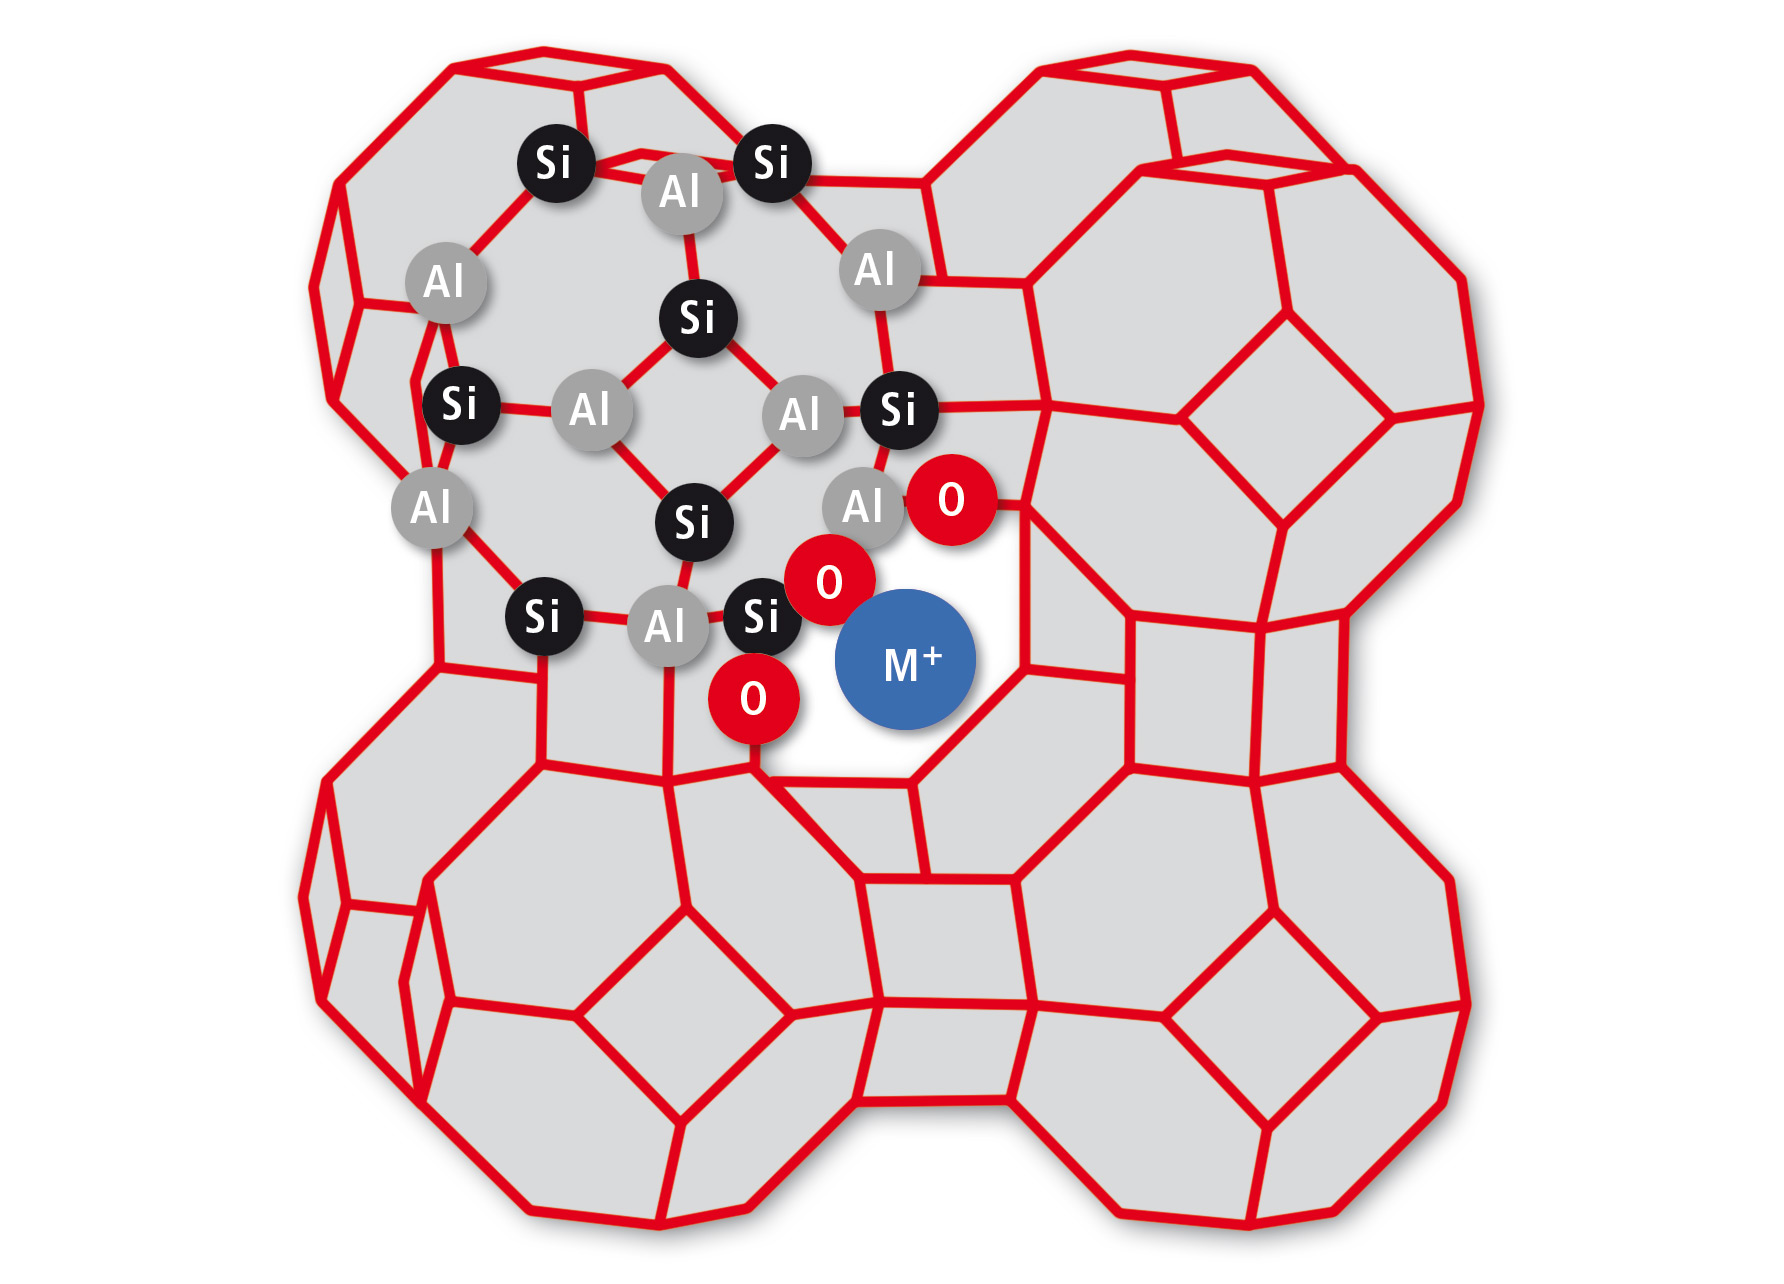 Figure 1: Structure of Zeolite A. Al and Si atoms (nodes) are connected by shared O atoms (lines), leading to a cage of alternating AlO4 and SiO4 tetrahedrons. Only some atoms are labelled to indicate the binding motif.
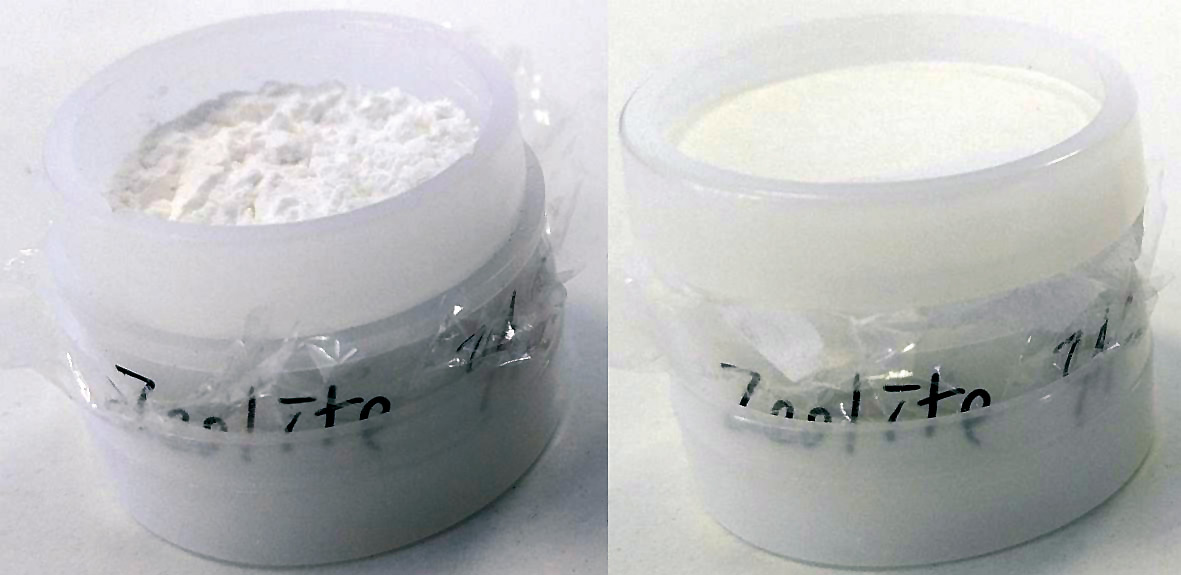 Figure 2: Zeolite powder prepared for EDX measurement. Left: open cup, right: sealed cup for vacuum measurements.
Molecules such as water that are small enough to enter the pores are bound there until the zeolite is heated. The effective pore diameter for use as molecular sieve is on the scale of 0.3 – 0.5 nm and depends on the cations bound to the anionic cage, since they block the pores to some degree depending on their size, charge and binding force.
For the application as water softener, only sodium and potassium are valid cations. During the laundry, they are exchanged easily by calcium or magnesium from the hard water, which have a higher binding force to the zeolite cage. Without free Ca2+ or Mg2+, the formation of lime is prevented. To ensure the best product quality for each target application, the elemental composition (aluminum (Al), silicon (Si), sodium (Na) and possibly other elements) of these zeolites must be controlled.
Easy sample preparation
A common method for precise elemental analysis is inductively coupled plasma optical emission spectroscopy (ICP-OES or short ICPE). For mineral samples, such as zeolites, a thorough digestion is needed. Sample preparation takes some time and requires the use of chemicals such as hydrofluoric acid.
A fast alternative for routine quality checks is energy-dispersive x-ray fluorescence spectroscopy (EDX), e.g. with the EDX-8000P, a system penetrating samples with so-called hard x-rays of up to 50 keV. Here, the zeolite powder is filled in a special sample cup without pretreatment. Digestion of the sample is not required, and measurement time is on the scale of a few minutes including preparation.
The EDX-8000P detector is optimized for light elements such as sodium, aluminum and silicon. For this measurement under vacuum condition, the cups are closed by a seal permeable to air to prevent bursting of the cup by the sudden pressure change and spilling of the sample.
Quick measurements
The EDX-8000P has another ad-vantage for this application: the sample composition can be determined by fundamental parameters (FP) methods without the need for standards. Two such fundamental parameters are the order number and concentration of the elements included, which are given as results from the intensities of characteristic lines. Other fundamental parameters, like the sample shape, density or fixed concentrations, are either added manually or calculated from scatter peaks to support the algorithm.
FP methods are used for quick screening and depend strongly on how well the sample is described within the FP model. A higher quality quantitation of the elements is possible using calibration curves. Here, four samples of Zeolite 3A with different ratios of sodium to potassium were analyzed with an FP method and a quantitative method calibrated with ICPE results.
Figure 3 shows a typical EDX-spectrum of a synthetic zeolite after 100 seconds measurement time. All peaks detected over the defined measurement range are fitted and analyzed by an FP method. The rhodium lines are background from the x-ray tube and not used for the quantitative analysis.
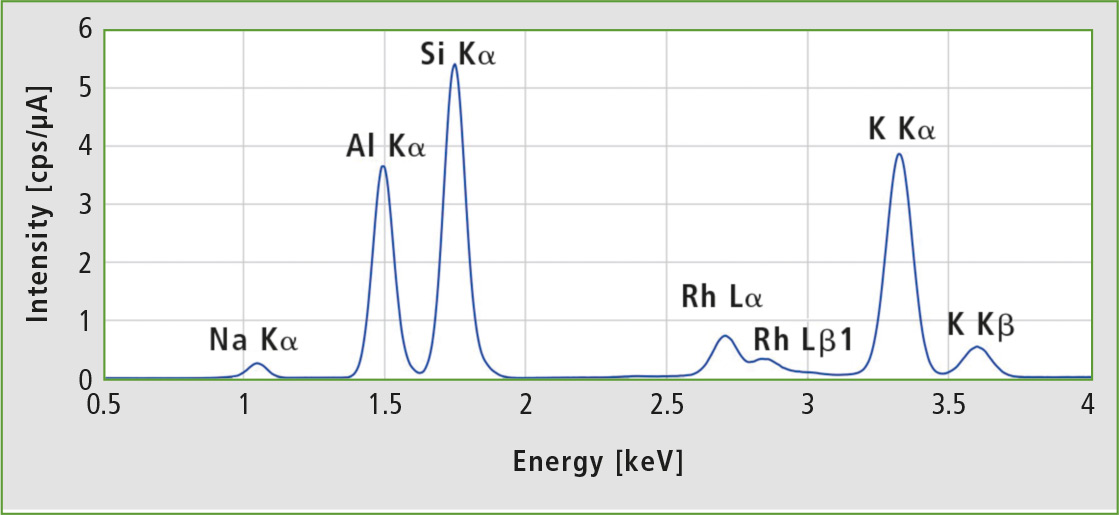 Figure 3: EDX spectrum of Zeolite A3 sample 1 at 15 kV tube voltage (C – Sc channel), 100 s live time and vacuum. The rhodium lines are scattered radiation from the x-ray tube.
Table 1 compares ICPE results given by the manufacturer of the samples to semi-quantitative and quantitative EDX measurements for all Zeolite 3A samples. The FP values for aluminum and silicon show a good match with the ICPE values, while the values for sodium and especially potassium show a bigger deviation. With the calibration curve method, only a small deviation from the ICPE values was found for all oxides.
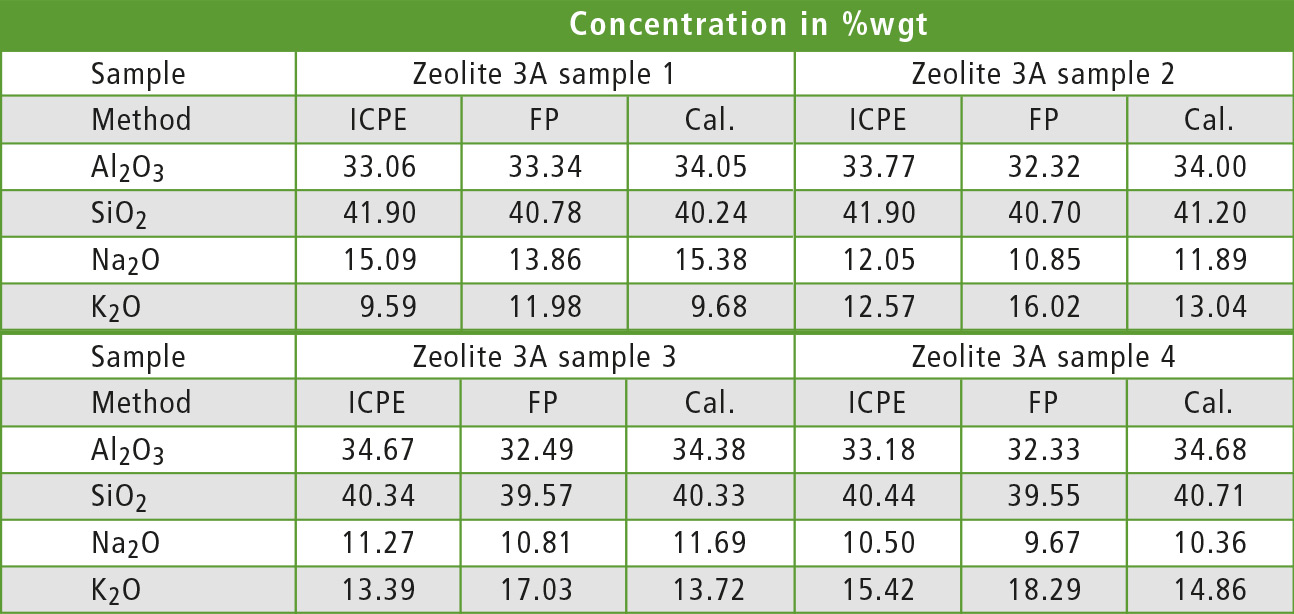 Table 1: Comparison of the results for Al2O3, SiO2, Na2O and K2O for different zeolite samples and methods. All elements are defined as oxides for a better description of the mineral sample.
To calibrate the EDX method, ICPE results of the same samples were used as standards. Calibration curves are shown in figure 4. While quantitation of aluminum and silicon by this calibration curve method seems to be inferior to the FP method at first glance, all standards had nearly identical contents of these elements, so there was not enough difference in intensity for a linear fit.
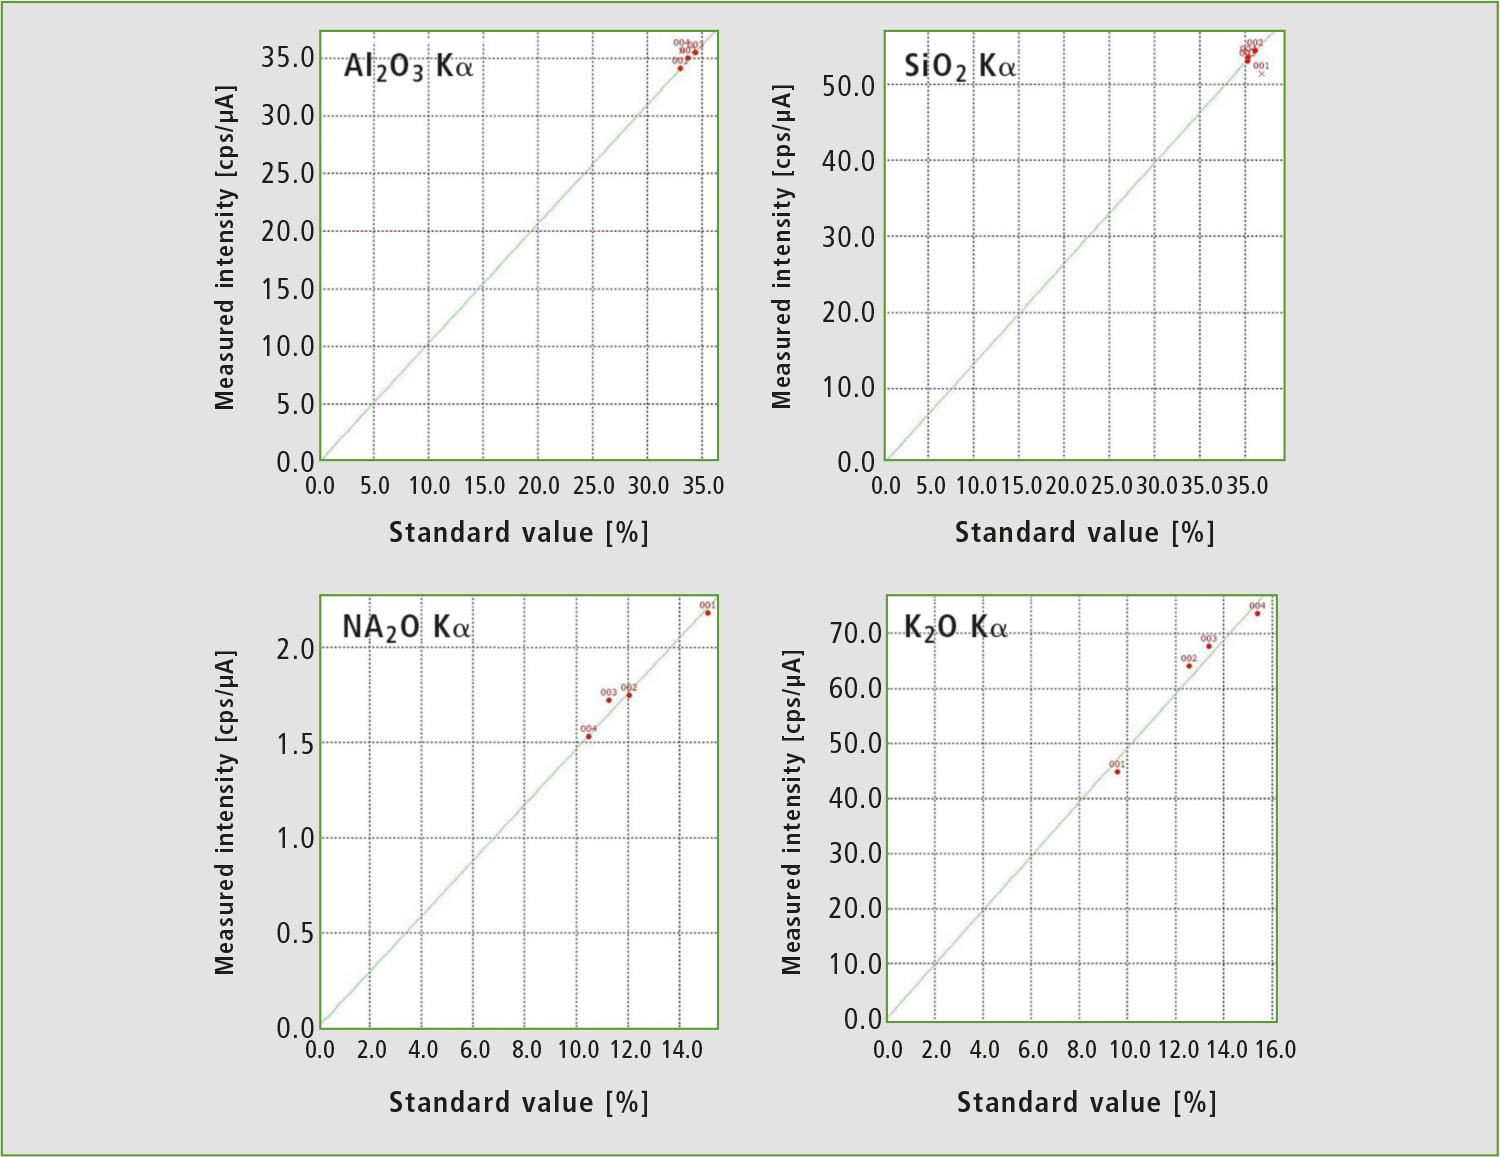 Figure 4: Calibration curves for the EDX method from table 1
Matrix corrections
One important raw material for zeolite is the aluminum or bauxite, where the content of aluminum and undesired oxides must be monitored to optimize the process parameters. The analytical methods used for artificial zeolites are easily adopted for the quality check of natural bauxite. The possible influence of other oxides on the aluminum intensity must however be considered.
To show the effect of different matrix corrections, table 2 lists the results for five different samples of bauxite measured with different methods. The same samples were used as standards. Iron was found to be the interfering element in the case of aluminum in bauxite. This was derived from the observation that the change of the aluminum line intensities in samples with constant concentration of aluminum correlated to a change of the iron concentration.
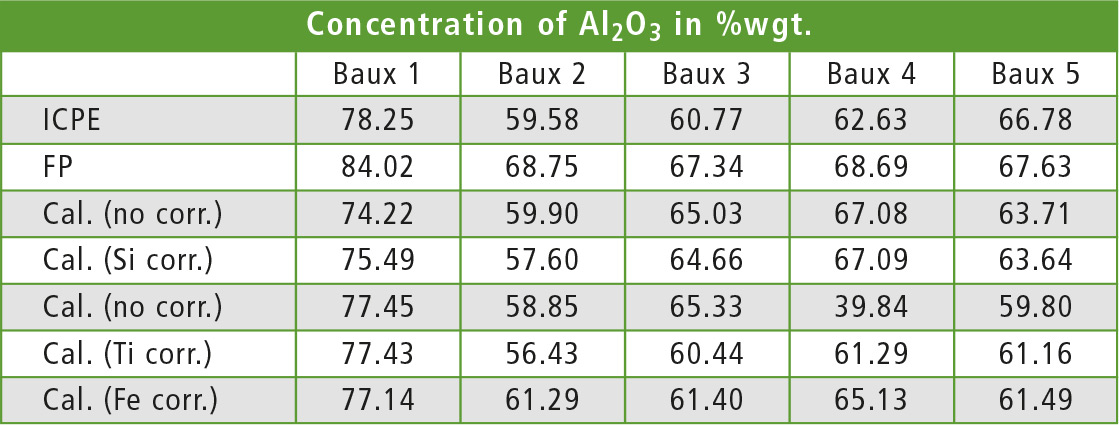 Table 2: Aluminum content in five different samples of bauxite, measured with different methods. The calibrated EDX methods differ only in the element used for calculation in the dj matrix correction.
To test the matrix correction, the De Jongh (dj) method [2] was used with one element for calculation of the correction factor. Each element was applied once for the correction and the aluminum concentration in each sample was recalculated once with each method. Table 3 shows the coefficient and average deviation from the ICPE value for each correcting element. As expected, the best results are found with iron as element for the correction.
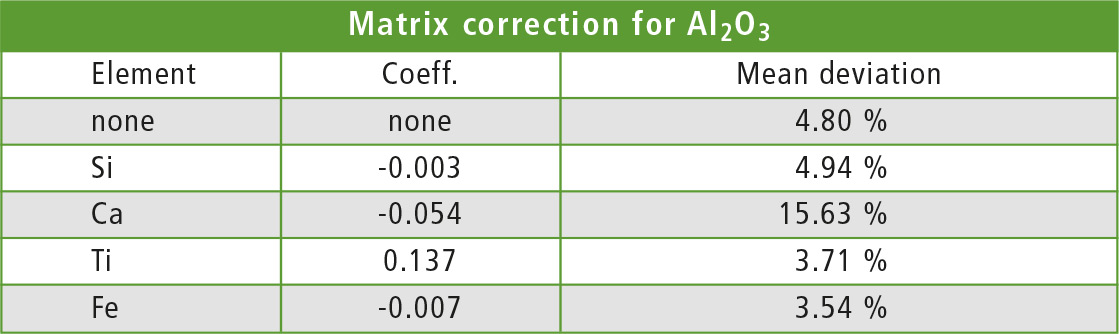 Table 3: Elements und coefficients for the dj matrix correction from table 2 with corresponding mean deviation from ICPE values
For the mean deviation shown in table 3, relative deviation of each EDX value from the ICPE value of the same sample was calculated for each method and sample (see formula 1).
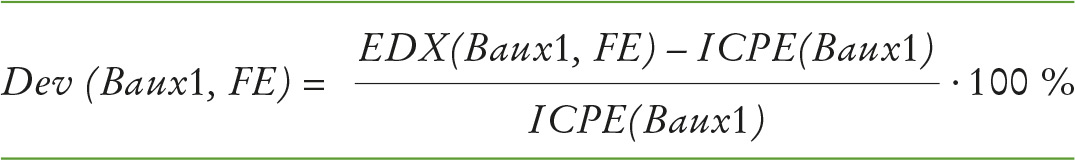 Formula 1: Sample deviation
The average of these deviations over all samples was then calculated for each method (see formula 2).
 Formula 2: Average deviation – calculated for each method
When the interfering element is hard to identify, testing different corrections as in this example and finding the method with the smallest deviation is a good starting point. The correcting element should have a small coefficient (±0.001) to avoid overcompensation.
Conclusion
The EDX-8000P is the ideal instrument for quick quality checks. The fundamental parameters method can be enhanced by additional data, e.g. from loss of ignition measurements to measure unknown samples without the need for calibration. Using matrix corrections, analysis of more complicated minerals is possible. This way, the EDX method applying hard x-rays supports applications for water softening.
Acknowledgements
We gratefully acknowledge the assistance and supply of samples from our colleagues in Shimadzu d.o.o. Sarajevo, Bosnia and Herzegovina.
Literature
[1] Zeolithe – Eigenschaften und technische Anwendungen, Lothar Puppe, Chemie in unserer Zeit 1986
[2] X-ray fluorescence analysis applying theoretical matrix corrections. Stainless steel, Willy K. De Jongh, X-Ray Spectrometry 1973