Paper clip fashion show
Color control in the production of coated metal paper clips
Commodities and natural foods have one thing in common: their visual appearance and their reproducibility, which are key for sales. This is equally true, for example, for apples and pears and their packaging as well as for colors of beverages or clothing. Consumers are conditioned to perceive something being wrong in case of deviating colors. This is why many everyday products are subject to color inspection.
It is well known that people perceive and describe a specific color in different tones, e.g. of red or blue. In order to automate color management in the production process, measuring instruments and physical properties tables are available that define the colors.
Color determination is standardized through fixed table values. Color is classified in three primary colors known as RGB colors that reflect the proportion of red, green and blue in a color blend. Tristimulus values (XYZ) according to the CIE standard take human color perception into account in the evaluation of spectral characteristics of color [1]. Color perception also depends on the illumination source and the viewing angle. Depending on the source of light, brightness, yellowness and other color characteristics can be determined.
Spectroscopy and paper clips
Color is a domain of UV-VIS spectroscopy. This technology can be used to simulate the visible range in which humans perceive color, to measure materials and to analyze and categorize the spectra obtained. UV-VIS analysis is well known in the investigation of liquids, glasses and films. Standard liquid cuvettes can handle sample sizes with an area of, for instance, 1 x 4.5 cm up to areas of several centimeters. The application discussed here focuses on small solid sample sizes. Of interest is the color of a coated wire with a diameter of approximately one millimeter.
Colorful paper clips have been selected here as a simple example for this type of material. The wires coated with a colored polymer have a diameter of approximately 1.25 mm. Figure 1 shows the paper clips.
 Figure 1: Paper clips of various colors
Sample preparation
A micro sample holder was used for the measurements. This holder has a measuring window of 3 x 3 mm. The sample is fixed between two plates in the holder. Figure 2 shows a yellow wire clamped in a micro sample holder and figure 3 shows a paper clip. This holder is attached to an integrating sphere (Ulbricht sphere) and is irradiated directly with UV-VIS light. Nine different sample colors (table 1) were selected, including black, white and non-coated (bare).
 Figure 2: Detail of a clamped yellow paper clip with the 3 x 3 mm measuring window in view
 Figure 3: Micro sample holder with a clamped white paper clip
Figure 4 shows the UV-VIS spectra of the measured paper clip colors. The colored lines of the spectra represent the colors of the paper clips. The colors are listed in table 1.
 Figure 4: UV-VIS reflectance spectrum of unicolor paper clips for which the line color of the spectrum was classified in table 1
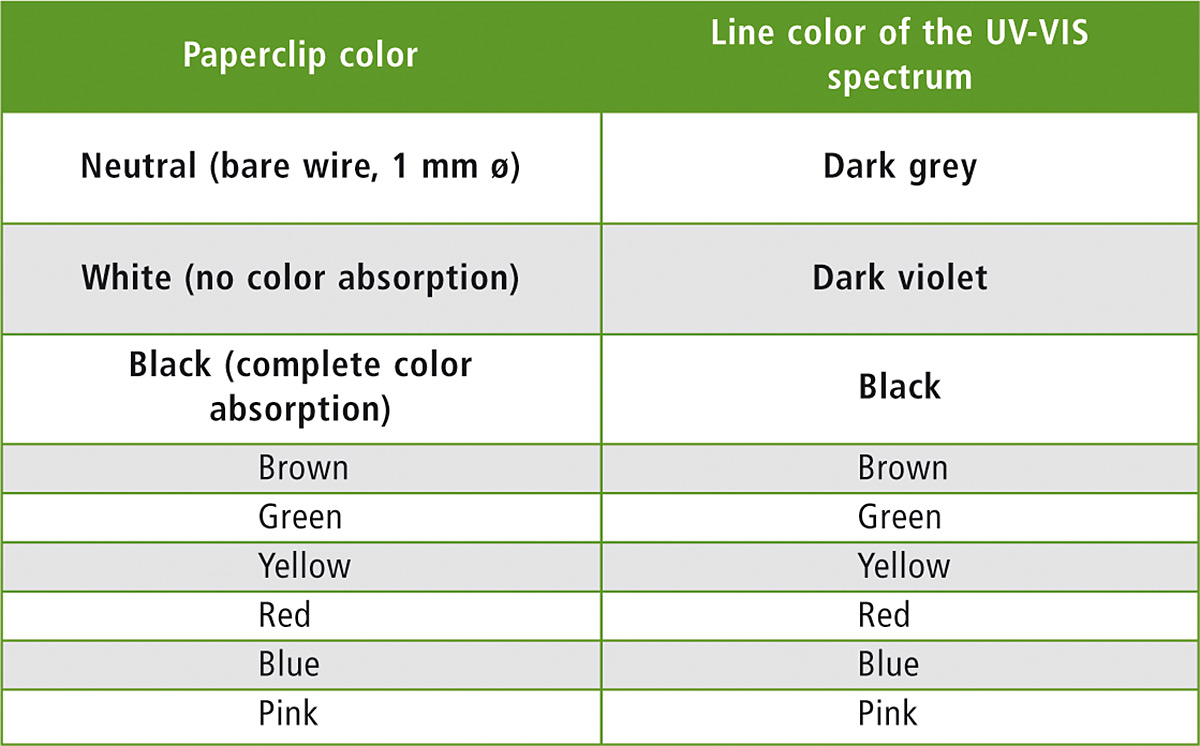 Table 1: Paper clips with a diameter of 1.25 mm and their colors, as well as the classification of the line colors as shown in Figure 4
For determination of the tristimulus value, the non-coated, black and white paper clips were excluded from the color value calculation because, according to physics and the spectral result, they do not show any color absorption. The other paper clip colors can be determined and are listed in table 2.
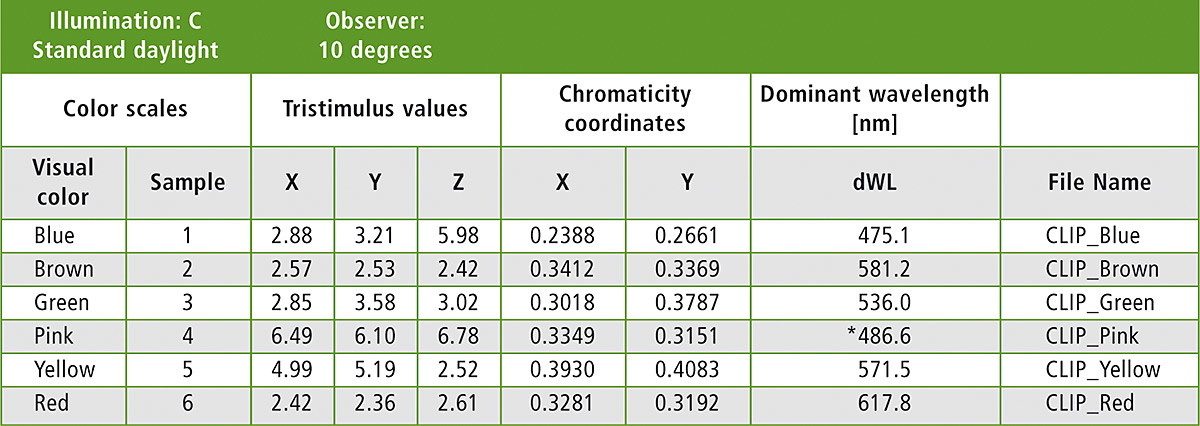 Table 2: Color analysis of the paper clip spectra using the color tables in accordance with CIE [1]
The dominant wavelength represents the visual colors. The green wire absorbs radiation at 536 nm, which corresponds to the color green. The pink paper clip is marked with an asterisk. The color absorption of this color is in the extreme violet and red spectral range, also called the ‘purple boundary’ or ‘line of purples’. Since the horseshoe-shaped chromaticity diagram cannot assign any analytical wavelengths in this range, the color lying opposite (complementary) in the diagram is assigned. In this example, it is the wavelength at 486.6 nm, which corresponds to a bluish-green color.
Result
The performance capability of UV-VIS spectroscopy is not limited to liquids. Solid samples with a diameter of three millimeters can be analyzed easily and quickly without sample destruction.
The colors of the materials used can be determined correctly for quality control. With this knowledge, it is easy to check everything involved in product manufacturing, from the colored raw material to the finished product and to adjust the production parameters.
Literature
[1] Colorimetry – Part 1: CIE standard colorimetric observers (ISO 11664-1:2007); German version EN ISO 11664-1:2011