Extra virgin olive oil: genuine or fake?
Reveal adulteration through FTIR spectroscopy
Consumer demands and their preoccupation with a rational and healthy diet require a high consumption of vegetable oils rich in unsaturated fatty acids. In Central and North European countries, this has led to increased imports of expensive oils. Extra virgin olive oil (EVOO) is one of the favorite products of European consumers. High prices of EVOO cause some producers and traders to focus on their partial or total substitution through cheaper oils (sunflower oil, soybean oil).
Establishing the authenticity of EVOO continues to be of great interest to scientists and consumers, and detecting adulteration of EVOO for economic gain is an ongoing concern for regulatory agencies. Many of the official methods used to detect adulteration of EVOO are labor intensive, time consuming and generally require more than one method. This study proposes a FTIR method without the need of sample preparation, to establish rapidly the authenticity of EVOO product.
Methods and materials
Mixtures of EVOO with maize oil, soybean oil and sunflower oil at various ratios (w/w) were measured using a Shimadzu IRAffinity-1S FTIR spectrometer and a single reflection diamond ATR attachment. The data collected were processed after performing ATR correction using 1,000 cm-1 as a reference wavenumber. The origin of oil samples was well known and the authenticity was checked with appropriate chromatographic methods.
Results and discussion
The FTIR spectra of EVOO, maize oil, sunflower oil and soybean oil are shown in figure 1. All of them are characterized by the same well evident peaks at 900 – 1,400 cm-1, 1,700 – 1,800 cm-1 and 2,800 – 3,100 cm-1. The spectral structure of edible oils is mainly due to lipid molecules containing fatty acids. The similarity of the spectra reflects the similarity in the chemical composition of these oils. Nevertheless, minor differences appear in a more detailed analysis in terms of small band shifts and of small differences in relative intensity.
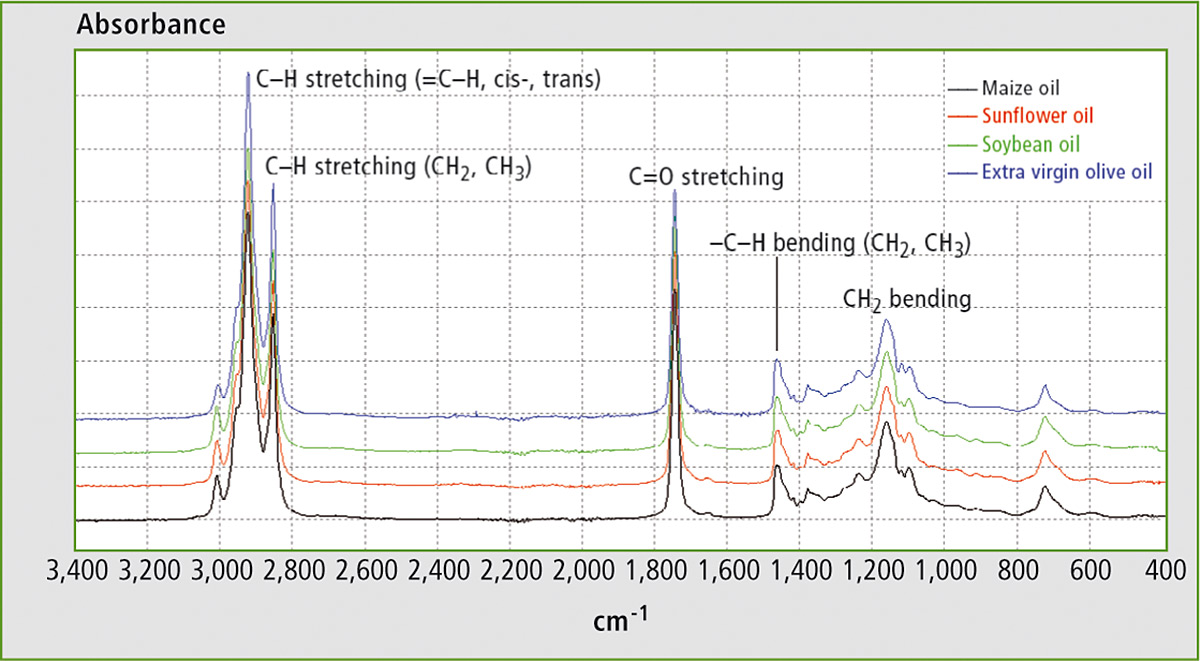 Figure 1: FTIR spectra of maize oil, soybean oil, sunflower oil and EVOO in the range 400 – 3.400 cm-1
With closer inspection of the FTIR spectra of these oils, some differences located at around 900 cm-1 are evident in figure 2. From the literature, it can be evinced that the band at ca. 914 cm-1 is related to the out-of-plane bending vibration of the =C–H group. This vibration is present due to trans-fatty acids, which are totally absent in EVOO but are present in all refined oils. Thus adulteration of EVOO with any of these seed oils can be determined by measuring the absorbance at ca. 914 cm-1.
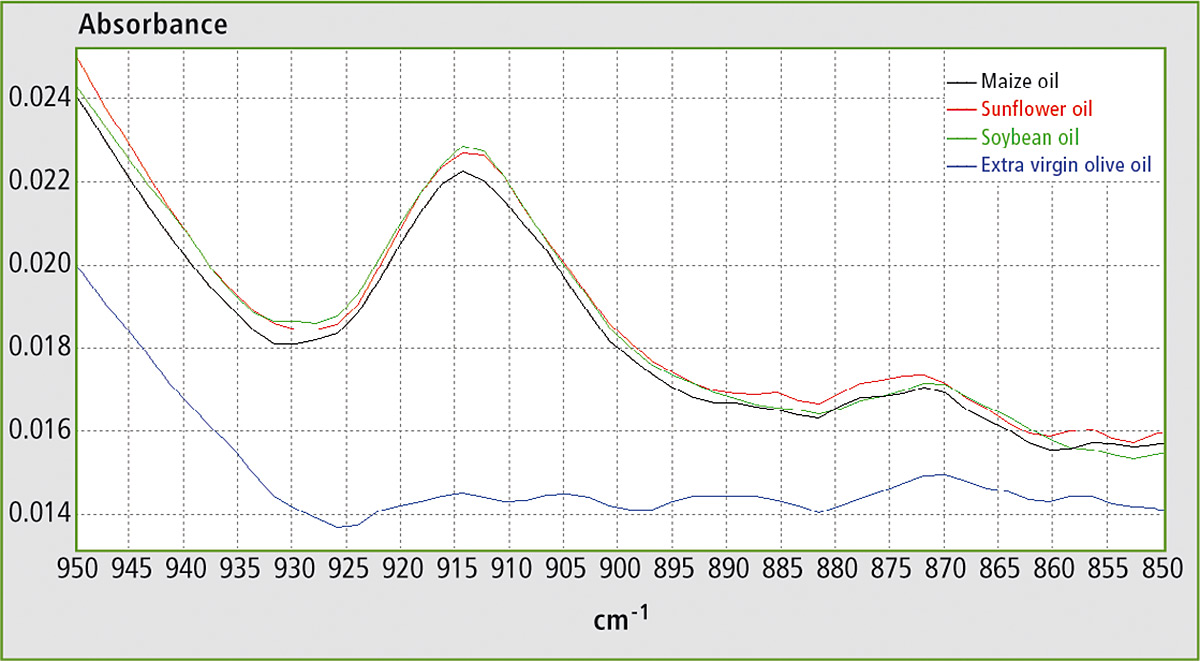 Figure 2: FTIR spectra of maize oil, soybean oil, sunflower oil and EVOO in the range 850 – 950 cm-1
In the FTIR spectra of EVOO, this band is best defined in the range from ca. 895 to 925 cm-1. By using the corrected area between 895 and 925 cm-1 for the determination (i.e. by setting the spectral points at 895 and 925 cm-1 as baseline points), the effects of the horizontal shifting of the band and of the vertical shifting of the baseline for different ratios of EVOO and adulterant are canceled.
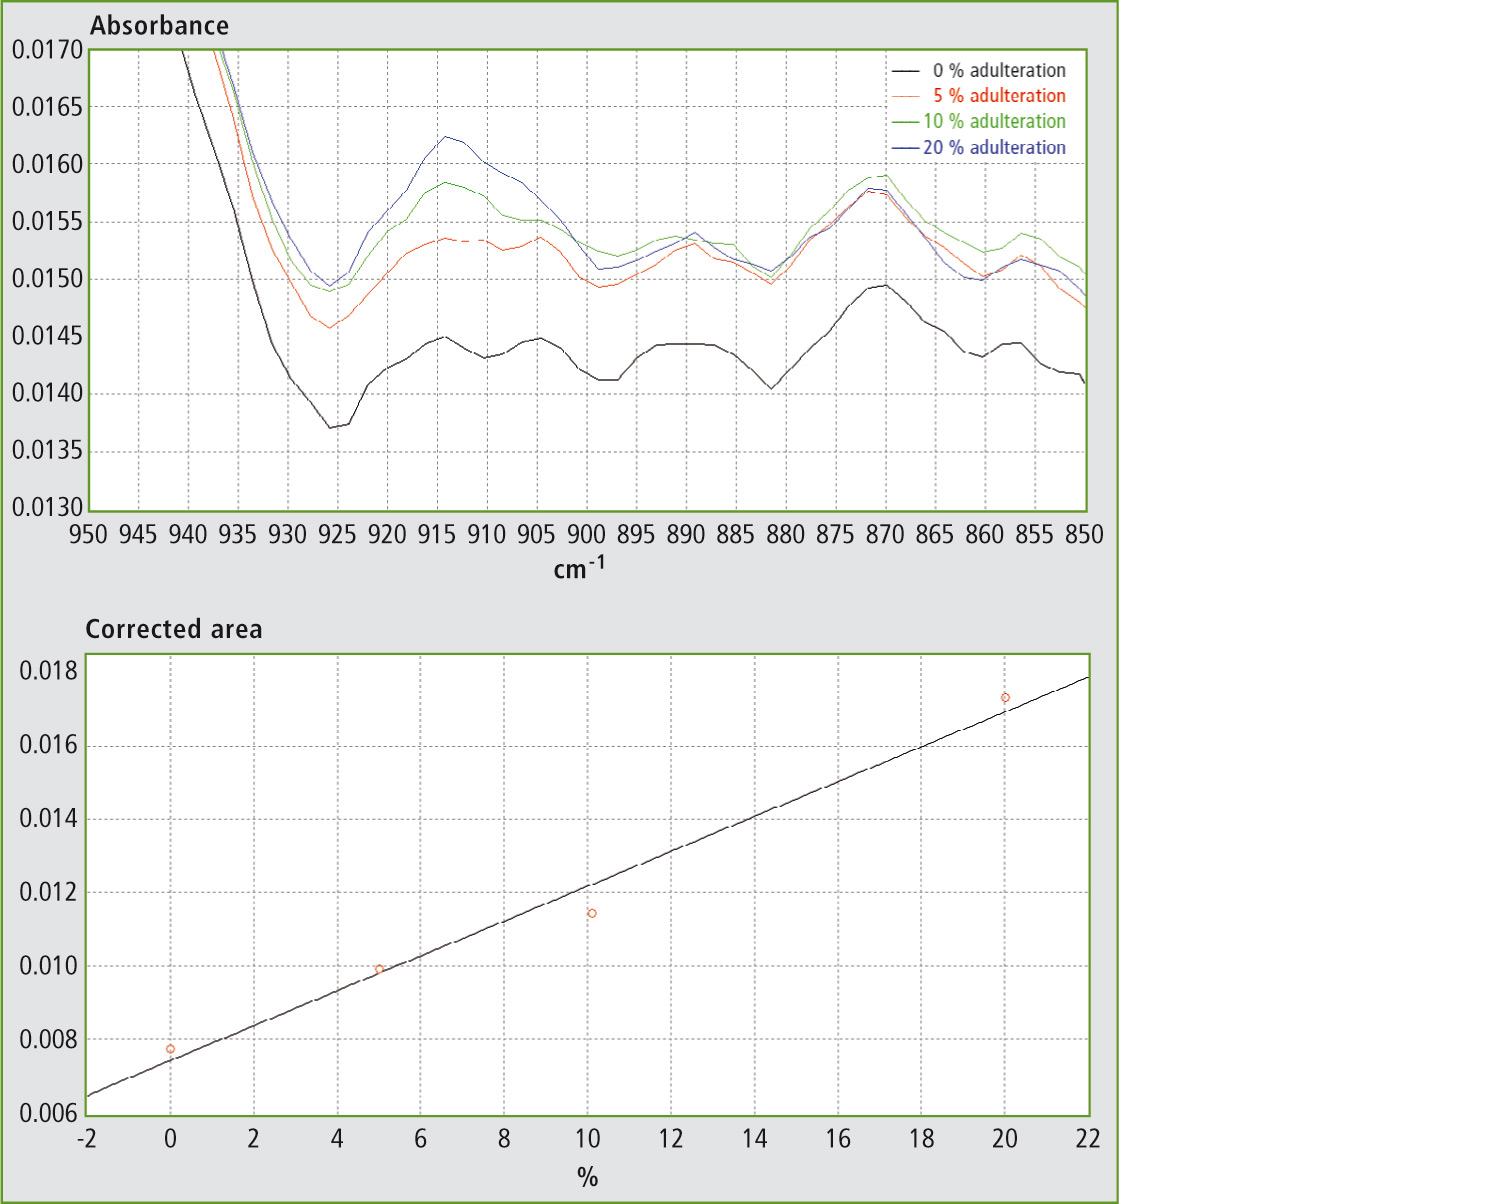 Figure 3a and 3b: FTIR spectra in the range 850 – 950 cm-1 and calibration curve for mixtures of EVOO with maize oil.
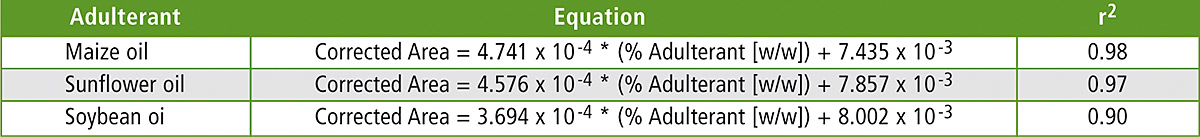 Table 1: Results of linear regression for mixtures of EVOO with maize oil, sunflower and soybean oil
 Table 2: Results of linear regression for mixtures of EVOO with maize oil, sunflower oil and soybean oil
Table 1 shows the results obtained using different mixtures (w/w) of EVOO with maize oil, sunflower oil and soybean oil. The relevant spectra and calibration curves for maize oil, sunflower oil and soybean oil are shown in figure 3, figure 4 and figure 5 respectively. It is noteworthy, not only that the results are linear, but also that a single calibration curve can be constructed for all of these adulterants (figure 6). The results are shown in table 2. The LOD and LOQ values determined based on the residual standard deviations of the overall regression line were 3 % and 9 % (w/w) respectively.
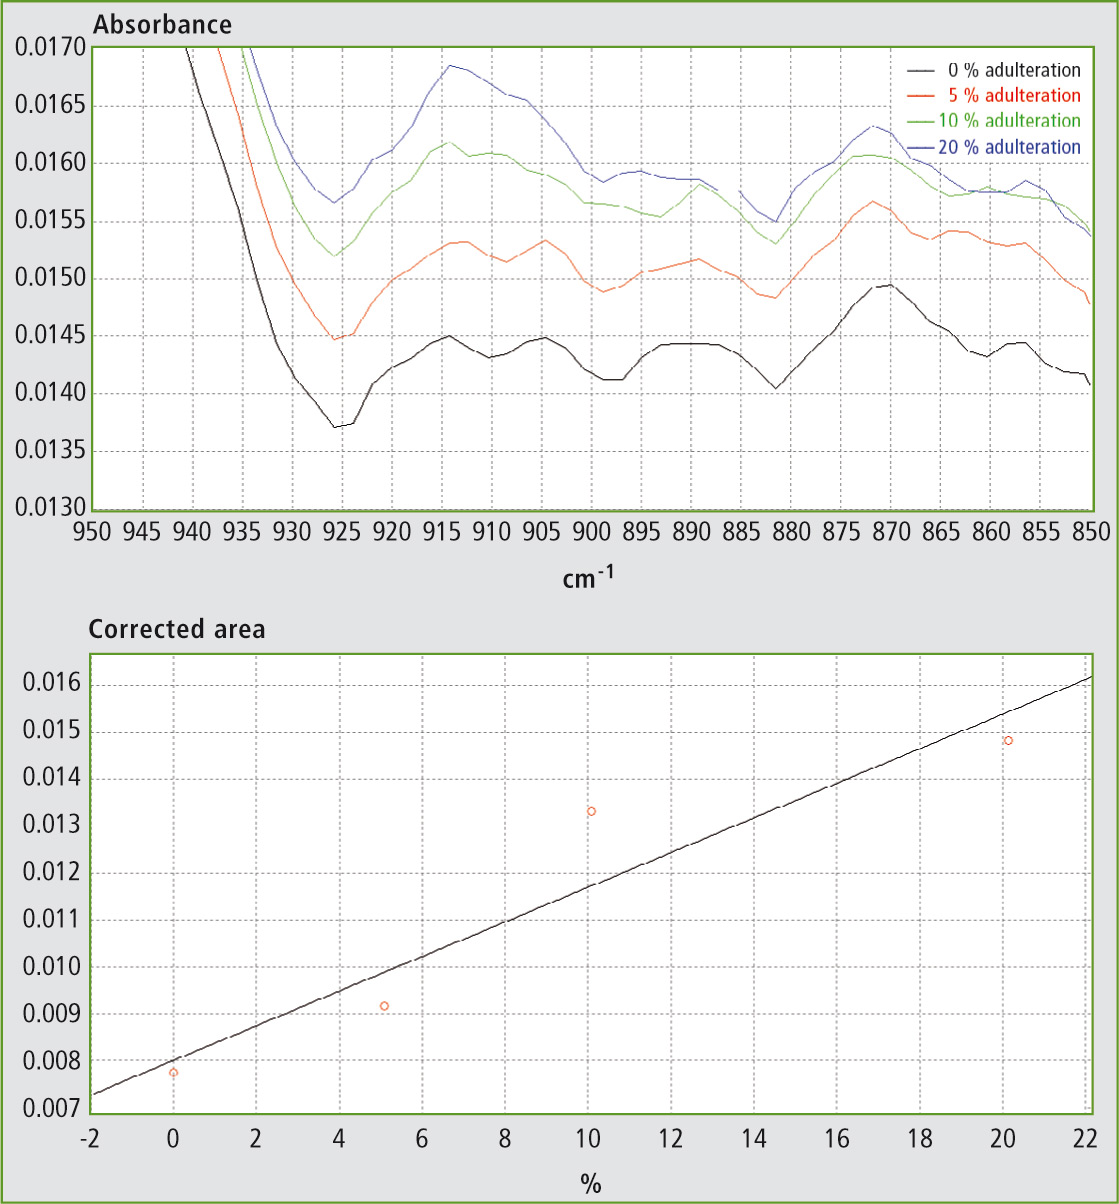 Figure 4a and 4b: FTIR spectra in the range 850 – 950 cm-1 and calibration curve for mixtures of EVOO with sunflower oil
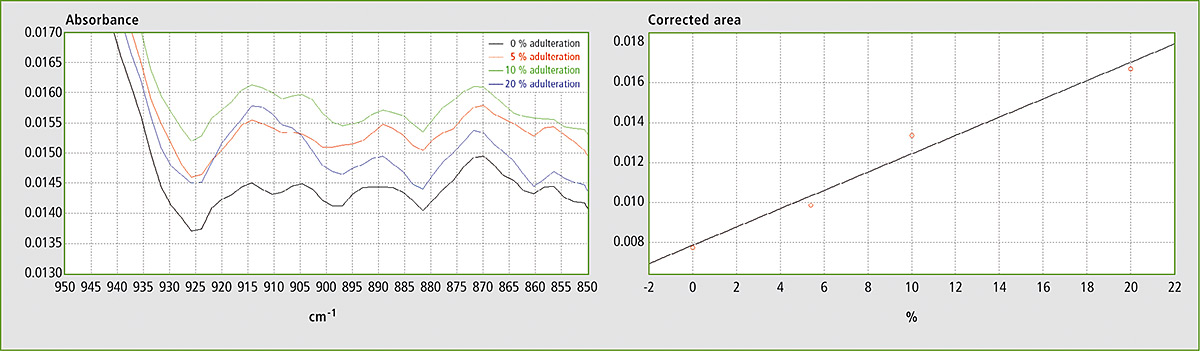 Figure 5a and 5b: FTIR spectra in the range 850 – 950 cm-1 and calibration curve for mixtures of EVOO with soybean oil
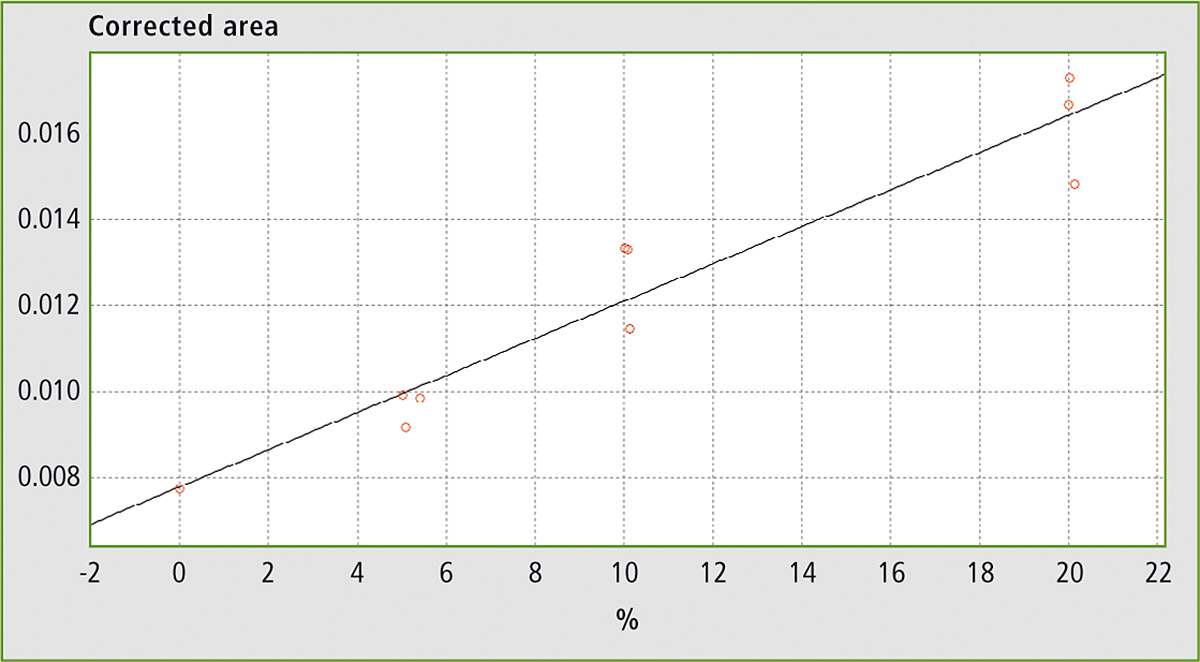 Figure 6: Calibration curve for mixtures of EVOO with maize oil, sunflower oil and soybean oil
Conclusions
FTIR spectroscopy provides a good means for the fast determination of adulteration of EVOO with maize oil, soybean oil and sunflower oil. The proposed method does not require sample preparation and eliminates the need for using organic solvents. The band at ca. 914 cm-1 is an excellent target for this determination since its data are linear and produce similar results for the adulteration of EVOO irrespective of the adulterant being used (maize oil, soybean oil or sunflower oil).
This method is suitable for detecting adulteration of EVOO down to 3 %. For lower detection limits, horizontal attenuated total reflection HATR or the classical transmission mode techniques may be used. Both need more sample preparation and solvents.
For sophisticated adulteration, official chromatographic methods or in-house developed methods from expert contract laboratories are more appropriate.
Authors
Manos Barbounis, Konstantinos Tampouris,
Dimitrios Georgantas, N. Asteriadis S.A.
Literature
[1] Olive oil adulteration sensing by FTIR and Raman spectroscopy, G. Giubileo, A. Puiu, S. Botti, G. Tarquini, and S. Nunziante Cesaro, ENEA, RT/2015/8/ENEA, ISSN/0393-3016.
[2] Application of FT-IR spectroscopy to assess the olive oil adulteration, M.-A. Poiana, G. Mousdis, E. Alexa, D. Moigradean, M. Negrea, and C. Mateescu, Journal of Agroalimentary Processes and Technologies, 2012, 18 (4), 277-282.
[3] Authentication of extra virgin olive oils by Fourier-transform infrared spectroscopy, M.J. Lerma-García, G. Ramis-Ramos, J.M. Herrero-Martínez and E.F. Simó-Alfonso, Food Chemistry, 2010, 118, 78-83.
[4] The use of FT-IR spectroscopy in the identification of vegetable oils adulteration, E. Alexa, A. Dragomirescu, G. Pop, C. Jian, and D. Dragos, Journal of Food, Agriculture and Environment, 2009, 7 (2), 20-24.
Application note:
SCA_110_017 Iodine number determination using FTIR-ATR-Spectroscopy