Rare earth salts prevent counterfeit money
High resolution spectra in diffuse reflectance for powder samples measured with integrating sphere in the UV-VIS-NIR range
Rare earth elements are located everywhere, but are seldom concentrated in significant amounts at one point (rare earth); their extraction is time-consuming and expensive. Rare earths include 17 elements belonging mainly to the group of Lanthanides. They are used in various industries such as illuminants, magnets, glasses, catalytic converters, polishes and in metallurgy. A short approximation is given in an article from BGR in 2009 [1]. The pie chart shows the distribution of rare earth elements over various industries. In many industrial applications the earth element used to color a target object specifically or even make it unique.
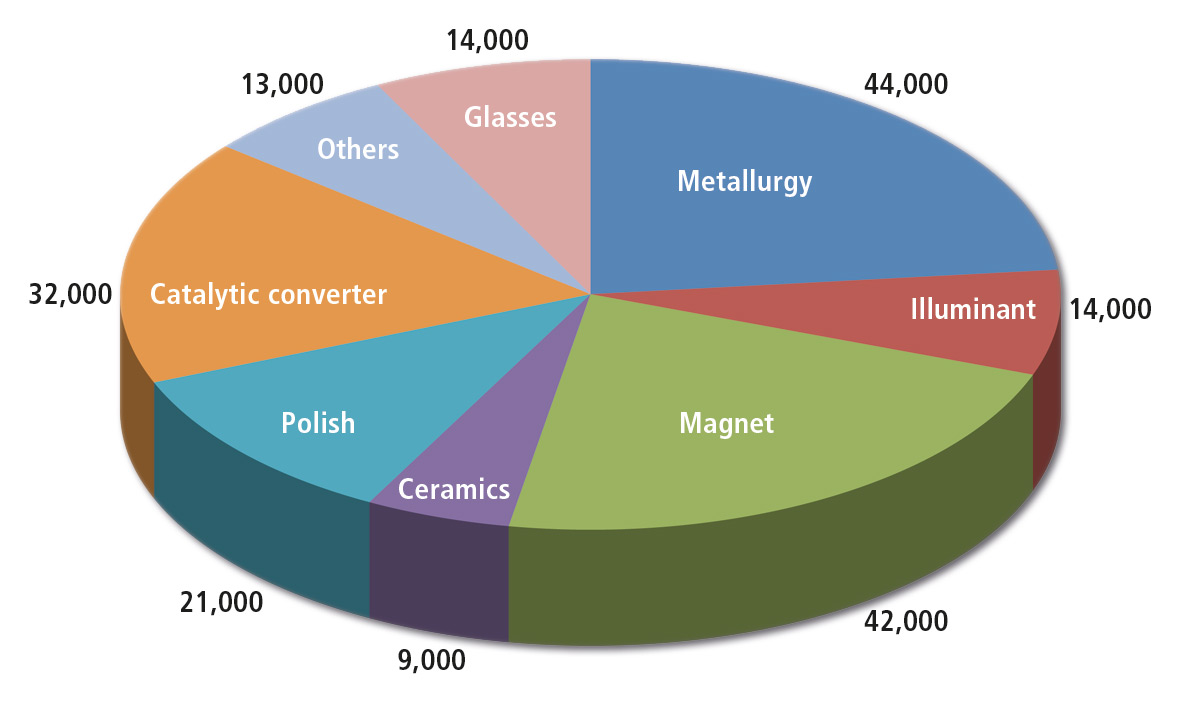 Figure 1: Usage of rare earth metals in t (REO) and by commercial use 2012 (Total consumption 189,000 t approximately) [1], source Kingsnorth (2007)
Figure 1 does not include niche markets or applications. One such use can be the coloring of paper, e.g. banknotes. Paper money is copied very often. One attempt to solve this problem applies the use of colors which are unique and difficult to prepare. This can be achieved using rare earth salts. Their structures bear a unique color. Small changes in the crystal configuration will change the appearance. This application shows the effect of different Neodymium and Samarium salts in UV-VIS spectroscopy.
Rare earth salts are a product’s finger prints
The salts from the rare earth elements form UV-VIS spectra which have similarities to the so called “finger print” range of the mid infrared spectra. Normally, the UV spectrum of liquids forms broad signals with low resolution. High resolution in a UV-VIS spectrum is expected with gas phase spectra such as the benzene gas phase or for the well-known mercury, deuterium or halogen iodide lamps. In this case, the sample was a solid in powder form pressed behind a quartz window and diluted with BaSO4. Even under this condition, the salts form a fingerprint spectrum in the UV-VIS range. The signals reflect not only colors but also energy transfer transitions from the salt pattern. The energy modes shown are characteristic for the lattice or crystal form. They are probably so unique that a specific identification is possible.
Due to the rough surface of a powder, the ISR-3100 integrating sphere was used for the analysis. The integrating sphere collects diffuse reflected light from the powder surface. The sphere has a size of 60 mm, and the diffuse reflectance can be measured.
The sample is placed for this purpose in the 0 degree position at the sphere. Under this condition specular reflected light is excluded from the measurement, and only diffuse reflectance is measured.
In this case, the possibility of obtaining a 1 nm resolved spectrum depends on a good response from the material. Looking at the range of 520 to 550 nm shows substructures in high resolution.
Figure 2 includes two spectra in different resolutions. The red and green colored lines are the 5 nm and 1 nm spectra respectively. In the case of a signal group, the resolution can be shown.
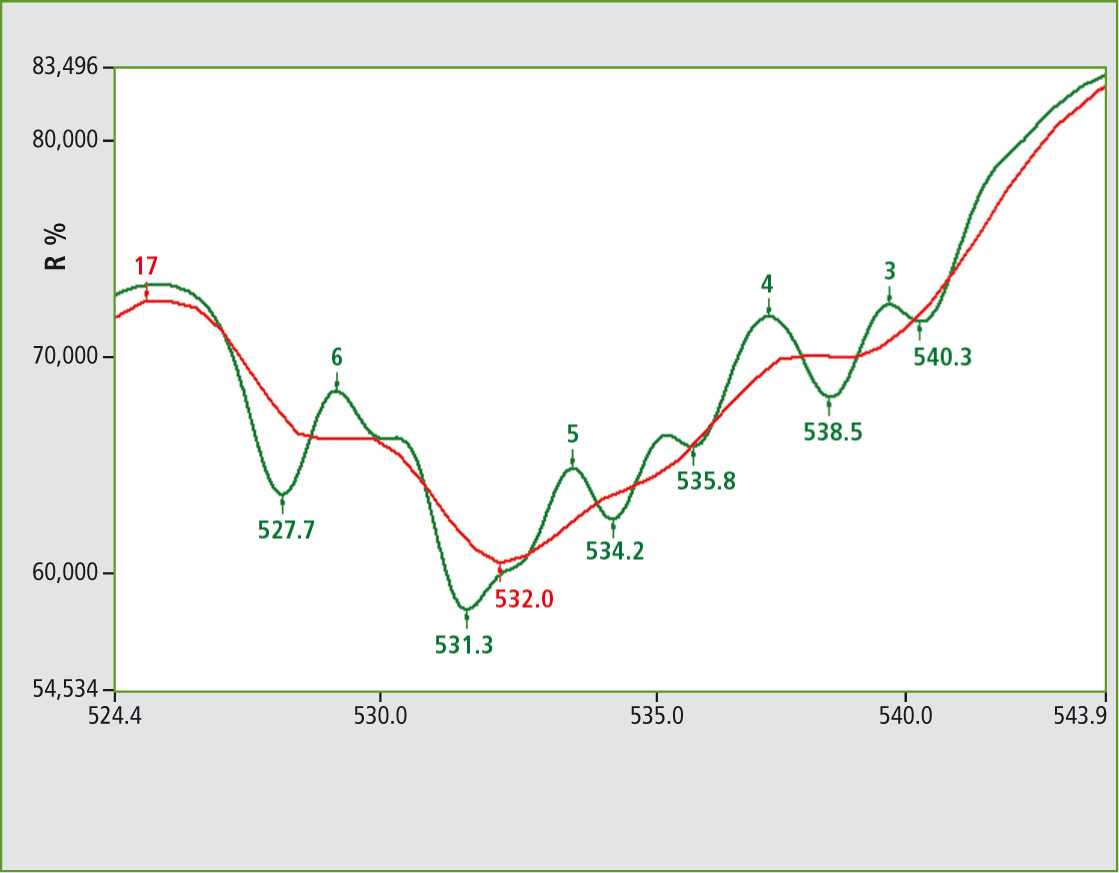 Figure 2: UV-VIS spectra from NdVO4 powder under conditions of 1 nm (green) and 5 nm (red) color. The identification and uniqueness of such substances is of interest. A target application is to prevent copying of the printed graphics on currency.
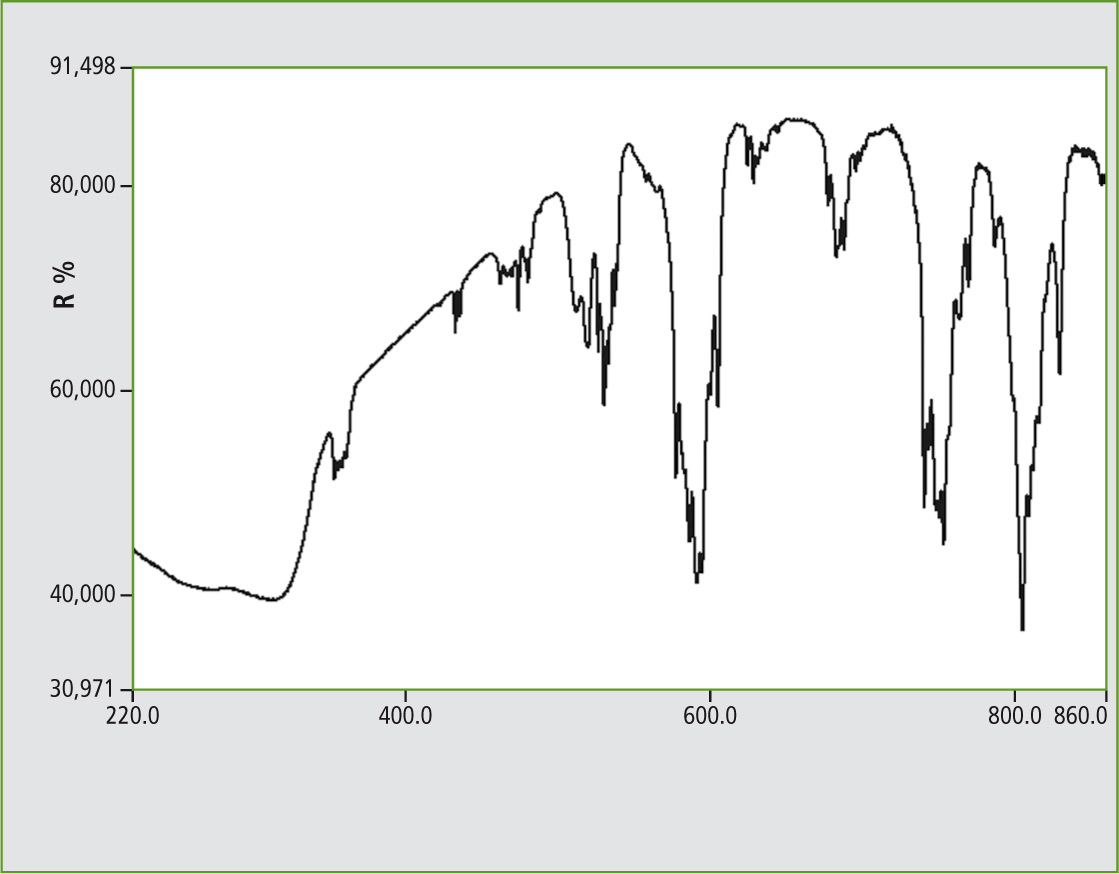 Figure 3: UV-VIS Reflectance spectrum of Neodymium vanadate, 1 nm slit width, ISR-3100 with three detectors, range 220 to 860 nm
The Neodymium salt yielded successful spectra with many signal groups. For reference, NdPO4 and (for the Lanthanide Group) a Samarium vanadate spectra are presented.
Homogeneous sample in short time
Sample preparation was completed in short time. The salts were in a ratio of 1:10 volume percent diluted with BaSO4. The powder mixture was transferred into a cup with quartz window. The cup was closed using manual pressure onto the sample mixture to generate a homogeneous layer, pressed with even distribution of the sample over the quartz window.
Objective was to create a homogeneous surface of the sample. The cup was placed into the sample position at the integrating sphere. As reference a cup filled with BaSO4 only was used. The ISR-3100 integrating sphere (with three detectors) was equipped with PM, InGaAs, and PbS detectors for the complete range of UV-VIS-NIR.
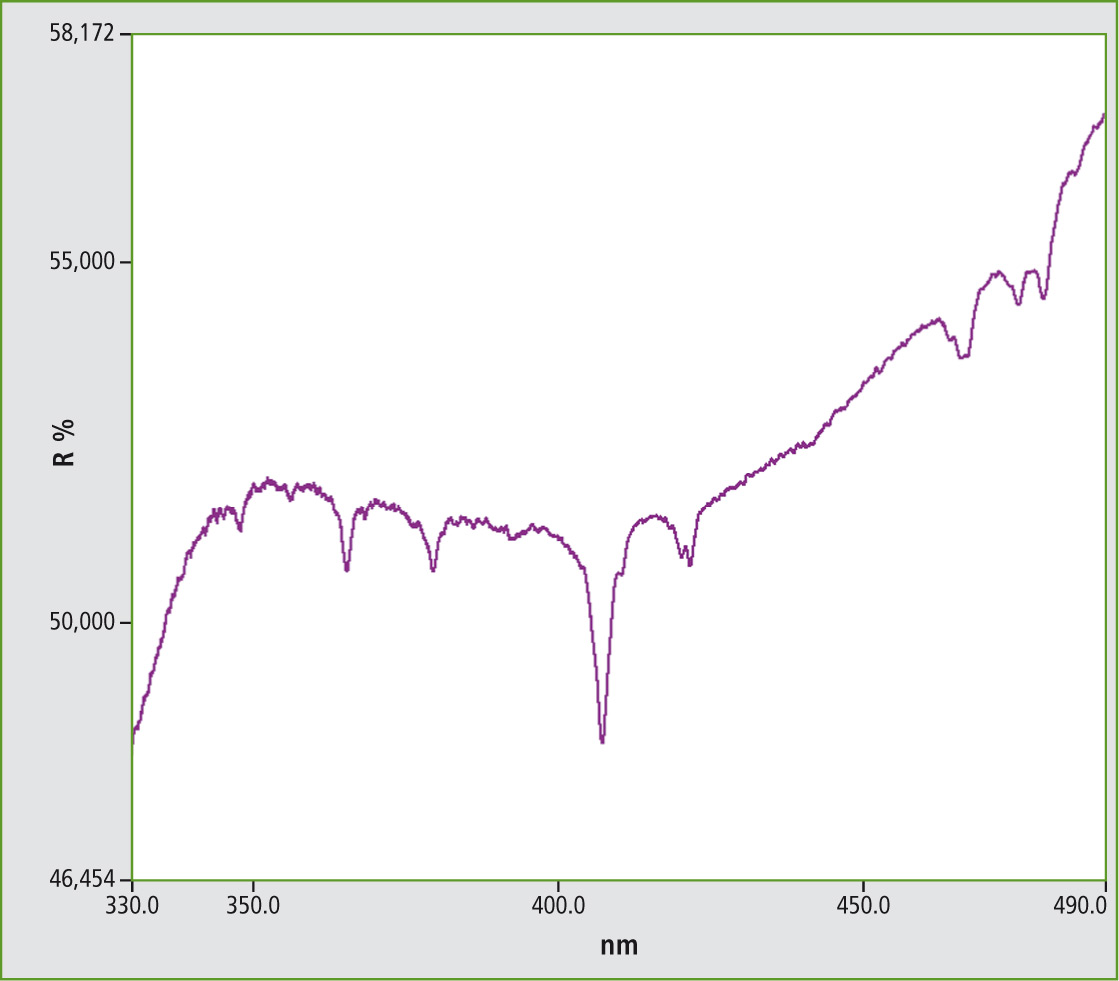 Figure 4: UV-VIS spectrum from Samarium vanadate measured under conditions of diffuse reflectance (SmVO4)
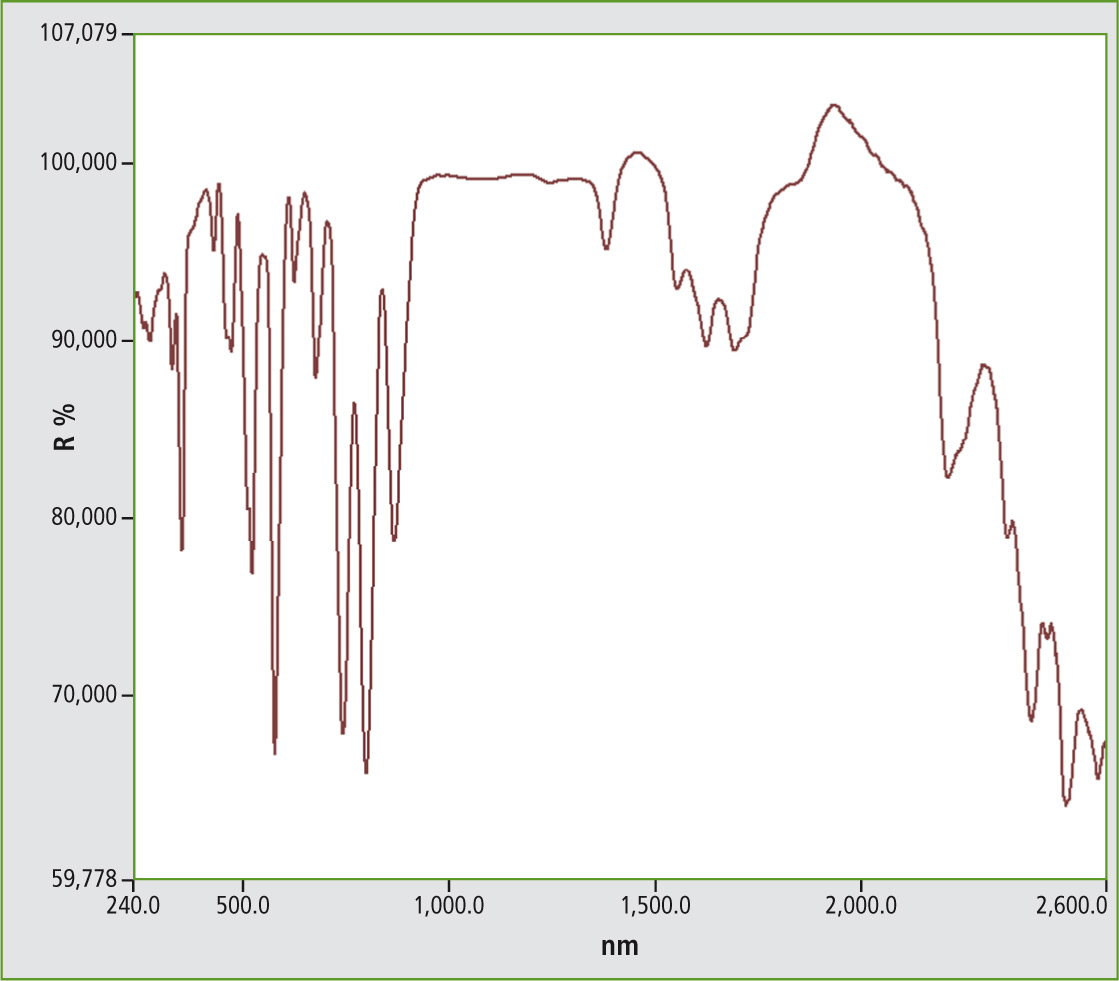 Figure 5: UV-VIS NIR spectrum from Neodymium phosphate NdPO4, 5 nm measurement in the range from 240 to 2,600 nm
The benefits of such rare earth salts are the uniqueness of the crystal lattice which forms a spectrum in the visible range dependent on the lattice. Charge transfer transitions are mainly measured. The color of the material depends on all of these characteristics, thereby being unique. Identification can be done using UV-VIS-NIR spectroscopy.
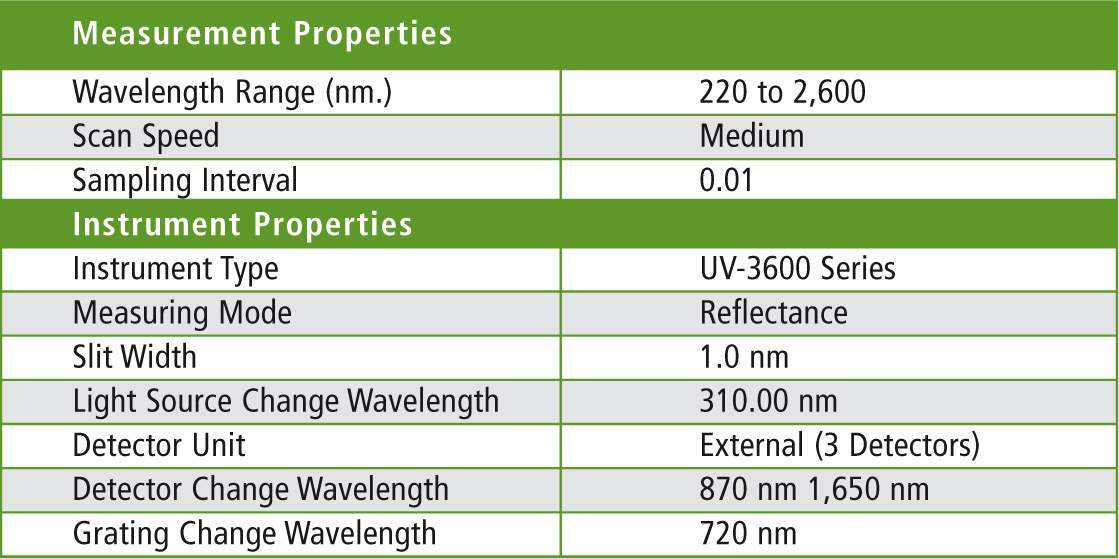 Table 1: Parameter settings for the UV-3600
Literature
[1] Seltene Erden; Maren Liedtke, Harald Elsner
Acknowledgment
Many thanks to Prof. Dr. Robert Glaum (Inorganic Chemistry Department at the University of Bonn) for the neodymium and samarium salts and the discussions regarding this topic.