Less expensive with easier handling
Analysis of dioxins in foods and feeds using GC-MS/MS
 GCMS-TQ8050 NX
Persistent organic pollutants (POPs) are semi-volatile and can be detected worldwide, even in remote regions. They bioaccumulate with potential negative influence on environment and human health. To a varying degree, these organic compounds resist photolytic, biological and chemical degradation.
POPs in foods and feeds can be analyzed with several methods. Dioxins are particularly toxic even for POPs, so quantitative analysis is required down to low concentrations. Until recently, the analysis of dioxins was performed using high-resolution GC-HRMS, which provides highly accurate quantitation. However, triple quadrupole GC-MS/MS is less expensive and easier to handle than GC-HRMS, so its use is increasingly being investigated.
In recent years, the quantitative accuracy of GC-MS/MS has improved significantly. Accordingly, the use of this analysis method has been officially recognized in the EU (EU589/2014, 644/2017). However, to change from GC-HRMS to GC-MS/MS it is necessary to compare their respective quantitative abilities.
The Shimadzu GCMS-TQ8050 NX triple quadrupole mass spectrometer uses a high-sensitivity detector, capable of detection at femtogram order concentrations, enabling the analysis of dioxins in foods and feeds. Additionally, the “GC-MS/MS Method Package for Dioxins in Foods” consists of method files registered with optimal conditions for the analysis of dioxins, as well as a report creation tool which documents the items required by EU regulations.
In this article, dioxins (polychlorinated dibenzo-p-dioxin (PCDD) and polychlorinated dibenzofuran (PCDF) only) were analyzed in 44 types and 200 samples of foods and feeds using the GCMS-TQ8050 NX in combination with the method package. Additionally, GC-MS/MS analysis results were compared with those from GC-HRMS in order to evaluate the quantitative capabilities of both techniques.
Method files for the analysis of dioxins
The features of the “EU Regulation Compliant GC-MS/MS Method Package for Dioxins in Foods” are shown below.
- Method files registered with optimal conditions for the analysis of dioxins.
- Retention times and time programs can be adjusted automatically, even when the retention times for the measured compounds change, such as when conducting maintenance of the column tip.
- A report creation tool is included in this product. It can automatically create reports showing items required by EU regulations.
Experiment
For the various food samples, pretreatment was performed using an automatic pretreatment unit (extraction: SpeedExtractor [BUCHI]; purification: GO-xHT [Miura Co., Ltd.]). 10 uL of Nonane was used as final solvent for the samples. For the standard, a mixture of DF-ST and DF-LCS from Wellington Laboratories was used. In terms of the analytical conditions for GC-MS/MS, the conditions registered in the method package were used. Analytical conditions in detail are shown in table 1.
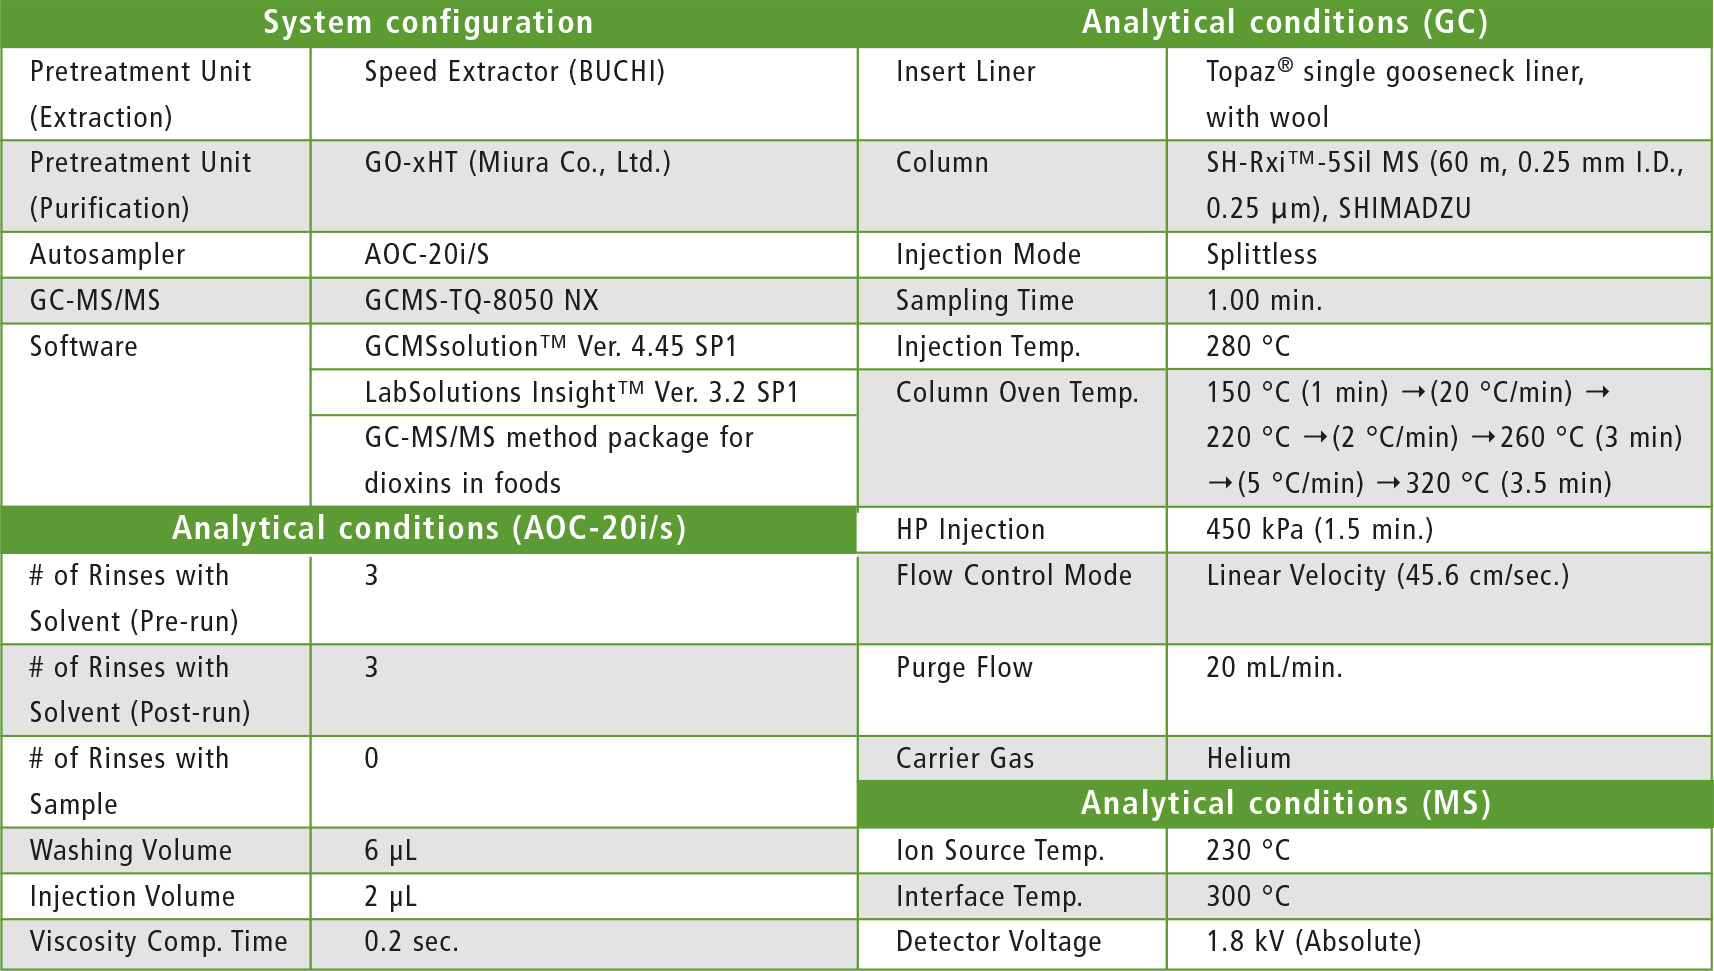 Table 1: GC-MS/MS analytical conditions
Analysis results for the standards
In the analysis of dioxins in foods, Maximum Levels (ML) are prescribed for each sample. With the food and feed samples in this investigation, ML for pig fat and pig meat were the lowest at 1 pg/g of fat. Additionally, the limit of quantitation (LOQ) required for each compound in the analysis depends on the sample’s ML, the pretreatment method and the TEF (toxic equivalence factor) of each compound.
The compounds 2,3,7,8-Tetrachlorodibenzo-p-dioxin and 1,2,3,7,8-Pentachlorodibenzo-p-dioxin have the highest TEF (TEF = 1), requiring lower LOQs than other compounds. In this investigation, the LOQ for both dioxins in pig fat and pig meat was 0.060 pg/uL at the concentration in the final vial.
S/N Ratio (hereinafter »Method 1«)
The concentration of an analyte in the extract of a sample which produces an instrumental response at two different ions to be monitored with an S/N (signal/noise) ratio of 3:1 for the less intensive raw data signal.
Lowest concentration point on the calibration curve (hereinafter »Method 2«)
The lowest concentration point on a calibration curve that gives an acceptable (≤ 30 %) and consistent (measured at least at the start and at the end of an analytical series of samples) deviation from the average relative response factor calculated for all points on the calibration curve in each series of samples. In this technical report, for the purposes of confirmation, an evaluation was performed using both criteria.
As noted above, for 2,3,7,8-Tetrachlorodibenzo-p-dioxin it is necessary to set the LOQ to 0.060 pg/uL or less. Accordingly, the STD was prepared so that the concentration of each compound was 0.050 pg/uL (for Octachlorodibenzo-p-dioxin and Octachlorodibenzofuran 0.100 pg/uL). From the results of the analysis, it was evident that the criteria for method 1 were satisfied for all compounds. S/N ratios for each compound are shown in figure 1 and table 2.
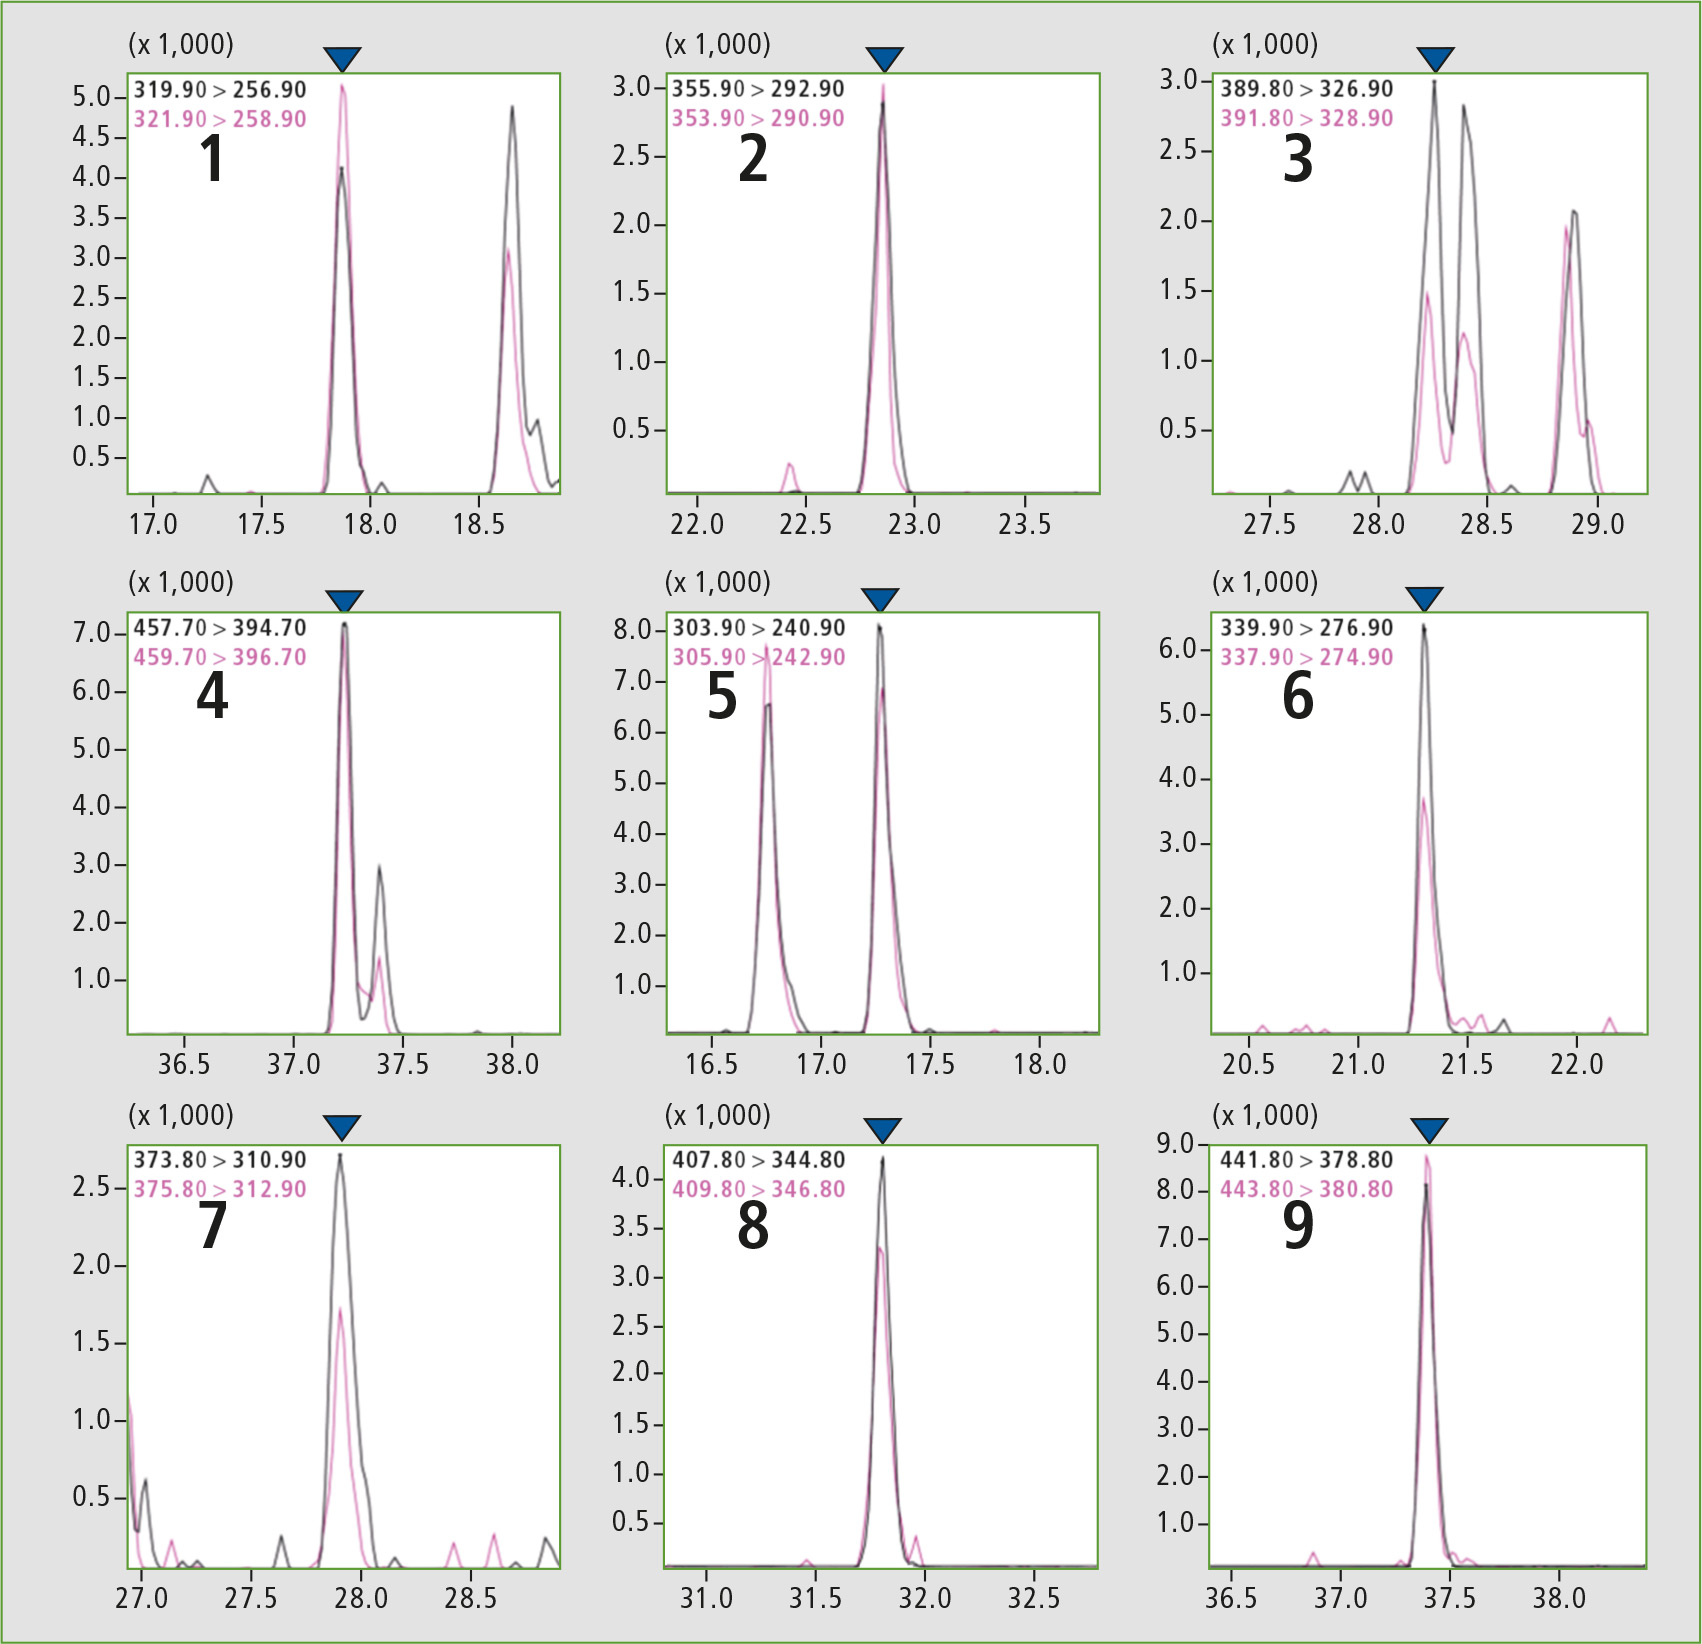 Figure 1: GCMS chromatograms for a concentration of 0.050 pg/uL
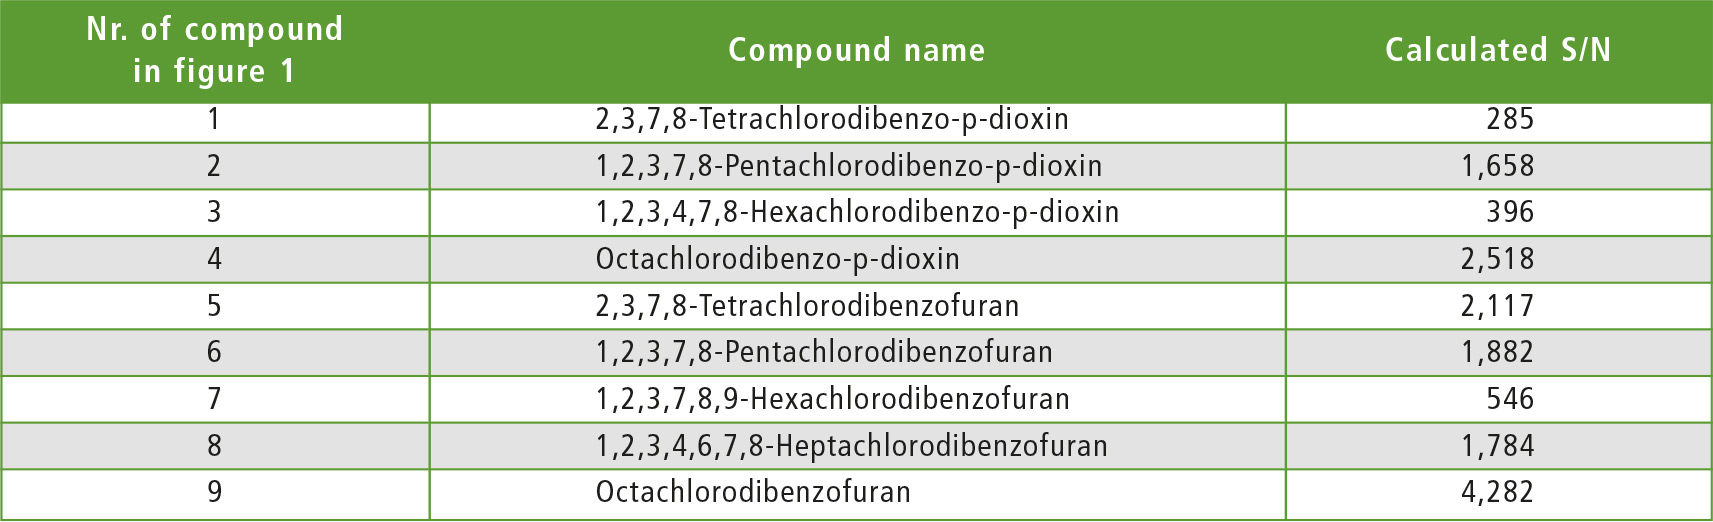 Table 2: S/N results for standards according to method 1
Additionally, with method 2, a calibration curve was created with all six levels used, including 0.025 pg/uL, 0.050 pg/uL, 0.100 pg/uL, 0.250 pg/uL, 0.500 pg/uL and 1 pg/uL. The concentrations for each compound at each calibration curve point (level) are shown in table 3. For each compound, when the level 1 RRF and average RRF were compared, it was found that all compounds satisfied the criteria for method 2. From the above-mentioned results, it was evident that at the LOQ, the criteria were satisfied for all compounds.
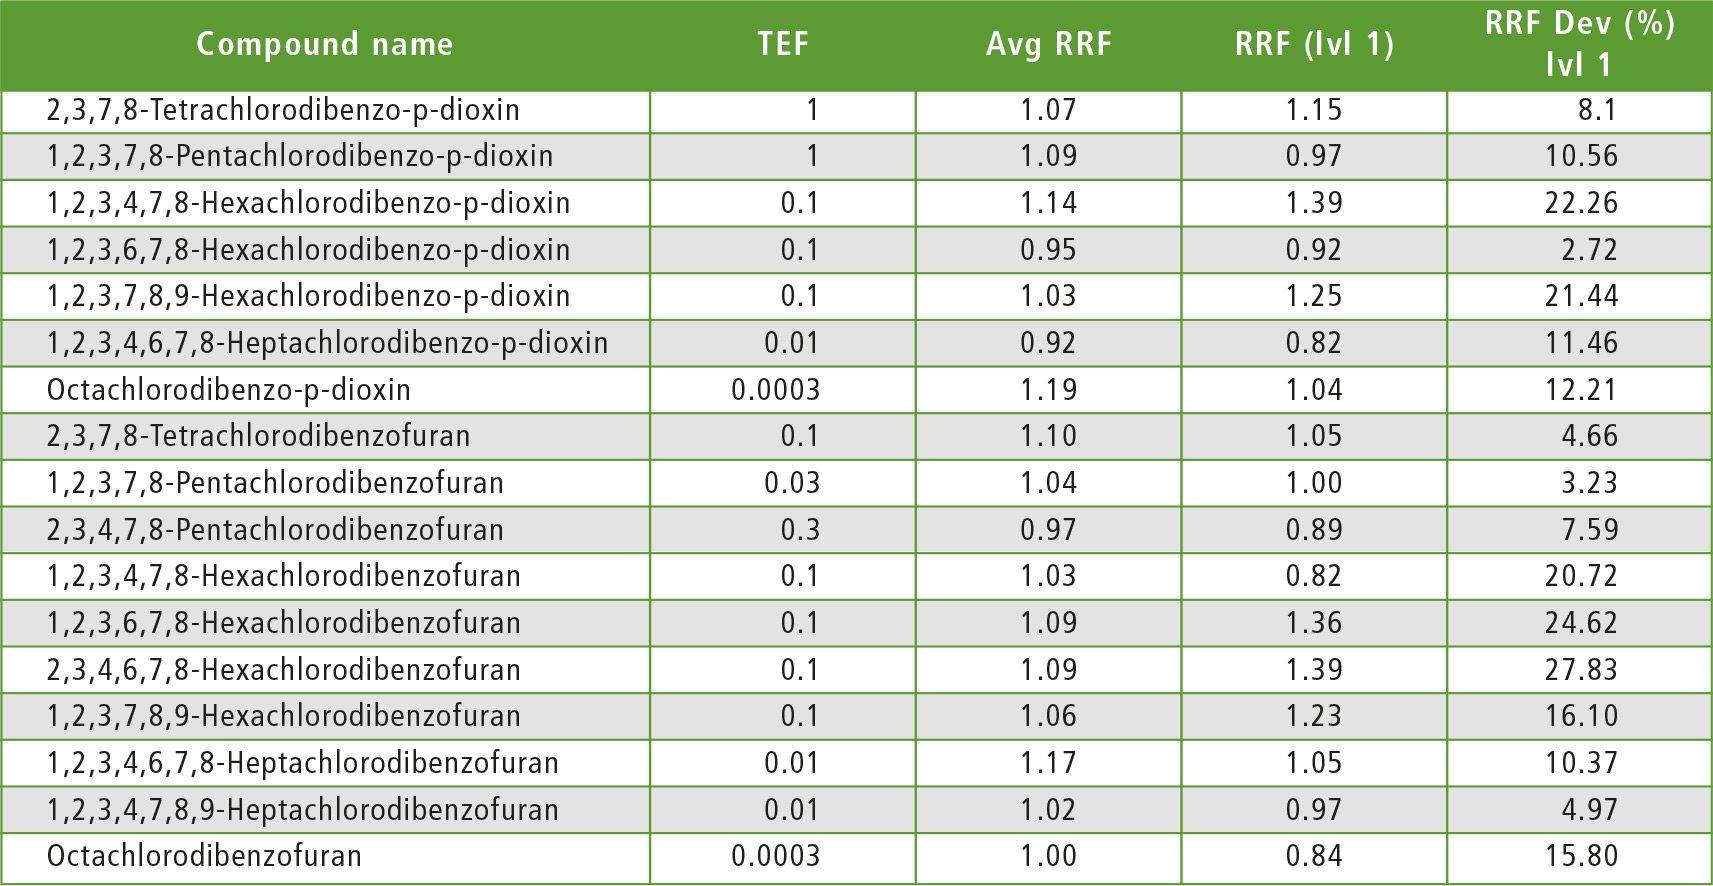 Table 3: Each calibration point concentration and RRF for the measured compounds
Analysis results for the test samples
As previously noted, the level of toxicity differs for each dioxin compound. The TEF, calculated for each compound by taking the toxicity of 2,3,7,8-Tetrachlorodibenzo-p-dioxin as 1, is used as an index of strength. The TEF values for each compound are shown in table 3. The ML for the dioxins in foods and feeds are prescribed by their toxic equivalents (TEQ). The TEQ is calculated by multiplying the concentration of each compound by the TEF and then calculating the total TEQ for all compounds.
Figure 2 shows a comparison of the TEQ values for GC-MS/MS and GC-HRMS for food samples. A TEQ of 0.060 pg/ uL (red line) and a TEQ of 0.025 pg/uL (green line) are marked as indicators for the samples.
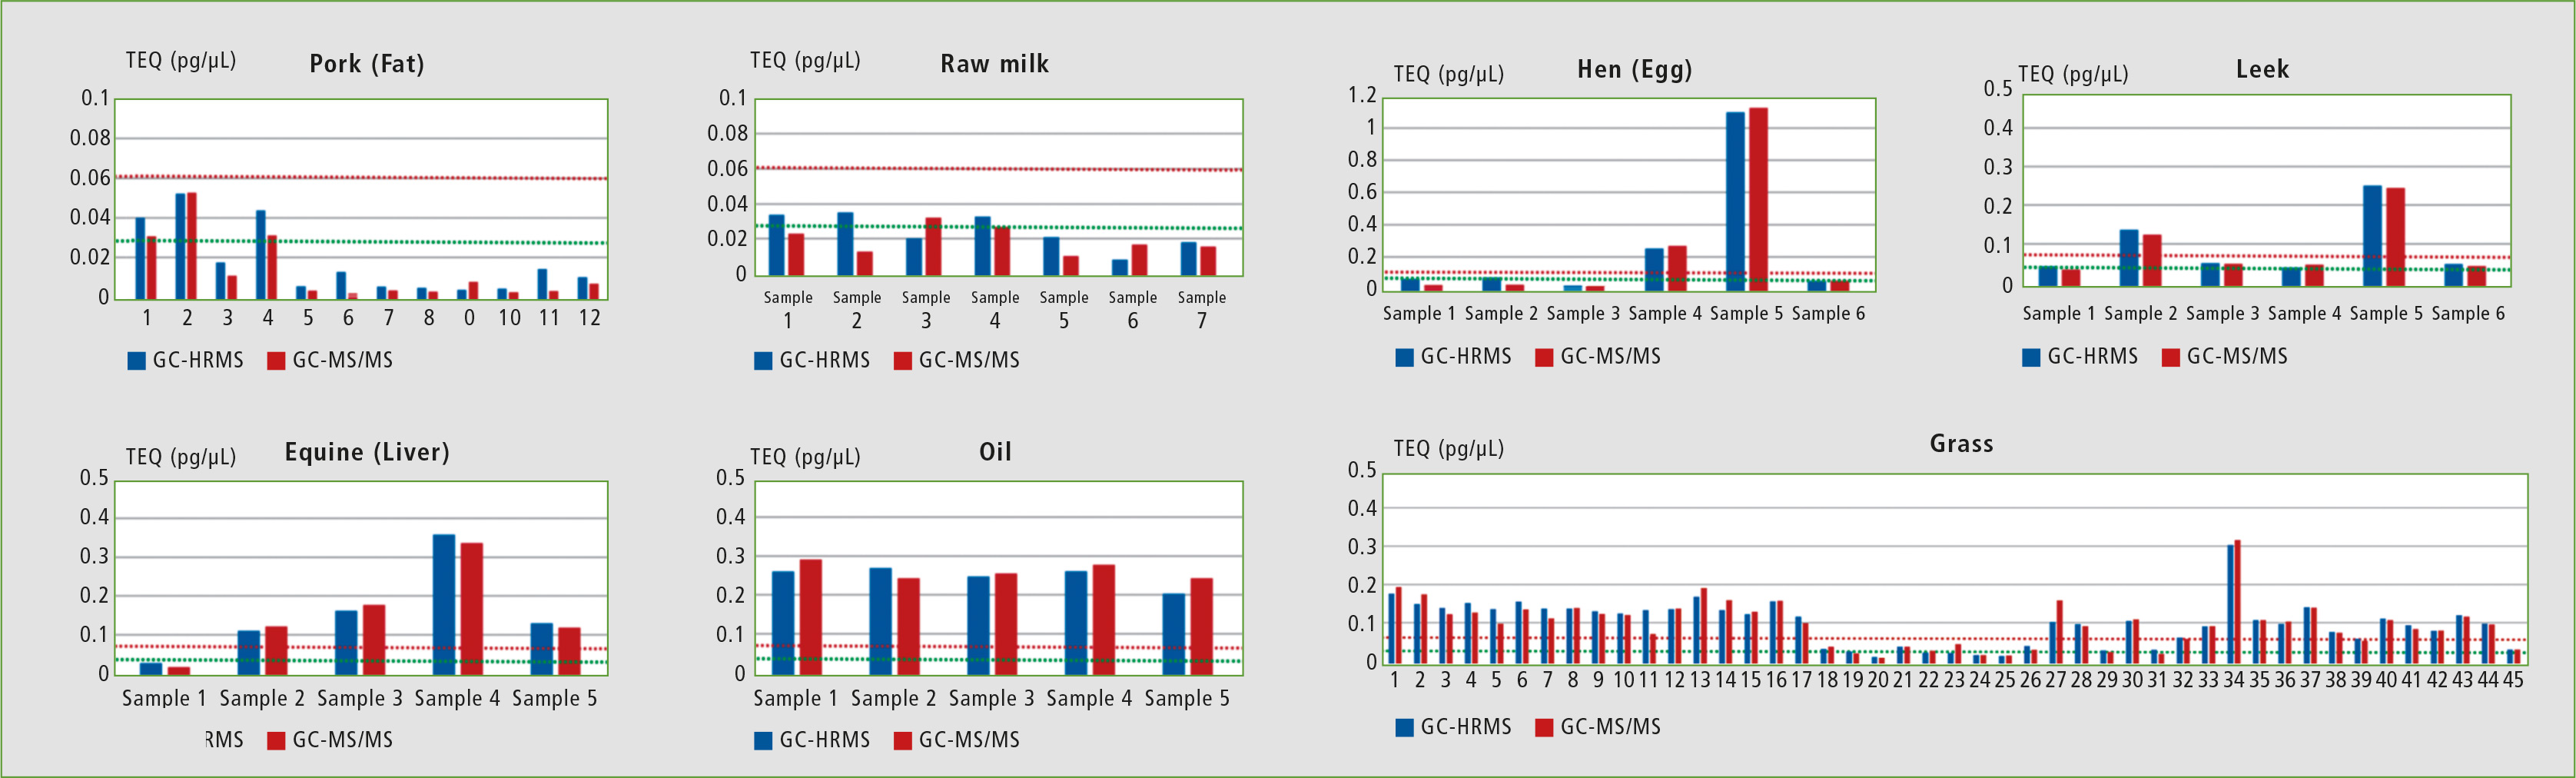 Figure 2: Comparison of the TEQ results for each food and feed
Conclusion
In this technical report, dioxins were analyzed in 44 types and at least 200 samples of foods and feeds using the GCMS-TQ8050 and the “EU Regulation Compliant GC-MS/MS Method Package for Dioxins in Foods.” Additionally, the GC-MS/MS analysis results were compared with the analysis results from GC-HRMS in order to assess the quantitative capabilities of both methods. Before analyzing, a STD was measured using GC-MS/MS, and it was confirmed that the criteria were satisfied at the LOQ.
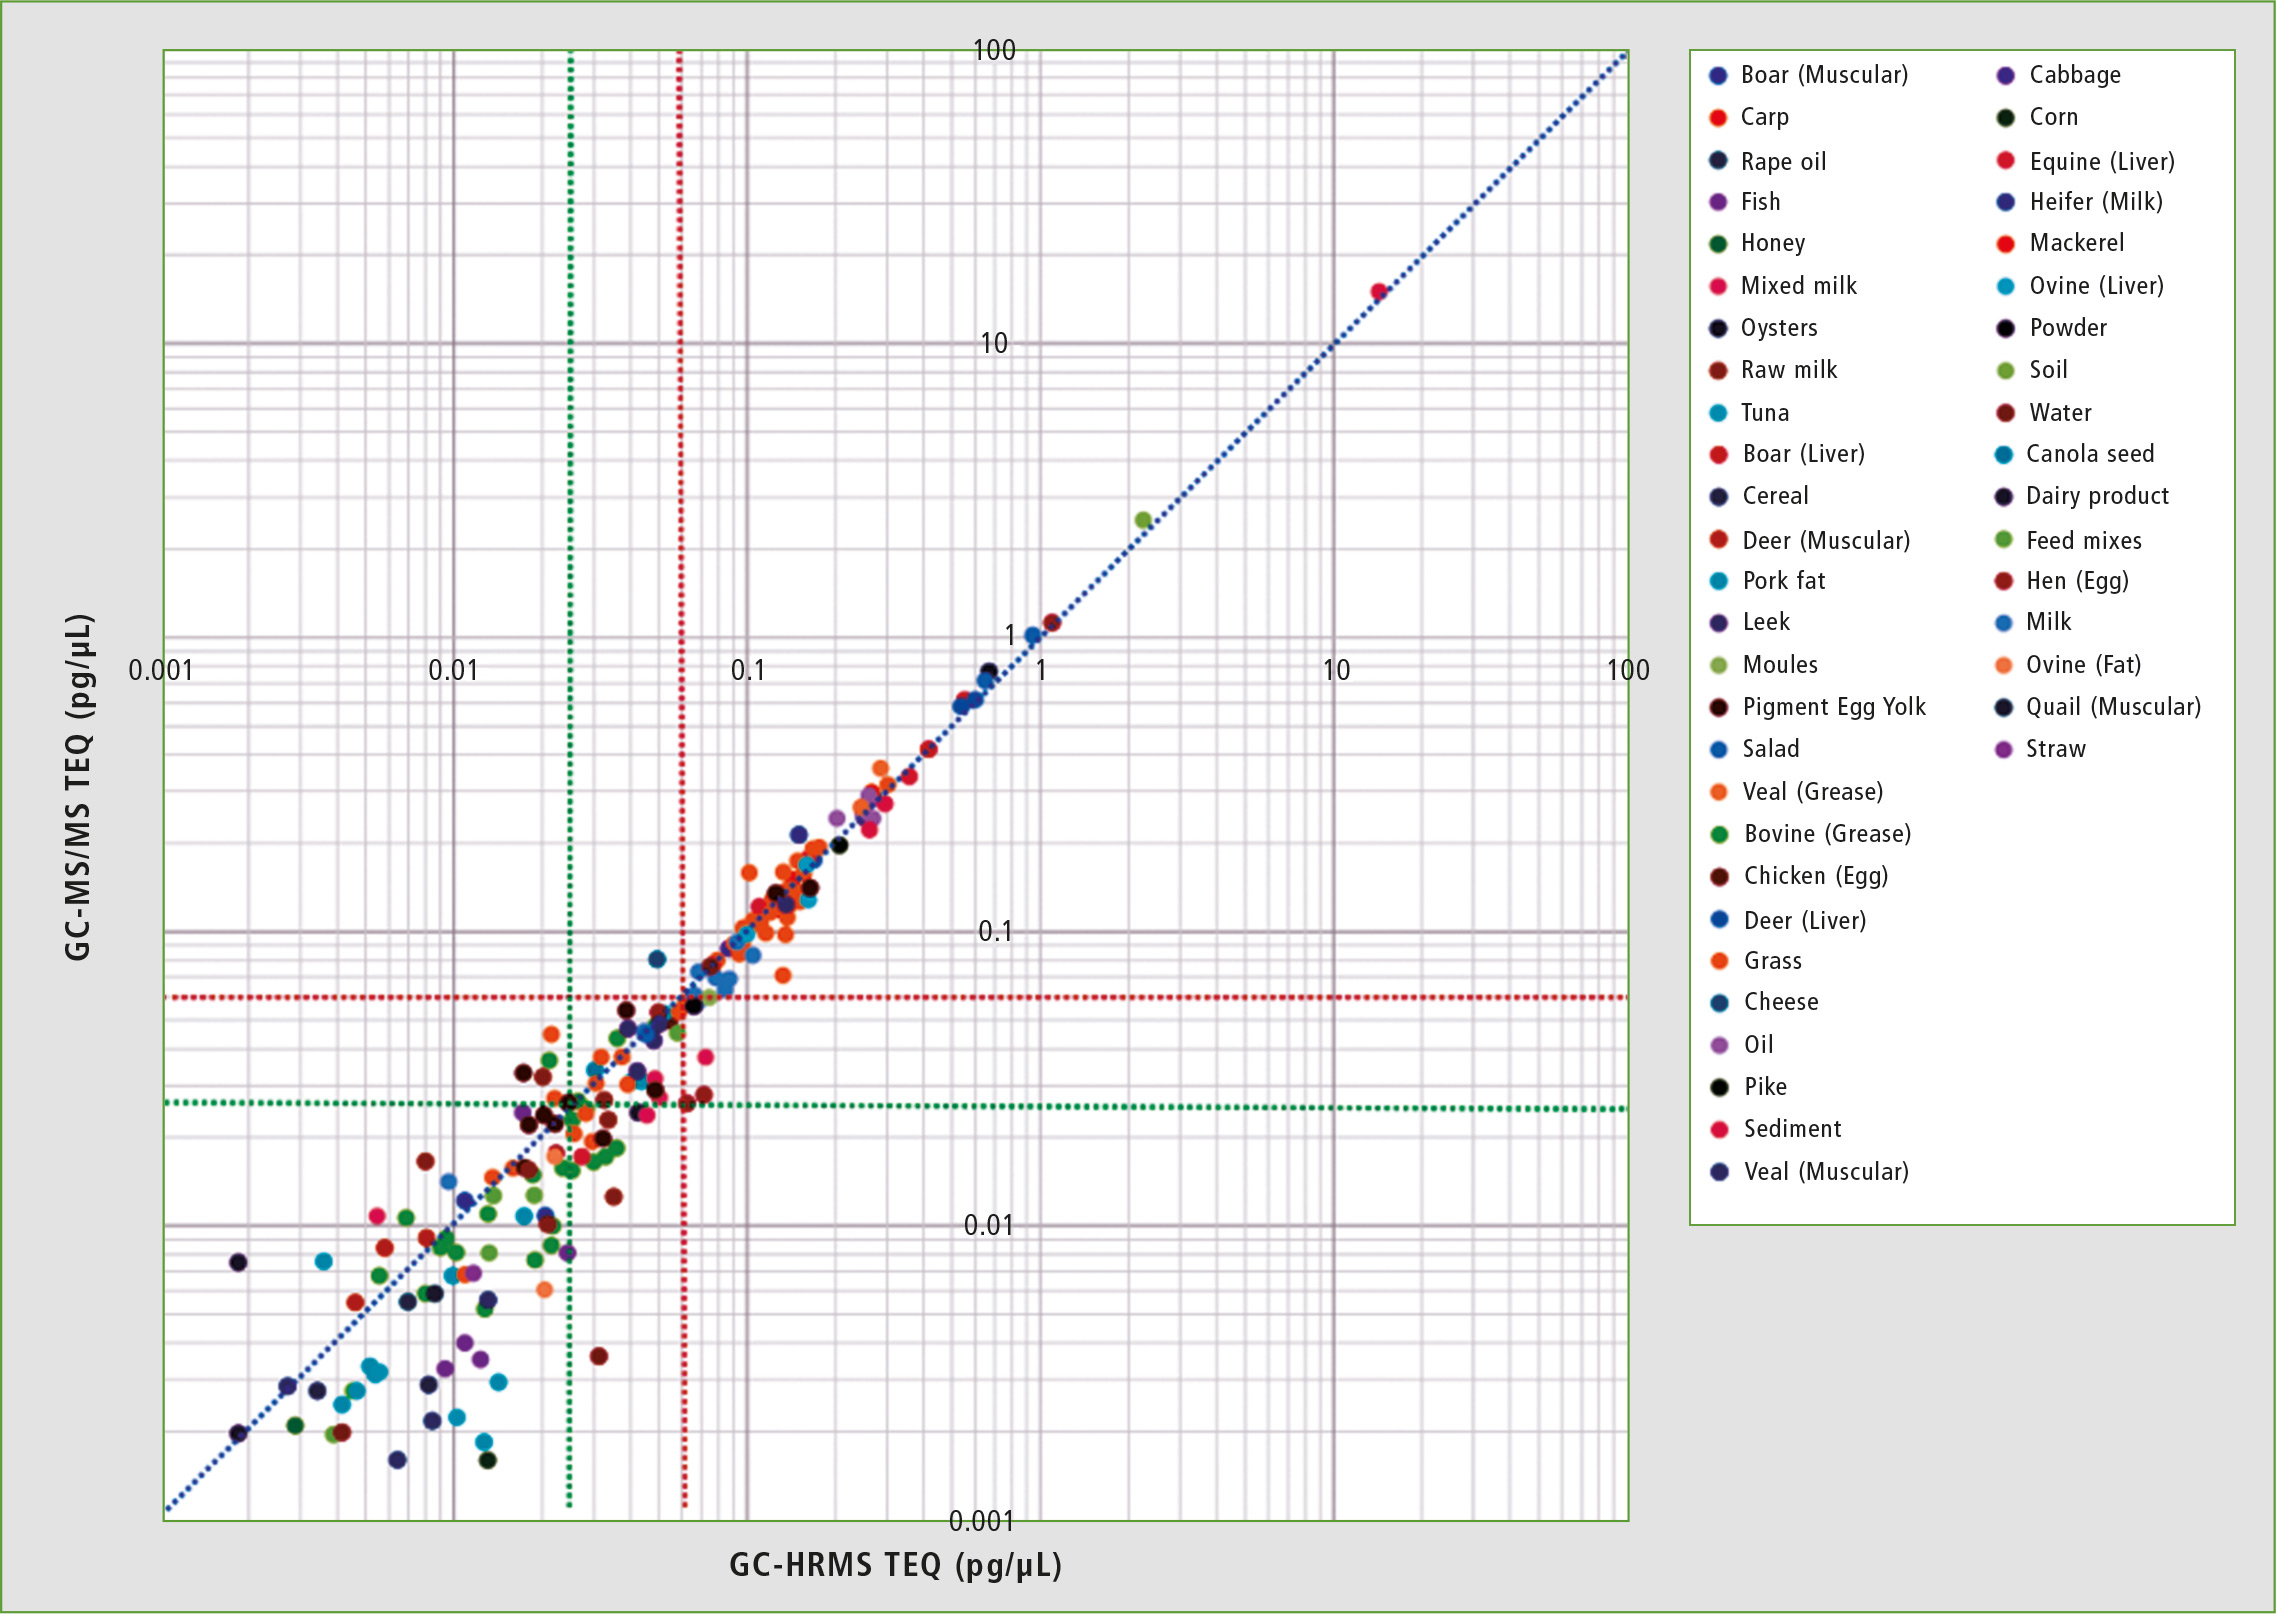 Figure 3: Summarized comparison of the TEQ results for TQ and HR MS
From the above-mentioned results, it is evident that analysis with GCMS-TQ8050 NX and method package provides a quantitative capability equivalent to that of GC-HRMS for samples at the concentration levels required for analysis. However, at concentrations below the required level, differences in quantitative capability could arise. For this reason, it is necessary to be aware of the system status by confirming quantitative capability at the LOQ, and evaluating whether there has been a decrease in sensitivity.