Exploring the history and chemistry of G & T
Quantification of quinine in tonic water by UHPLC analysis
Annika Malz, Shimadzu Europa GmbH
This first article of a three-part series on the classic longdrink gin and tonic takes a look at its origin in British history and the right amount of quinine which once served as a malaria antidote.
“Gin and tonic has saved more Englishmen’s lives, and minds, than all the doctors in the Empire.” This quote by Winston Churchill refers to a time when gin and tonic was not ordered but prescribed.[1] In 1854, on an expedition on the Niger, Scottish physician William Balfour Baikie used quinine from the cinchona tree to successfully prevent malaria, rather than as an aftertreatment. This initial action laid the foundation for the rise and expansion of the British Empire, because it helped push back malaria, which once existed all over Europe, including Britain, as recently as the early 20th century. Quinine was then mixed with gin – among other spirits – and, later on, lemon was added to prevent scurvy.[2] The first known record of the name “gin and tonic” came about in a magazine in 1868 when partygoers called for the cocktail at the end of a horse race in Lucknow, India.[3]
Today, quinine is widely used in the food and beverage industry, especially in tonic water, a popular carbonated drink. Given the pharmacological effects and potential side effects of quinine, it is crucial to accurately monitor its concentration in consumer products. High-performance liquid chromatography (HPLC) plays a central role in this monitoring process.
Quinine in tonic water – how much is too much?
HPLC is an analytical method renowned for its high precision, sensitivity and reliability in separating and quantifying components in complex mixtures. This article aims to evaluate the efficiency and accuracy of HPLC in determining quinine levels in various tonic water samples. By optimizing chromatographic conditions, a robust analytical procedure was developed that can be applied in monitoring compliance with legal limits.
The FDA (United States Food and Drug Administration) and the European Union state that the concentration of quinine as a flavoring agent in carbonated beverages must not exceed 83 mg/L and 100 mg/L, respectively, and it has to be declared on the bottle each time it is added.[4, 5] The results of this analysis are of particular interest as they not only ensure the consistency and safety of commercial products but also help to minimize potential health risks for consumers.

Analytical conditions
The method was developed using the LabSolutions MD™ software. Table 1 shows the optimized analytical conditions.
Sample preparation
For the preparation of standard solutions in the concentration range of 12.5 to 100 mg/L, accurately weighed quantities of a quinine standard substance were dissolved in ultrapure water. The tonic water samples were filtered using a 0.45 µm filter and injected into the HPLC without further dilution.
Method performance
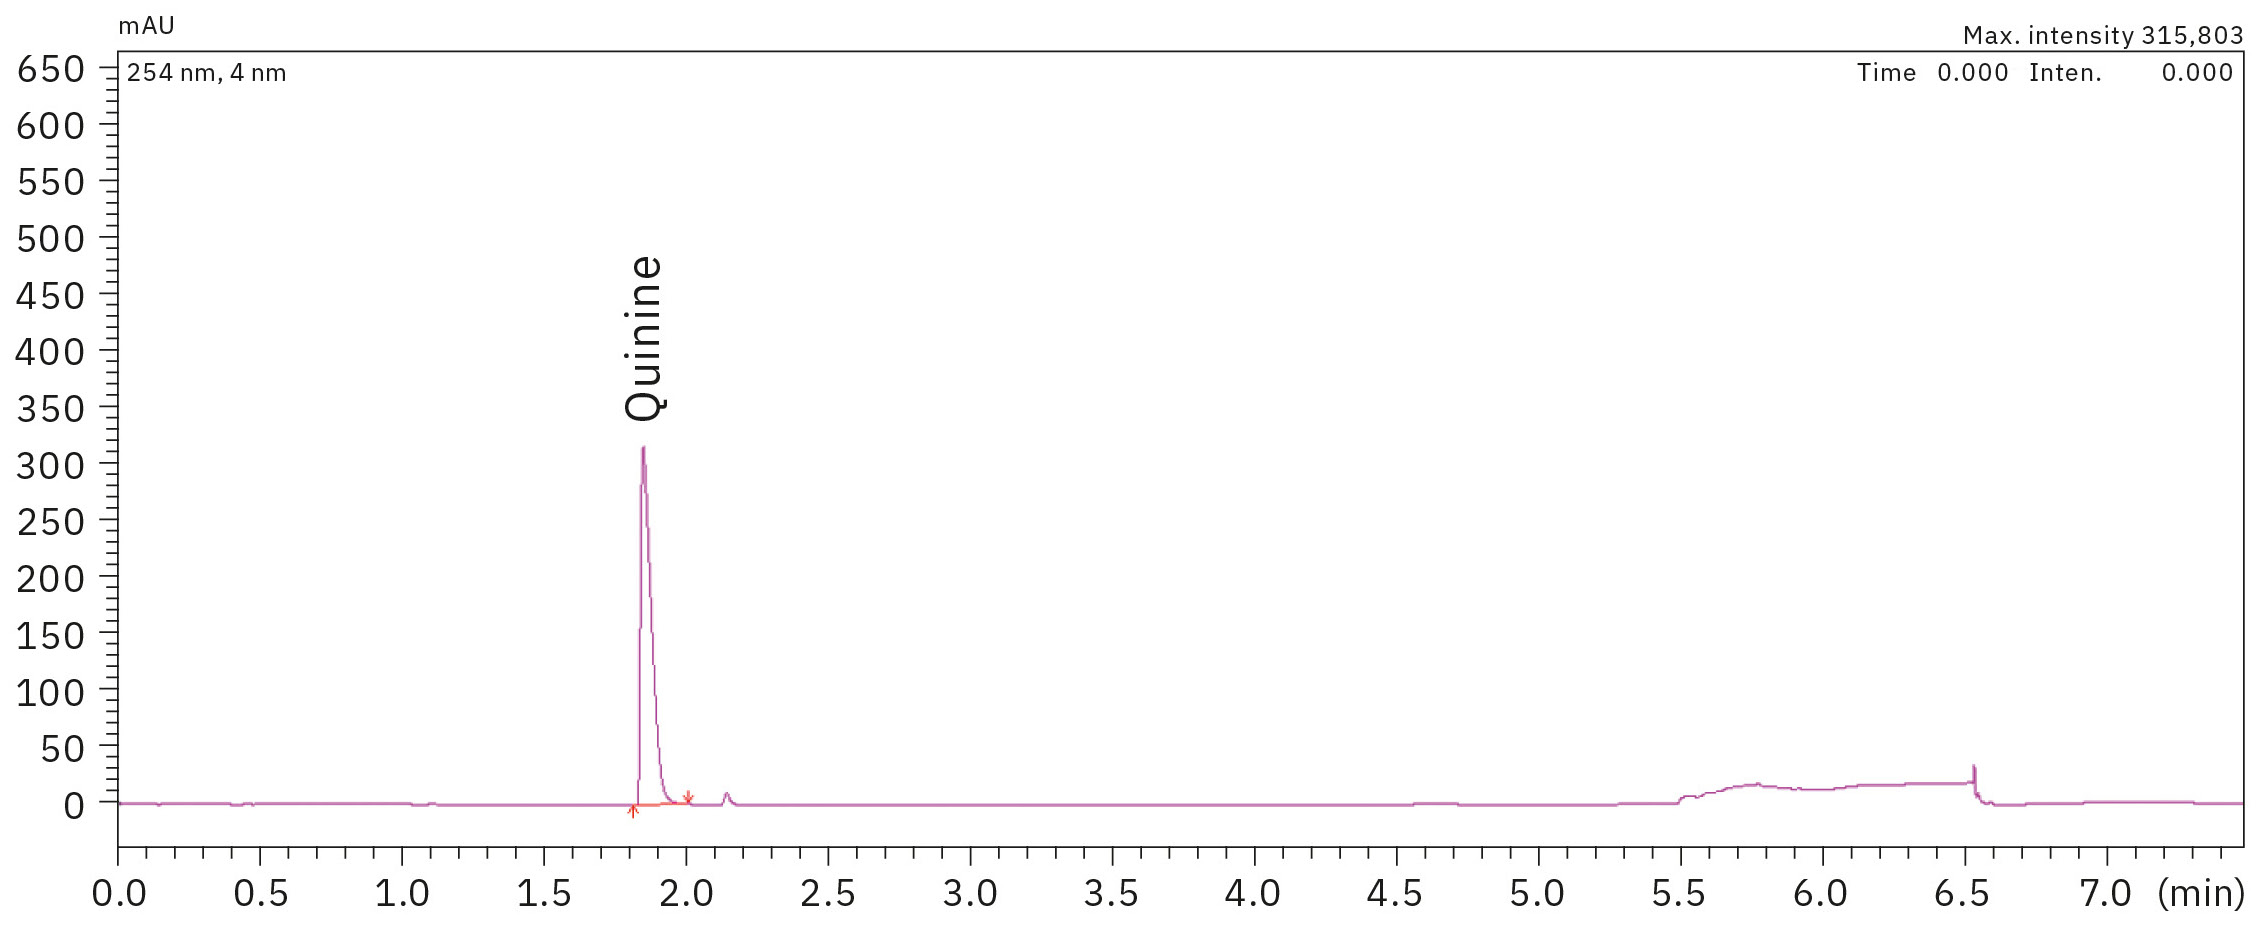
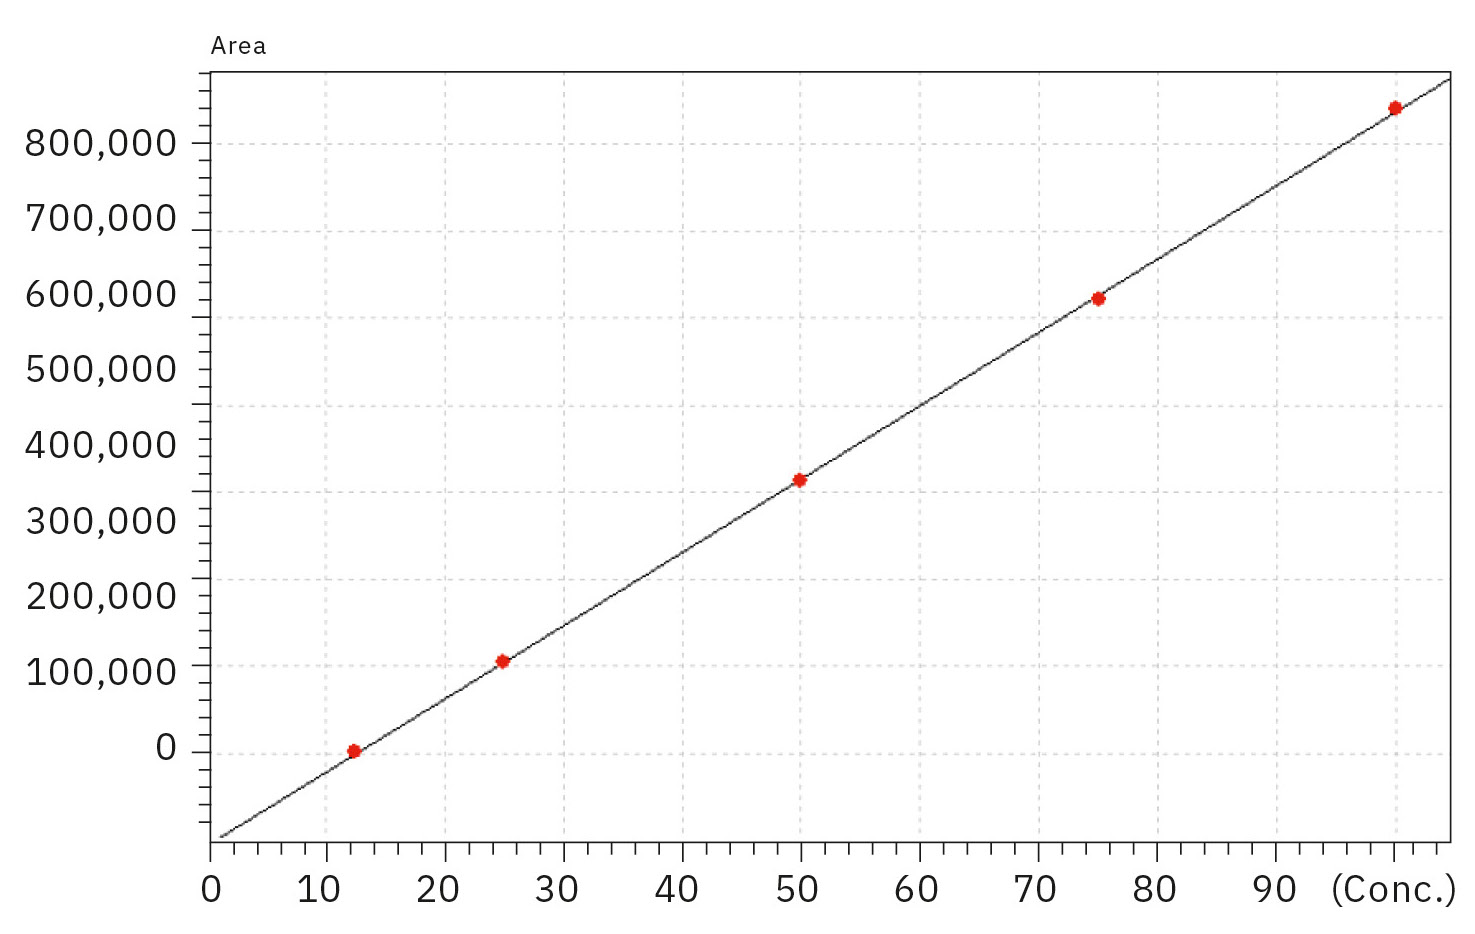
The linearity for the calibration standards prepared in a range of 12.5 to 100 mg/L with the coefficient of determination R2 > 0.9999 was excellent for quinine. Figures 1 and 2 display the chromatogram of the 100 mg/L standard solution and the corresponding calibration curve of all standards, respectively.
|
LC system |
Nexera XR UHPLC system |
|
Column |
Shim-packTM Velox C18, 100 mm x 3.0 mm I.D., 2.7 μm |
Mode |
High pressure gradient |
Mobile phase |
A) Water 0.1 % FA |
Flow rate |
1.0 mL/min |
Gradient |
0 min, 5 %B – 5 min, 40 %B – 5.01 min, 95 %B – 6 min, 95 %B – 6.01 min, 5 %B – 7.50 min, 5 %B |
Column temp. |
40 °C |
Sample volume |
2 μL |
Detection |
SPD-M40A (PDA @ 254 nm) |
|
Tonic water |
Measured conc. [mg/L] |
Tonic 1 |
86.4 |
Tonic 2 |
46.3 |
Tonic 3 |
75.8 |
Tonic 4 |
65.1 |
Tonic 5 |
70.6 |
Tonic 6 |
33.1 |
Tonic 7 |
68.3 |
Tonic 8 |
64.9 |
Tonic 9 |
56.4 |
Tonic 10 |
60.8 |
Results of the analysis of ten tonic water samples
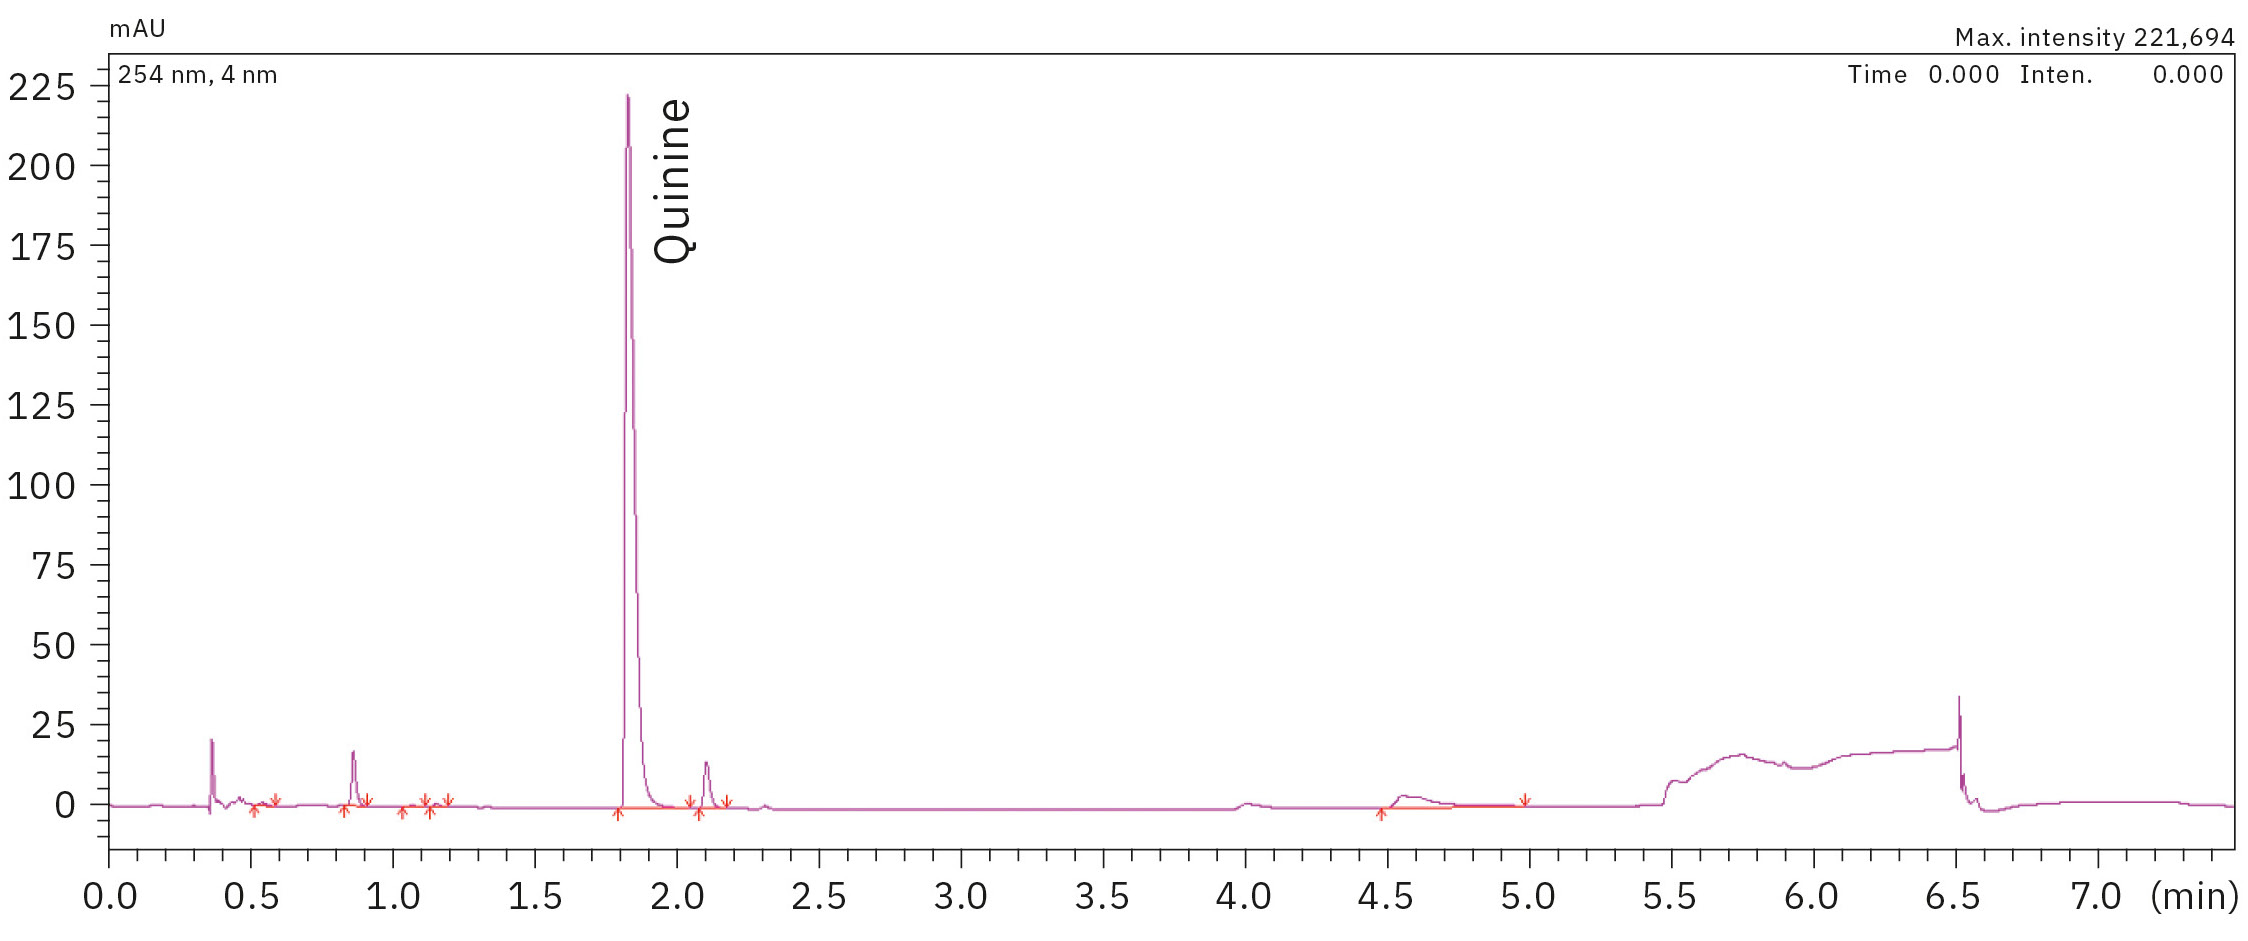
In Table 2, the results of the quinine content of ten different samples of measured tonic water are presented. Remarkable here is that the tonic sample 1 shows a higher content of quinine than allowed according to FDA regulations for beverages. Figure 3 illustrates a chromatogram of a tonic water sample measurement.
Cheers to a good and reliable HPLC method!
For the determination of quinine in tonic water, the developed HPLC method proved its worth. The quantification in a variety of tonic water samples showed compliance with the regulation in all but one product. To make a valuable statement, there must be more results from different bottles of one vendor, but for the tests just a single bottle of each tonic water was used. Nevertheless, a good overview of the quinine content of different tonic waters could be presented, which also reveals a wide variety of concentrations, probably resulting in a different taste of the beverages.
Coming soon: Organic acids and sugars in G & T
If you have enjoyed this article, you can look forward to part two of the series covering organic acids and sugars in G & T.
[1] The history of Gin and Tonic. https://www.ncbi.nlm.nih.gov/pmc/articles/PMC9714995/
[2] A History of Gin & Tonic. https://news.maisonferrand.com/history-gin-tonic-cocktail/
[3] Joanne Howdle: Could this be the origin of gin and tonic? https://www.johnogroat-journal.co.uk/news/joanne-howdle-could-this-be-the-origin-of-gin-and-tonic-325405/
[4] U.S. Food and Drug Administration. https://www.fda.gov/food/food-additives-petitions/food-additive-status-list
[5] EUR-Lex. Official Journal of the European Union. https://eur-lex.europa.eu/legal-content/EN/TXT/?qid=1507509835974&uri=CELEX:32012R0872


