Using light to beat cancer
New approaches in photodynamic therapy
Using light to beat cancer
New approaches in photodynamic therapy
Dr. Daniel Obitz, Ruhr-Universität Bochum
With an aging population and increasing environmental pollution, cancer is on the rise. Mutations lead to uncontrolled cell growth and the formation of tumors. Traditional cancer therapies include the surgical removal of the affected tissue or killing it by ionizing radiation. A novel approach is photodynamic therapy, which is being studied at Germany’s Ruhr University Bochum.
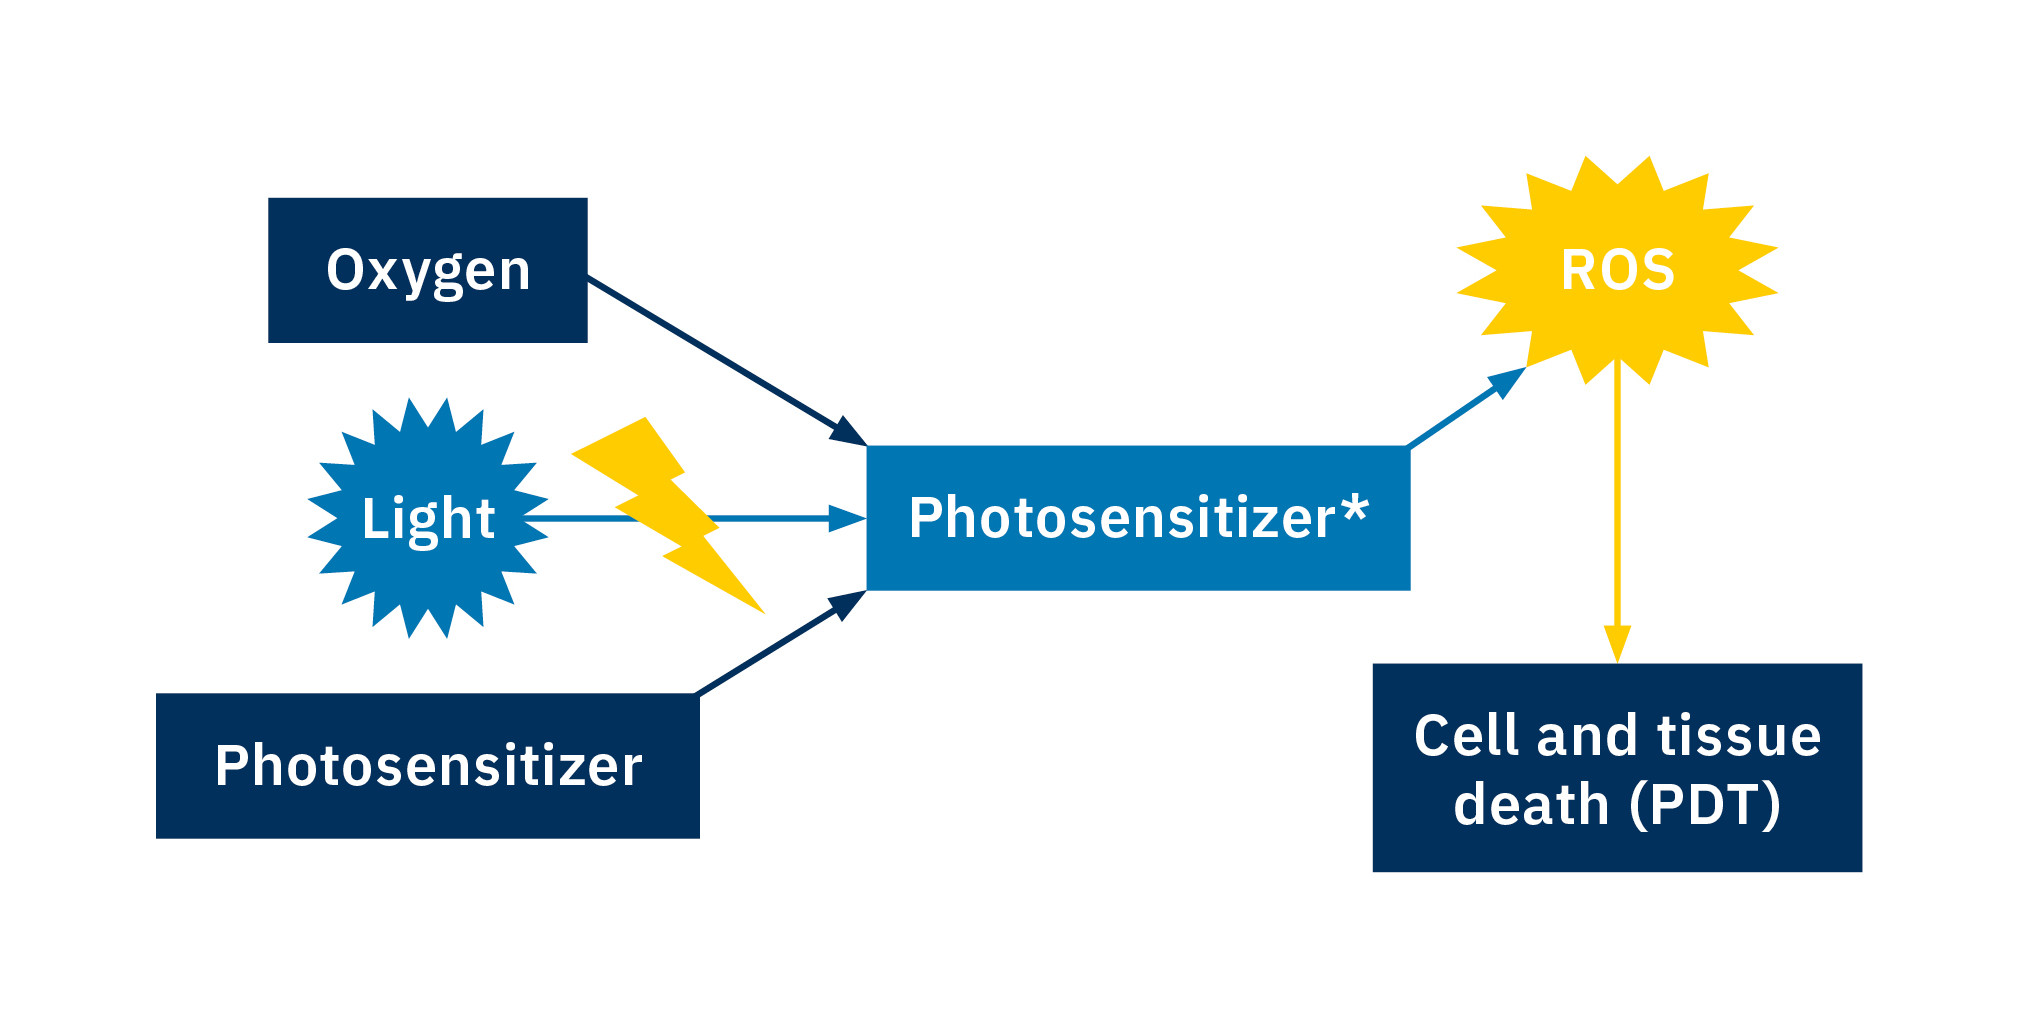
Can you destroy cancer cells with the help of light? Photodynamic therapy (PDT) is thought to be a promising alternative to traditional approaches in cancer therapy. A photosensitizer is used for this: It’s as nontoxic as possible without exposure to light. The photosensitizer is excited – and therefore activated – using light of a specific wavelength. The activated photosensitizer reacts with the oxygen in the tumor tissue to form reactive oxygen species (ROS). This can lead to cell or tissue death in the tumor tissue and in this way fight the tumor (Figure 1). The aim of the research led by Prof. Dr. Nils Metzler-Nolte at Ruhr University Bochum is the development of novel photosensitizers for PDT.
Searching for the right compound
To preselect promising compounds, tests of various candidate compounds in solution are performed prior to the elaborate cell culture experiments (Figure 2):
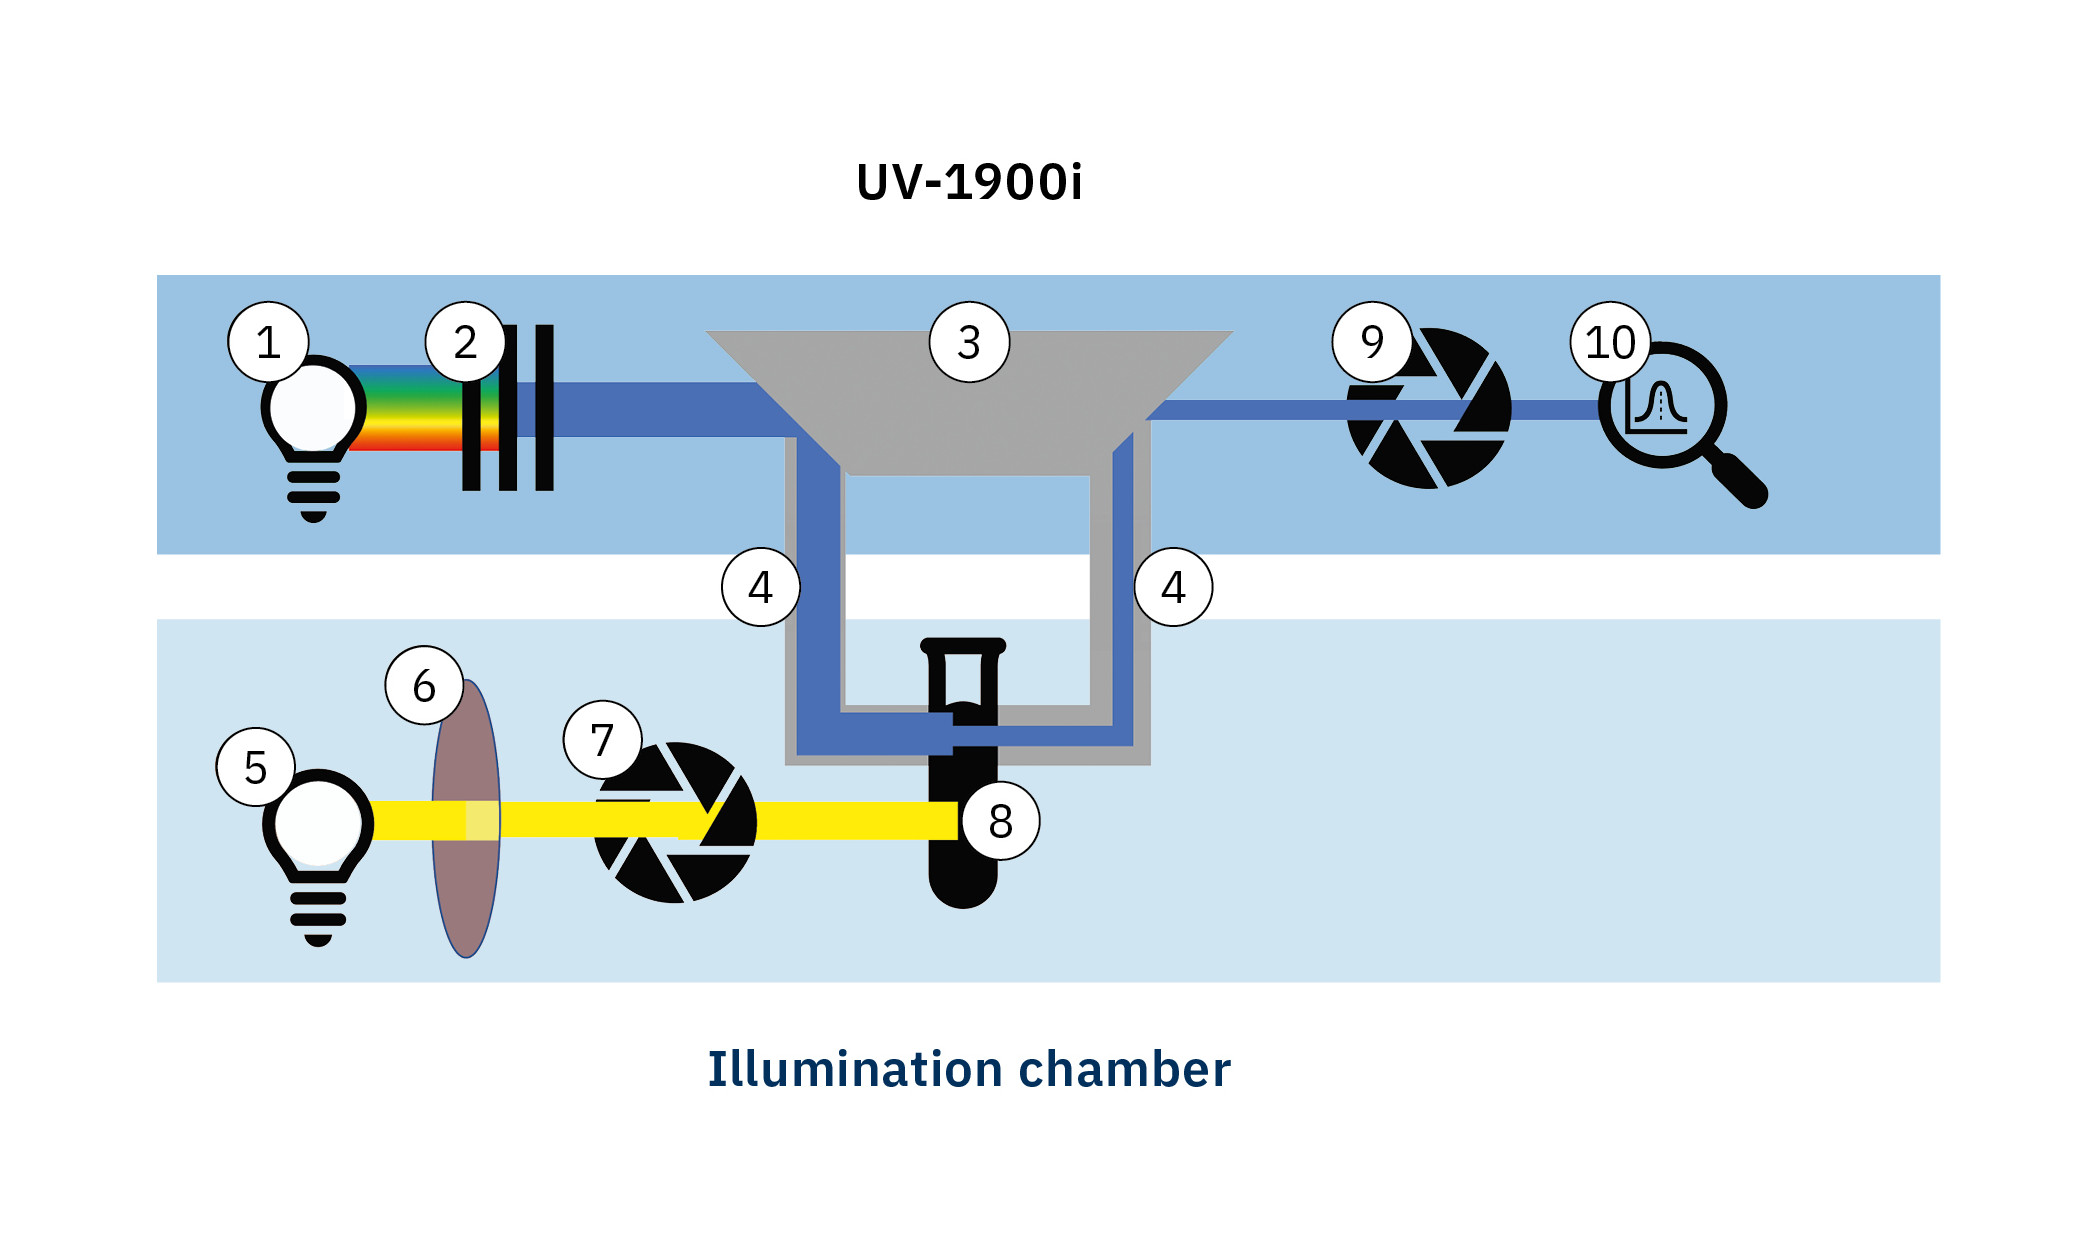
Figure 2: Schematic diagram of the experiment, consisting of UV-Vis spectrometer and exposure chamber.
1: D2 and WI lamp 2: Monochromator
3: Coupling optics for optical fiber
4: Optical fiber
5: Xe lamp
6: Longpass filter
7: Lamp shutter
8: Sample (formation of ROS)
9: Detector shutter
10: Photodiode
A Shimadzu UV-1900i UV-Vis spectrometer is used to measure the absorption spectra. The light from a deuterium or halogen lamp (1) is split into monochromatic radiation by a monochromator (2) and coupled into an optical waveguide (4) using special optics (3).
The compound being studied is dissolved together with a substance that reacts with reactive oxygen species (ROS) (8). The solution is then illuminated using a xenon gas discharge lamp (5) with a specific longpass filter (6). The exposure time is controlled by an electronic shutter (7).
After exposure is completed, the lamp shutter is closed and the absorption spectrum is measured. Another shutter (9) protects the sensitive photodiode (10) on the spectrometer from damage due to any intense stray light during exposure of the sample and is only opened during measurement.
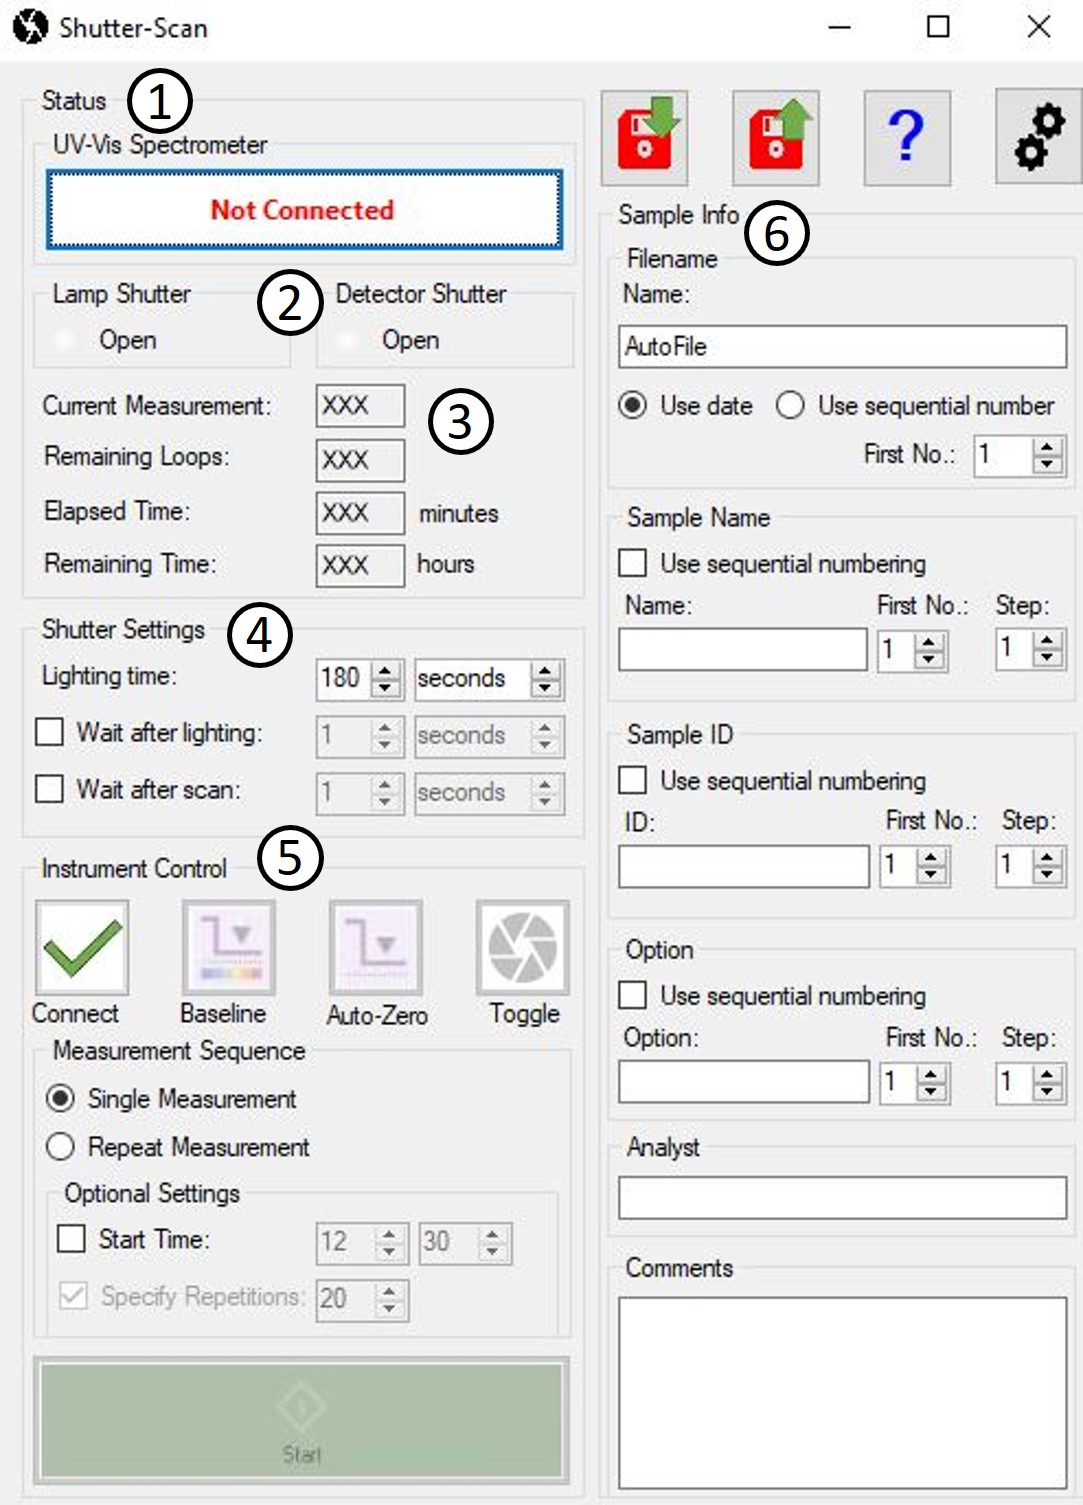
1: Spectrometer status
2: Aperture status
3: Measurement sequence status
4: Exposure time control
5: Spectrometer control
6: Sample information input fields
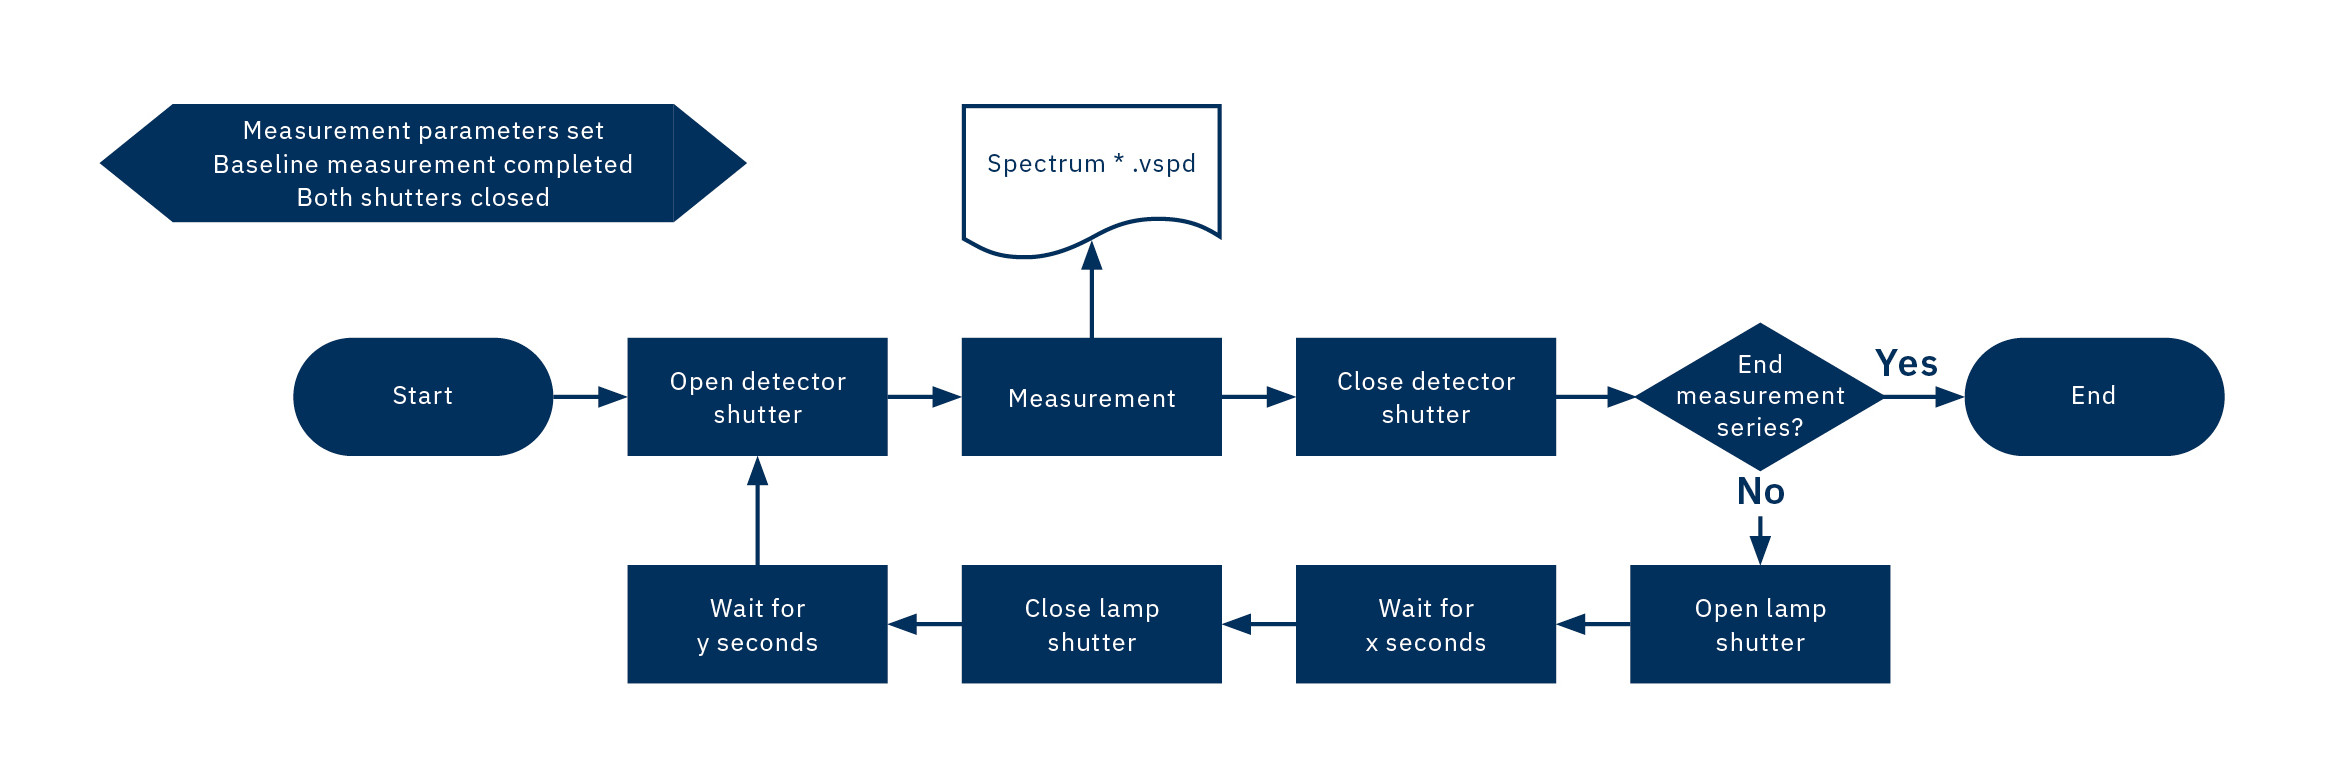
Figure 4: Schematic diagram of a sequence consisting of exposure of the sample and measurement of the absorption spectrum. Before the starting point, the spectrometer and apertures have already been initialized and the baseline recorded.
Monitoring and control
Control of the shutter and measurement software is synchronized via a LabSolutions UV-Vis Automatic-Control macro. The graphical user interface (Figure 3) displays the status of the UV-Vis spectrometer (1) and apertures (2) as well as the current status of the running measurement sequence (3). The exposure time (4) and optional waiting time in the dark before and after each measurement can be set in seconds, minutes or hours. Various buttons (5) can be used to manually control the UV-Vis spectrometer and shutter or to start the automatic measurement sequence. The sample information (6) required for assigning the spectra is entered before the measurement sequence is started.
The experiment sequence is shown schematically in Figure 4. The start point in this diagram does not describe the program start but the start of the measuring sequence after the baseline measurement.
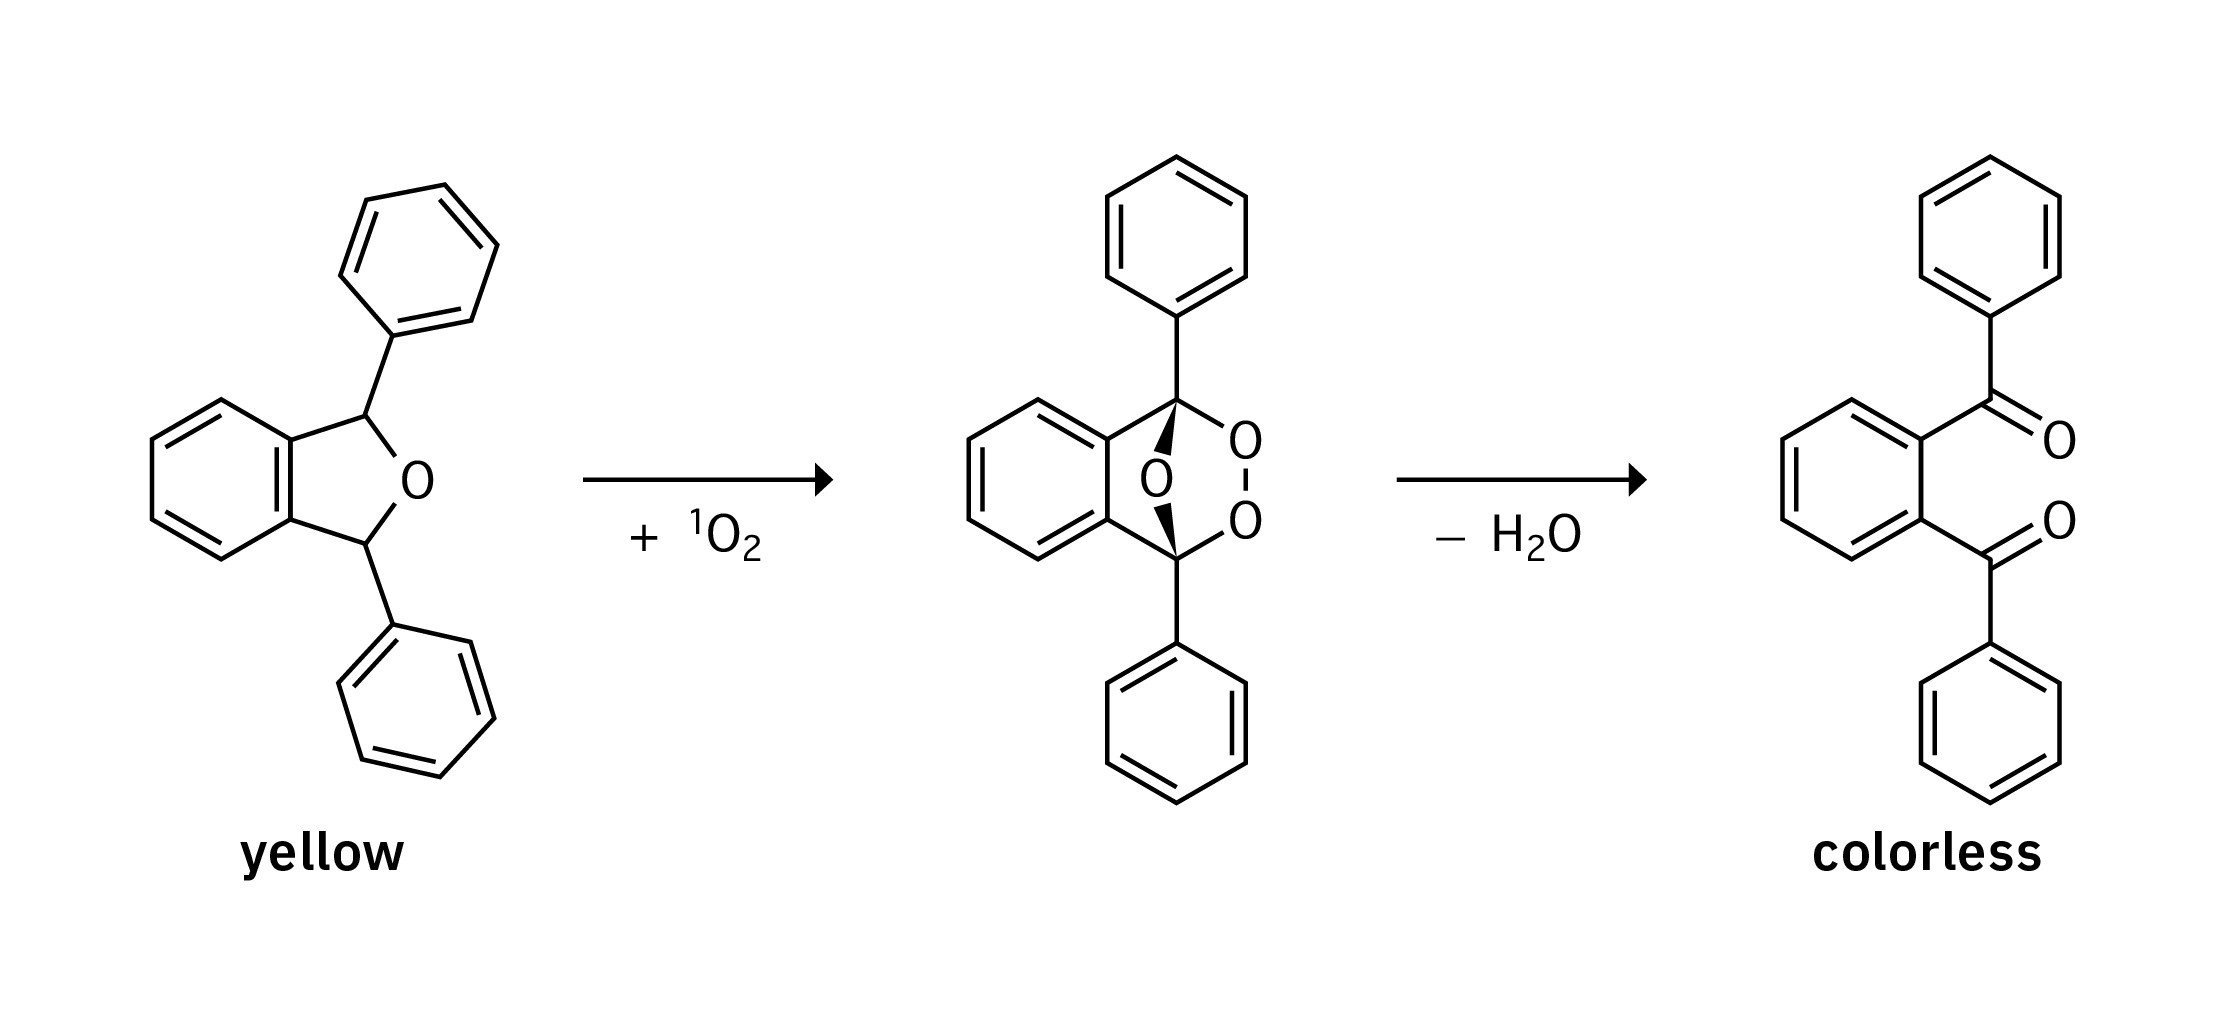
The setup is used to measure ROS production by the decay of the sample substance using UV-Vis spectroscopy (Figure 5). Various sample substances can be used here, in this case 1.3-diphenylisobenzofuran (DPBF).
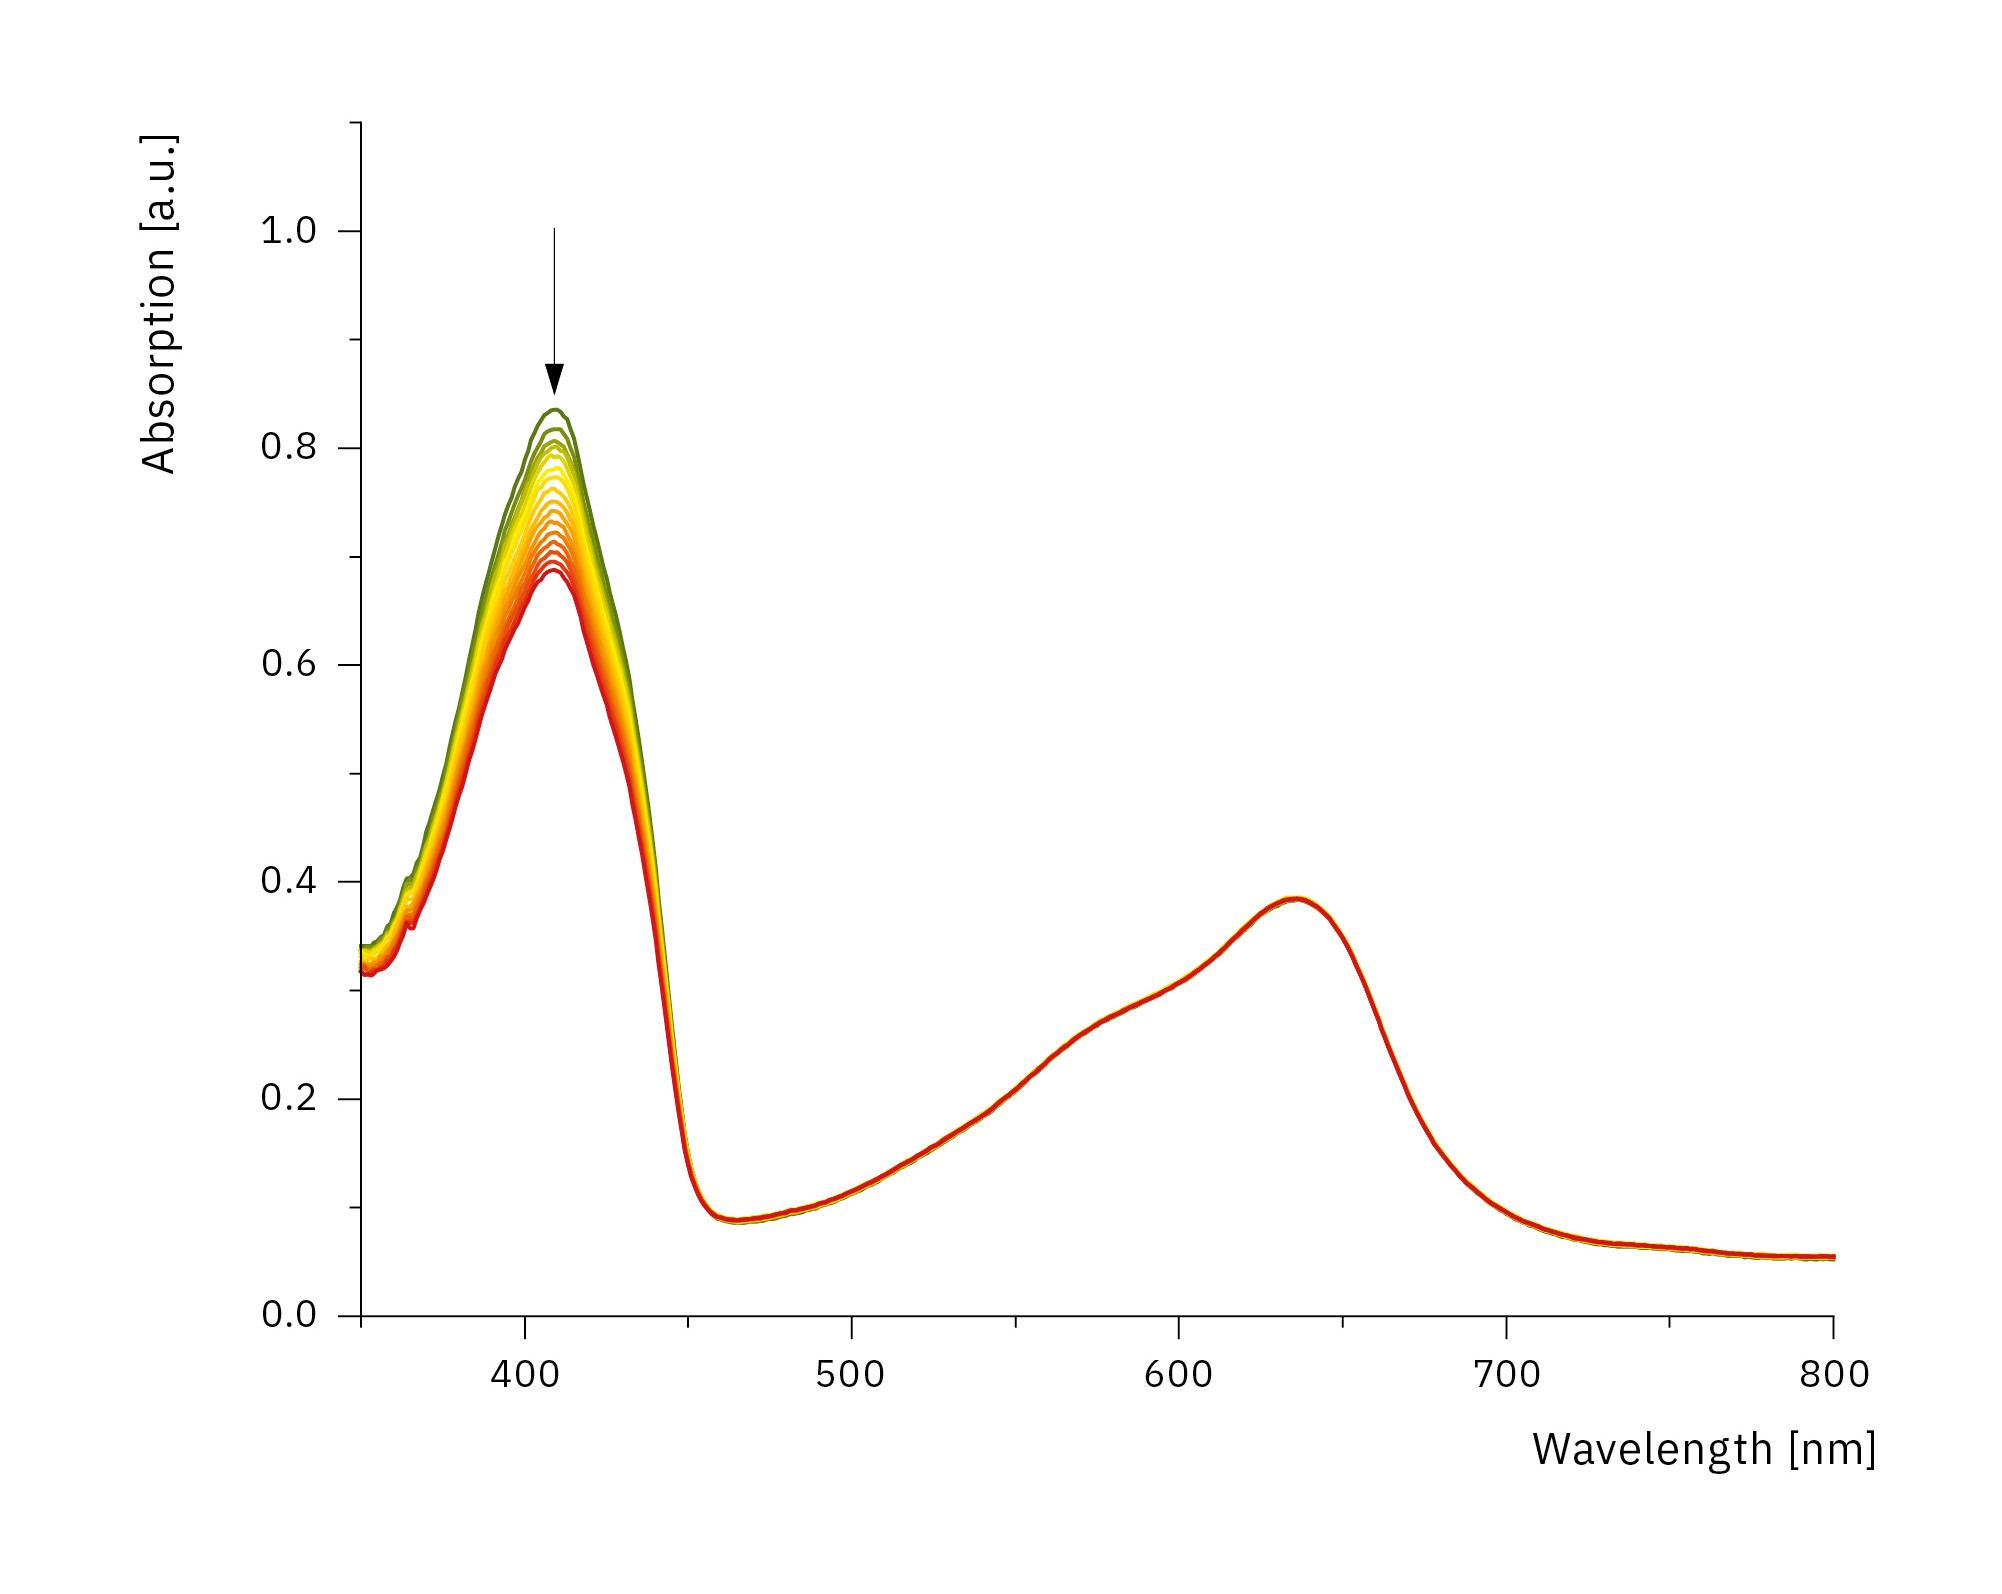
In addition, the photostability of the photosensitizer can be shown by recording whole spectra. The setup is capable of performing high temporal resolution measurements at one-minute intervals, thanks to the very small time requirement of the UV-1900i. This very high scan rate makes it possible to observe the stability of substances by measuring entire spectra. This also allows for a more detailed look at fast reaction kinetics, which were previously inaccessible. The total illumination time is usually up to 60 minutes with illumination intervals of 2 to 5 minutes. Figure 6 shows the course of decomposition of 1.3-diphenylisobenzofuran by reactive oxygen species generated by a holmium complex over 45 minutes, with an illumination interval of 3 minutes.
The decomposition of the sample can be clearly seen by the decreasing intensity of the absorption peak at 410 nm, while the absorption of the solution remains constant in time in the range from 500 to 700 nm.
Specific pre-selection thanks to fast analysis
The automated measurement sequence and short measurement time of Shimadzu’s UV-1900i allow photosensitizers to be analyzed quickly. This enables a qualified preselection of suitable molecules that are promising for more elaborate studies. The hope is that these studies will ultimately lead to a new and better way (photodynamic therapy) to treat cancer.
[1] Obitz, D.; Gkika, K. S.; Heller, M.; Keyes, T. E.; Metzler-Nolte, N. A Phototoxic Thulium Complex Exhibiting Intracellular ROS Production upon 630 nm Excitation in Cancer Cells. Chem. Commun. 2023, 59 (14), 1943–1946. https://doi.org/10.1039/D2CC06209G.