Determining nutritional value and detecting fraud
Combining GC-2030 and GCMS-QP2020NX increases information from edible-oil analysis
Fotis Fotiadis, MSc Chemist, Dr. Manos Barmpounis, N. Asteriadis SA, Athens, Greece
Prof. Peter A. Roussos, Asimina-Georgia Karyda, MSc Agronomist, Dep. of Crop Science, Agricultural University of Athens
Gas chromatography (GC) is a well-established technique for identifying and quantifying fatty acids in edible oils, especially in combination with a flame ionization detector (GC-FID). Quantification of fatty acids in edible oils is useful in determining their nutritional value and in detecting fraud – such as when a high-value oil is secretly diluted with lower-value oils. However, GC-FID has certain limitations, which researchers were able to overcome by also using GC-MS in the analysis of six edible oils. The combined technique was then used to identify squalene in three samples.
Ensuring purity in edible oils
Edible oils with high concentrations of monounsaturated (MUFA) and polyunsaturated (PUFA) fatty acids have rich nutritional value. These fatty acids have positive benefits for human health and development, such as reducing the risk of cardiovascular disease and diabetes, attenuating the risk of Alzheimer’s disease and assisting in cancer prevention and treatment.[2]
The fats of plants and fish are generally unsaturated. In contrast, most animal fats and many processed foods are high in saturated fat content. The effect of saturated fatty acids (SFA) on heart disease has been extensively studied,[3] and many health authorities advise that saturated fat is a risk factor for developing cardiovascular diseases.[4] Several studies have also observed that SFA can induce endoplasmic reticulum stress and result in liver damage.
Discovering the thuths
So, it is important for consumers to know what they are buying – in particular the correct nutritional value. Ensuring that they do, is usually the responsibility of the governmental authorities charged with ensuring food safety and accurate food labelling. And because government regulators are frequently faced with deliberate fraud in the case of edible oils – in which higher-value oils are diluted with lower-value oils – proper testing is often the only way to find out the truth.
Gas chromatography (GC) is a well-established technique for identifying and quantifying fatty acids in edible oils, especially in combination with a flame ionization detector (GC-FID). However, GC-FID has certain limitations. First, the results obtained pertain to a limited group of fatty acids, excluding the vast majority of compounds contained in the samples. Second, GC-FID provides no information on the identity of the obtained peaks, so it is obligatory for the operator to inject reference standards for confirmation.
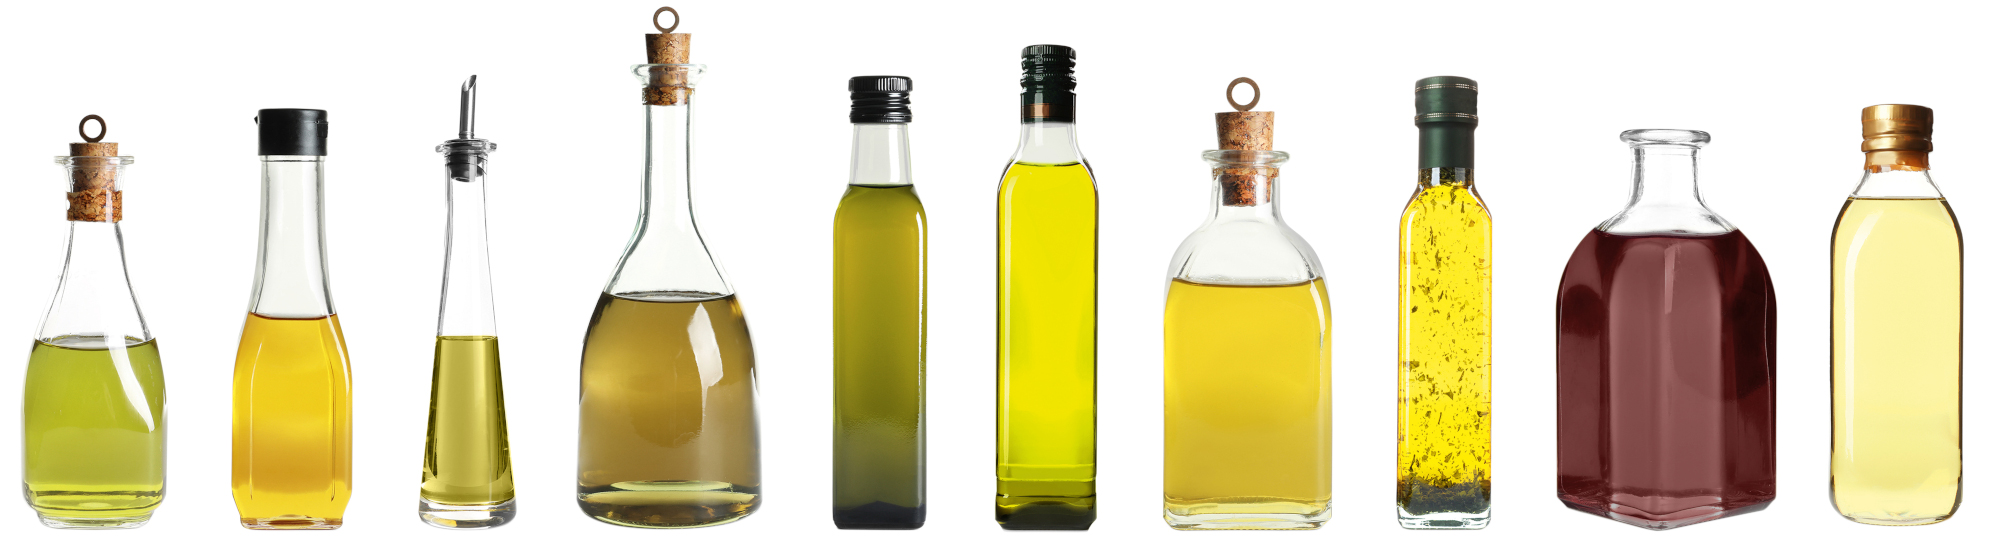
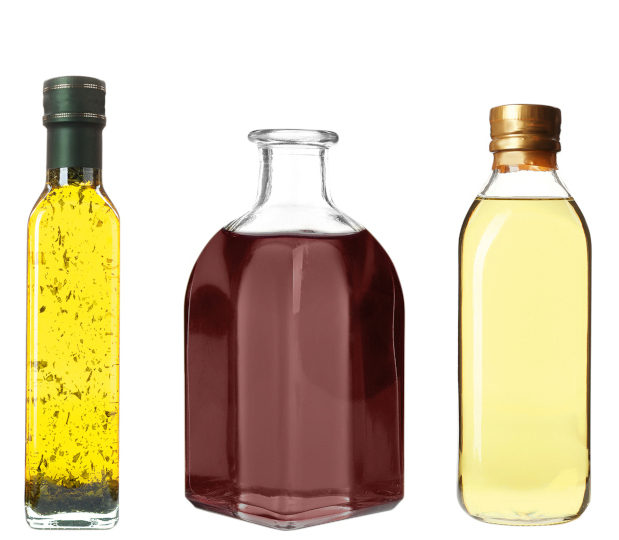
Researchers decided to compare this commonly used method with a new method using gas chromatography and a mass spectrometric detector (GC-MS). To assist them, they turned to Shimadzu, who produce all of the high-quality scientific instrumentation necessary for this test. Five different types of edible oils –olive oil, pomace oil, corn oil, cannabis oil and soybean oil – were then studied and analyzed using both GC-FID and GC-MS techniques.
Preparing to test the tests
Based on the number of double bonds, fatty acids are classified as: saturated fatty acids (SFA), monounsaturated fatty acids (MUFA) and polyunsaturated fatty acids (PUFA), which are further sub-categorized into their specific fatty acid components.[1]
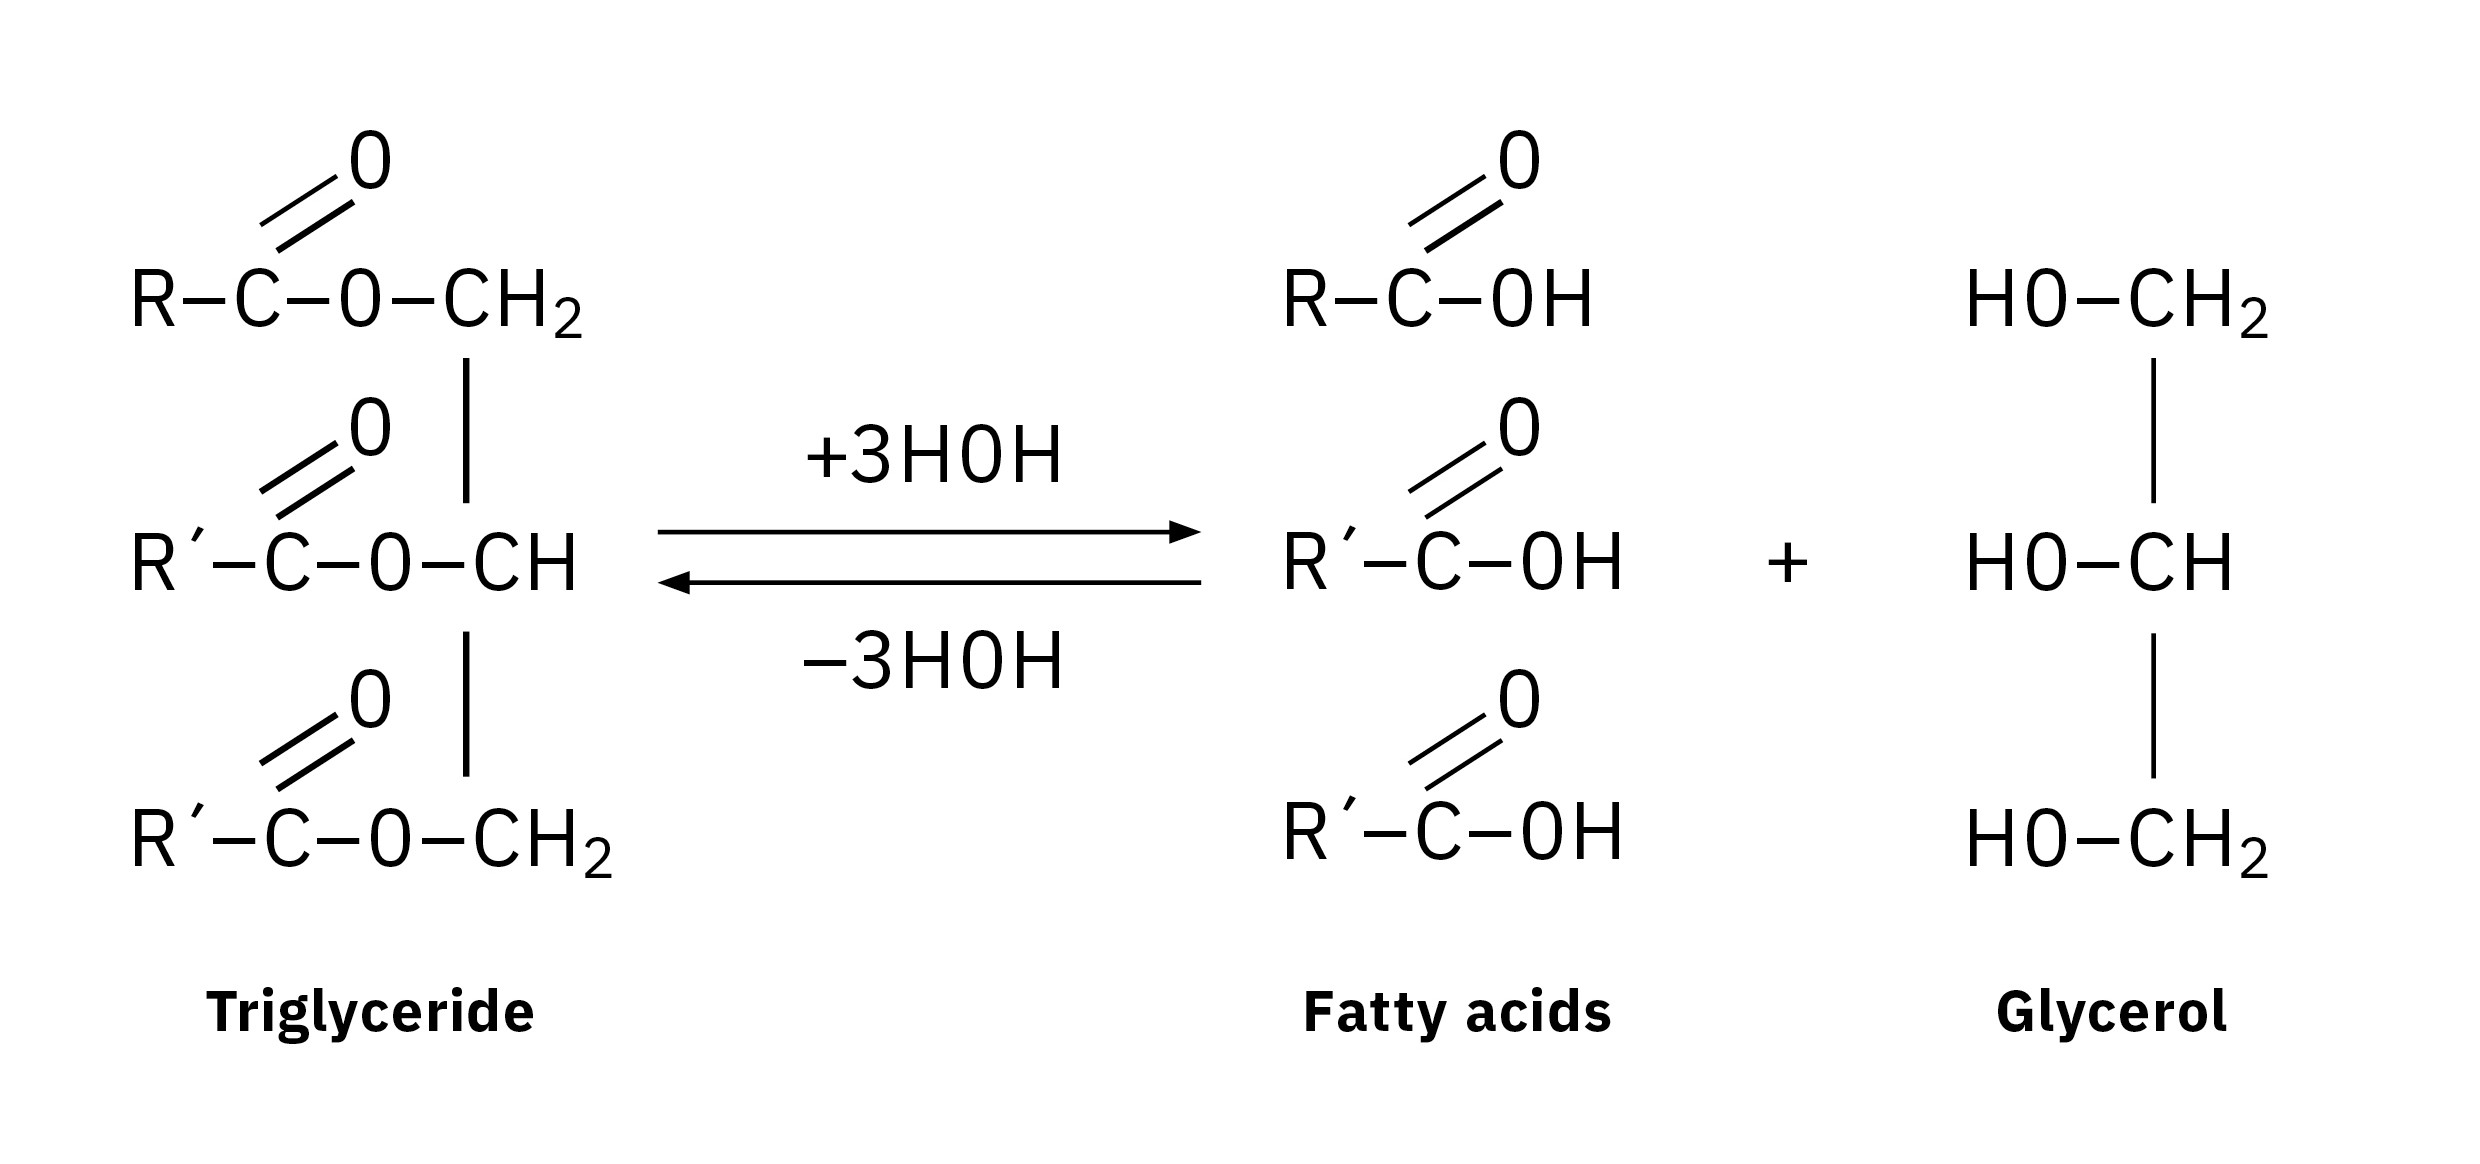
Gas chromatography requires fatty acids to be derivatized in order to become sufficiently volatile to be eluted at lower temperatures without thermal decomposition. This usually involves the substitution of a functional group containing hydrogen to form esters, thioesters or amides. Methyl esters are commonly studied derivatives which are produced by methylation. According to the method used, the ester bonds are hydrolyzed to release free fatty acids, which are transmethylated to form fatty acid methyl esters (FAMEs). The resulting FAME profile determined by GC is referred to as the fatty acid composition.
For the purposes of this comparative test, FAMEs were prepared by alkaline methylation. Note: All the chemicals used during sample preparation were of analytical reagent grade (> 98 %): methanol, heptane and potassium hydroxide. Next, aliquots of 1–2 g of sample were filtered in a beaker. If the oil had no sediment or suspension visible to the naked eye, no filtration was required. 0.5 g of oil were then weighed in a 10-ml test tube. 5 ml of heptane and 1 ml of methanolic KOH 2M solution were added to the sample with a pipette. The test tube was shaken vigorously for 30 seconds and then allowed to rest for 15 minutes. (Centrifuging the sample would also have been an option.) Two layers are generated in the test tube, and 1 μl from the upper organic phase (heptane) was then injected into the GC and GC-MS instruments.
GC-FID analytical conditions
Gas chromatograph:
Shimadzu GC-2030 equipped with AOC-20i+s, Split/Splitless injector, FID detector
Capillary column:
MEGA-10 (30 m × 0.25 mm ID, 0.25 μm film thickness)
|
Part of GC |
Values |
|
Split injector temperature |
245 °C |
|
Split ratio |
200 |
|
FID temperature |
245 °C |
|
FID air flow |
200 mL/min |
|
FID hydrogen flow |
32 mL/min |
|
FID make-up flow |
24 mL/min |
|
Carrier gas |
He |
|
Linear velocity |
31.3 cm/sec |
|
Column flow |
1.1 mL/min |
|
Oven temperature program |
150 °C → 12 min |
|
Column |
MEGA-10 |
GC-MS analytical conditions
Gas chromatography-mass spectrometry:
Shimadzu Nexis
GCMS-QP2020NX equipped with AOC-30i+s, Split/Splitless injector
Capillary column:
MEGA-WAX_MS (30 m × 0.25 mm ID, 0.25 μm film thickness)
|
Part of GC |
Values |
|
Split injector temperature |
240 °C |
|
Split ratio |
200 |
|
Carrier gas |
He |
|
Linear velocity |
31.3 cm/sec |
|
Column flow |
1.2 mL/min |
|
Acq. mode |
Scan (40–5000 m/z) |
|
Ion source temperature |
220 °C |
|
Interface temperature |
240 °C |
|
Oven temperature program |
150 °C → 5 min |
|
Column |
MEGA-WAX_MS |
The results
The (%) area of FAMEs was calculated separately for each oil using both the GC-FID and GC-MS techniques. Ratios of monounsaturated/polyunsaturated acids were also determined. Oleic acid is the main monounsaturated acid for edible oils, while linoleic and linolenic acids are the basic polyunsaturated acids. Tables 3 and 4 show the overall results from the area percentage of fatty acids in five different edible oils.
| Olive oil | Pomace oil | Corn oil | Soybean oil | Cannabis oil | |||||||
| FAMES | GC area (%) | GC-MS area (% TIC) | GC area (%) | GC-MS area (% TIC) | GC area (%) | GC-MS area (% TIC) | GC area (%) | GC-MS area (% TIC) | GC area (%) | GC-MS area (% TIC) | |
| c14:0 | 0.013 | – | – | 0.02 | 0.012 | 0.04 | 0.024 | 0.11 | – | 0.05 | |
| C16:0 | 11.060 | 11.72 | 12.604 | 13.22 | 11.286 | 13.64 | 10.644 | 12.29 | 6.126 | 7.33 | |
| C16:1 | 0.938 | 0.98 | 1.049 | 1.12 | 0.136 | 0.16 | 0.087 | 0.11 | 0.166 | 0.18 | |
| C17:0 | 0.041 | 0.04 | 0.066 | 0.06 | 0.064 | 0.07 | 0.080 | 0.10 | 0.054 | 0.06 | |
| C17:1 | 0.073 | 0.08 | 0.091 | 0.10 | 0.036 | 0.03 | 0.053 | 0.05 | 0.022 | 0.03 | |
| C18:0 | 2.429 | 2.68 | 2.625 | 2.97 | 1.969 | 2.36 | 3.871 | 4.73 | 2.254 | 2.78 | |
| C18:1 | 77.291 | 76.74 | 69.477 | 68.76 | 31.808 | 34.92 | 25.117 | 28.66 | 22.374 | 25.67 | |
| C18:2 | 6.470 | 6.00 | 12.207 | 11.65 | 52.594 | 46.40 | 52.955 | 46.87 | 49.416 | 45.28 | |
| C18:3 | 0.764 | 0.59 | 0.733 | 0.69 | 1.011 | 0.92 | 5.894 | 5.38 | 17.534 | 15.95 | |
| C20:0 | 0.424 | 0.50 | 0.483 | 0.58 | 0.425 | 0.55 | 0.448 | 0.48 | 0.836 | 1.10 | |
| C20:1 | 0.313 | 0.35 | 0.363 | 0.45 | 0.338 | 0.44 | 0.189 | 0.33 | 0.651 | 0.77 | |
| C22:0 | 0.125 | 0.21 | 0.199 | 0.25 | 0.147 | 0.22 | 0.479 | 0.68 | 0.400 | 0.59 | |
| C24:0 | 0.058 | 0.11 | 0.103 | 0.13 | 0.174 | 0.25 | 0.159 | 0.22 | 0.168 | 0.21 | |
| 100.000 | 100.000 | 100.000 | 100.000 | 100.000 | 100.000 | 100.000 | 100.000 | 100.000 | 100.000 | ||
| Table 3: (%) area of fatty acids in olive oil, pomace oil and corn oil | Table 4: (%) area of fatty acids in soybean oil and cannabis oil | ||||||||||
Notice that the results obtained from GC-FID are not directly comparable with those achieved by the GC-MS for all samples. We can see that the (%) area of the SFA in GC-MS was higher than the one in GC-FID. Palmitic acid, for example, had higher proportions on GC-MS for the five edible oils examined. Meanwhile, PUFAs (e.g. linoleic, linolenic acids) were determined in higher ratios in the GC-FID analysis. The conclusion is that GC-MS analysis of FAMEs leads to an overestimation of SFA, regardless of sample type.
MUFA/PUFA ratio
The ratios between oleic acid/linoleic acid and between oleic acid/linolenic acid were examined in the five edible oils (Table 5). The ratios obtained between MUFA (oleic acid) and PUFA (linoleic and linolenic acid) differ significantly between the two techniques. Τhe deviations in the peak area were also reflected in the ratios of fatty acids. This is due to an underestimation in the GC-MS analysis of the PUFAs (linoleic, linolenic), which are in the denominator of the above fractions. Τhe smallest difference produced by the two methods in the oleic acid/linoleic acid ratio was found in olive oil and pomace oil. These acids had such high areas that their ratios in GC-FID and GC-MS were less affected.
|
Oleic acid/ |
Oleic acid/ |
|||
| EDIBLE OILS | GCRatio | GC-MSratio | GCratio | GC-MS ratio |
| Olive oil | 11.95 | 12.79 | 101.30 | 130.09 |
| Pomace oil | 5.69 | 5.89 | 94.75 | 99.89 |
| Corn oil | 0.60 | 0.75 | 31.65 | 38.09 |
| Soybean oil | 0.47 | 0.61 | 4.26 | 5.33 |
| Cannabis oil | 0.45 | 0.57 | 1.28 | 1.61 |
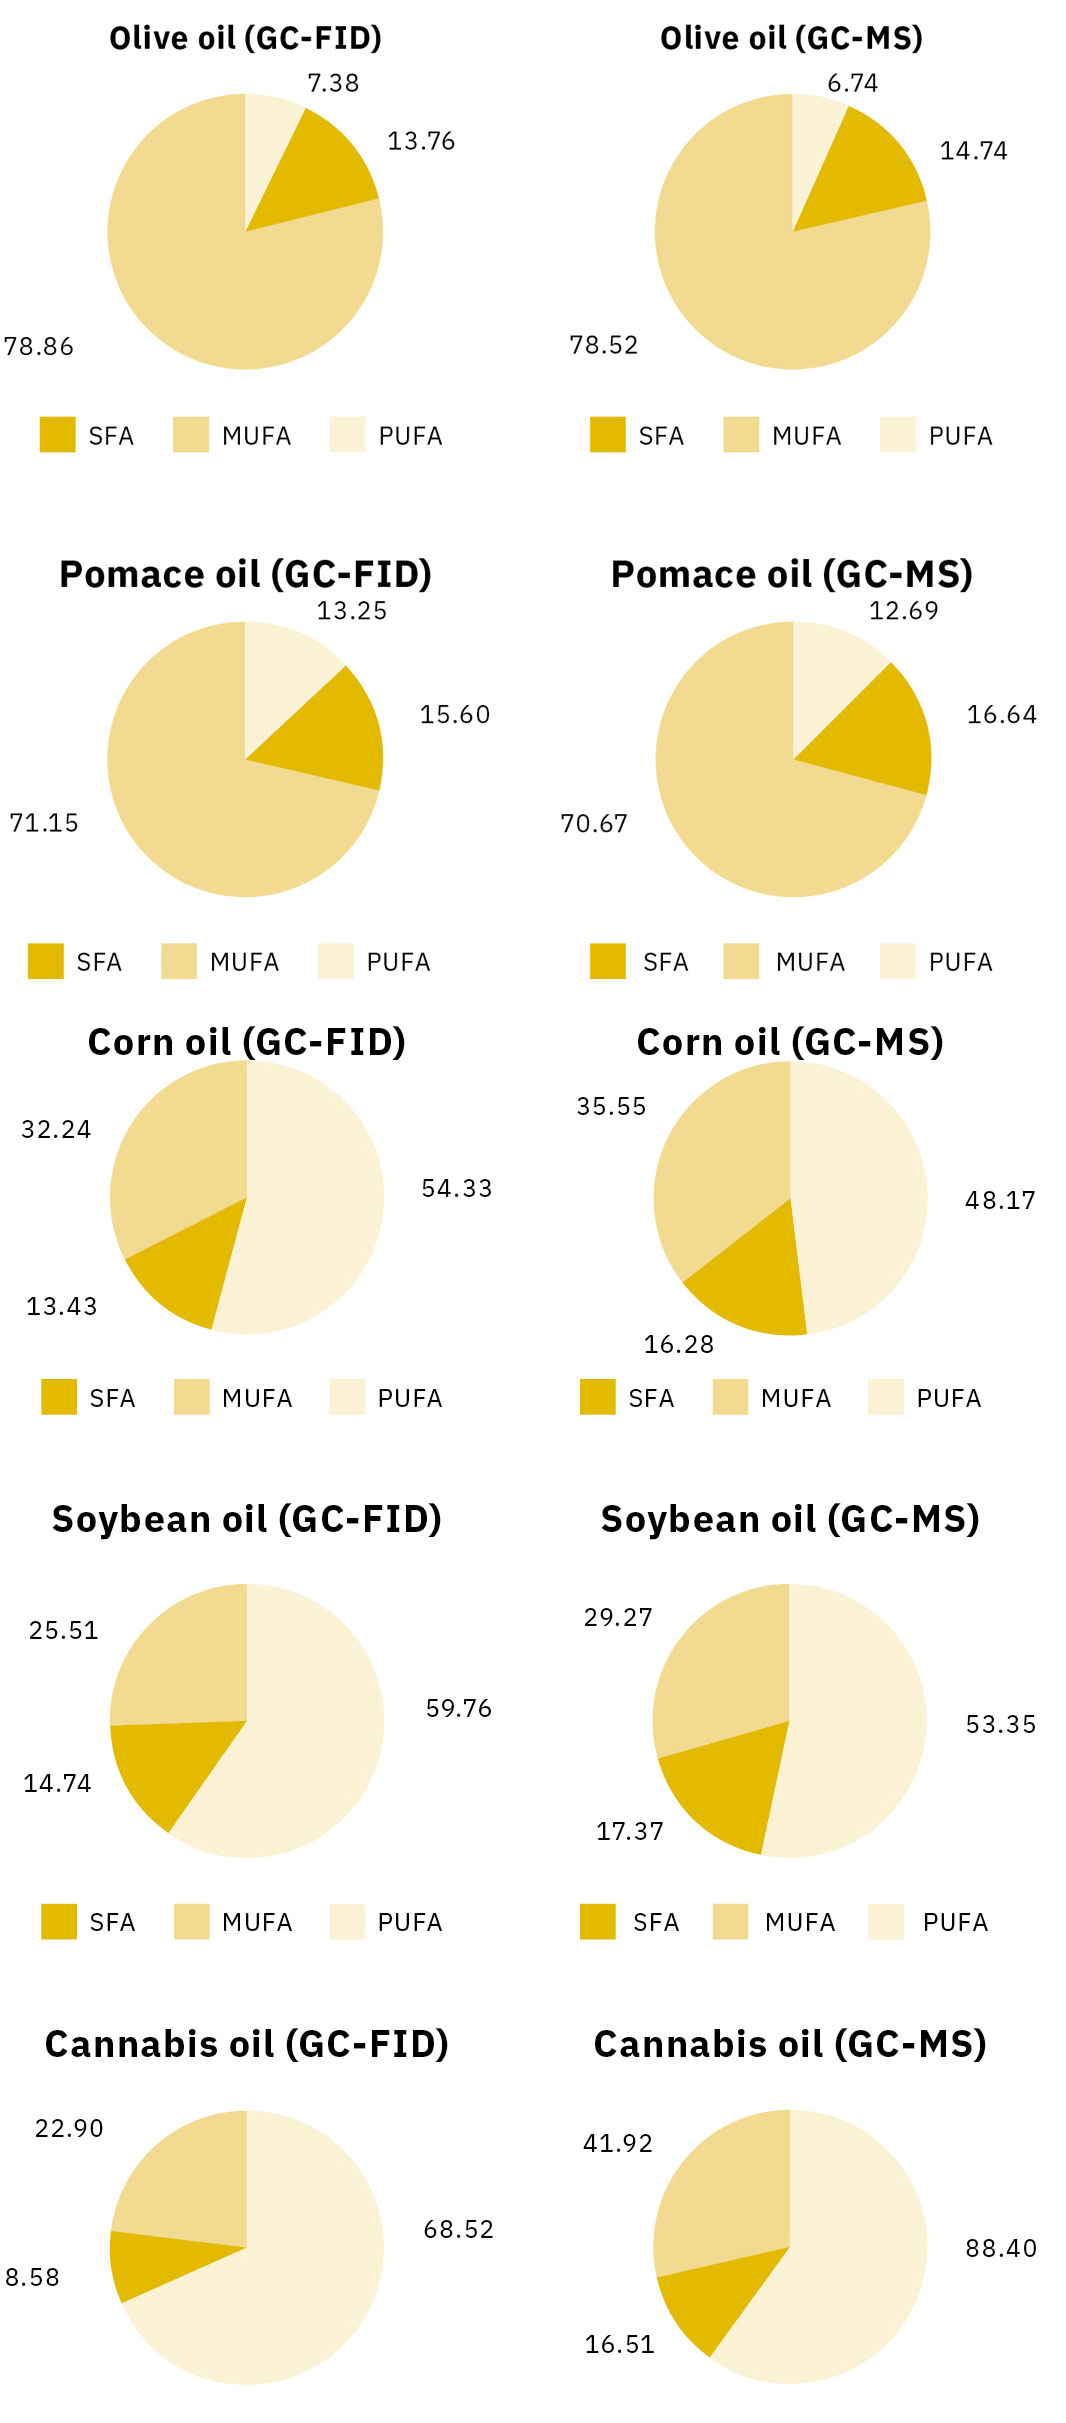
Figure 1: Percentage (%) of SFA, MUFA, PUFA in olive oil and pomace oil
Figure 2: Figure 2: Percentage (%) of SFA, MUFA, PUFA in corn oil, soybean oil and cannabis oil

SFA – MUFA – PUFA
The percentages of SFA, MUFA and PUFA were compared in the five edible oils. Peaks of palmitic and stearic acids were chosen for SFA, a peak of oleic acid for MUFA and the sum area of linoleic and linolenic acids for PUFA.
The percentage of MUFA in olive oil and pomace oil showed the same values in both the GC-FID and the GC-MS techniques. The abundance of oleic acid in these samples (> 65 %) eliminated the deviations in SFA and PUFA levels. This was different from the rest of the samples as the percentages showed significant deviations. SFA (palmitic and stearic acid) always showed higher values using GC-MS.

The meaning of the results
In this study, five samples were analyzed with both GC-FID and GC-MS techniques. The quantitative results of both techniques were compared, and the evidence obtained showed conclusively why GC-FID remains the benchmark method in the quantitative analysis of fatty acids, despite the development of newer instrumentation.
Nonetheless, the GC-MS technique was shown to clearly add value to the analysis of edible oils. In particular by combining the robustness of the GC-2030 for targeted analysis with the high sensitivity of the GCMS-QP2020NX to obtain structural information for a large number of compounds in each sample, researchers were able to show how much more information could be obtained.
To summarize: While GC-FID clearly answers the question of “how much” for known peaks, GC-MS sensitively answers the question of “what else exists” for unknown peaks, thus enabling a much more thorough screening of the samples.

Figure 6: GC-2030

Figure 7: GCMS-QP2020NX
Demonstrating what GC-MS adds
To demonstrate this conclusion, the researchers used GC-MS data to identify squalene in three samples. Squalene is a naturally occurring triterpenoid and serves as a biochemical precursor to sterols. It was first identified in shark liver oils and has been shown to have significant medicinal, therapeutic and cosmetic applications.[5] Although squalene is not considered a fatty acid, the researchers also decided to use the GC-MS method to assess its nutritional value in the oils sampled.
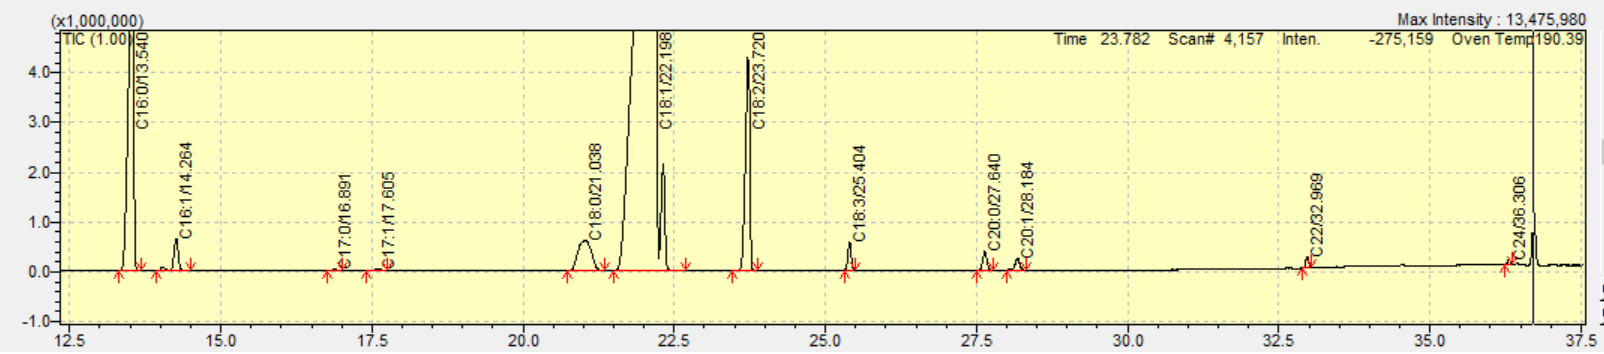
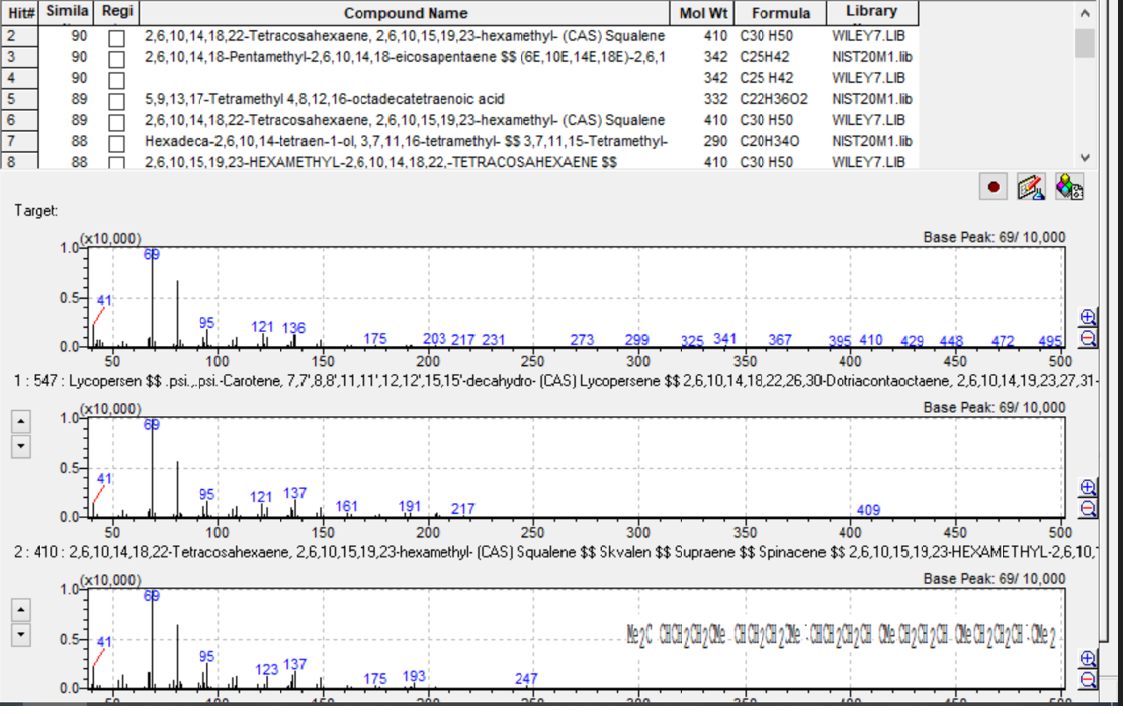
Squalene’s mass spectrum was acquired by mass-to-charge (m/z) range 40–500. The single ion monitoring method (SIM) was determined after the identification of the most abundant and characteristic ions in SCAN conditions.
Three of edible oils (olive oil, pomace oil, corn oil) were shown to contain squalene in different concentrations. GC-MS determination of squalene was accomplished by retention time and, for confirmation, by referencing the NIST-20 and Wiley-7 libraries for structural identification. The library search for this target compound had a 90 % similarity index. Also, the presence of m/z:69 as the target ion and m/z:81, m/z:41 as ref. ions at the same retention time confirmed the squalene detection.
By complementing GC-FID with GC-MS – apart from the determination of fatty acids – it was confirmed that olive oil is the most important source of squalene among edible oils. Pomace oil showed lower levels, while corn oil had even lower levels. Squalene was not detected at all in cannabis oil or soybean oil.
|
EDIBLE OILS |
SQUALENE – GCMS (TIC) |
| Olive oil | 3893755 |
| Pomace oil | 997549 |
| Corn oil | 231087 |
Working together to achieve more
In this study, researchers showed that GC-FID in the analysis of fatty acids in edible oils is, in fact, the most appropriate technique. In contrast, the integration of Total Ion Chromatograms (TIC) showed that this did not give reliable results. Yet even if GC-FID performs very well in quantitative analysis, it still only screens a very narrow group of compounds. This study showed that, by complementing the use of GC-FID with that of GC-MS, a far broader spectrum of compounds could be identified, which offers important information for determining the nutritional value of edible oils. Finally, this additional step can be done quickly and effortlessly by utilizing the NIST library, as demonstrated in the determination of squalene.
Bibliography/Further Information
[1] Tingting Zhu, Xiao-Ting Lu, Zhao-Yan Liu and Hui-Lian Zhu, 26 July 2022 Sec. Nutritional Epidemiology, “Dietary linoleic acid and the ratio of unsaturated to saturated fatty acids are inversely associated with significant liver fibrosis risk: A nationwide survey Front. Nutr.”.
[2] Jasmin Kharazmi-Khorassani, Roshanak Ghafarian Zirak, Hamideh Ghazizadeh, Reza Zare-Feyzabadi, Sara Kharazmi-Khorassani, Sharzad Naji-Reihani-Garmroudi, Elham Kazemi, Habibollah Esmaily, Ali Javan-Doust, Hamed Banpour, Maryam Mohammadi-Bajgiran, Mohamad reza Besharatlou, Gordon A. Ferns, Mohammad Hashemi, and Majid Ghayour-Mobarhan, Acta Biomed. 2021; 92(2), “The role of serum monounsaturated fatty acids (MUFAs) and polyunsaturated fatty acids (PUFAs) in cardiovascular disease risk”.
[3] Lee Hooper, Nicole Martin, Oluseyi F. Jimoh, Christian Kirk, Eve Foster, Asmaa Abdelhamid S., 21 August 2020, The Cochrane Database of Systematic Reviews, “Reduction in saturated fat intake for cardiovascular disease”.
[4] https://www.efsa.europa.eu/en/efsajournal/pub/1461 European Food Safety Authority, 25 March 2010, “Scientific Opinion on Dietary Reference Values for fats, including saturated fatty acids, polyunsaturated fatty acids, monounsaturated fatty acids, trans fatty acids, and cholesterol”.
[5] Suzanne M. Budge, Christopher Barry, MethodsX. 2019; 6: 15–21, “Determination of squalene in edible oils by transmethylation and GC analysis”.