Faster and automated analysis of aroma compounds in cosmetics
Digital precision of the Smart Aroma Database simplifies formerly complex task
Dr. Waldemar Weber, Shimadzu Europa GmbH

Dr. Waldemar WeberShimadzu Europa GmbH
Aromas have a major effect on consumers – particularly with foods and cosmetics. Personal care brands and products are often judged by how they smell. In product testing labs, fragrances are typically evaluated by highly trained experts, and evaluations are quite time-consuming. In recent years, this has led to increasing interest in the use of instrumental analysis to speed up productivity. Gas chromatography can be used, but sample complexity makes it difficult to do this as quickly and accurately as desired. This article describes a fast and precise technique for analyzing aromas in cosmetics using Shimadzu’s Smart Aroma Database.
Aroma analysis is an important part of ensuring that brands and products – especially in the food and personal care sectors – appeal to consumers. Traditionally, such analyses were done manually by a limited number of highly trained experts. This method is very time-consuming, and industry has sought to supplement or even replace this with instrumental analyses. Yet even using gas chromatography can be challenging due to the large number of analytes and the requirement for very experienced operators capable of using sophisticated technical solutions such as multidimensional chromatography or special software for so-called deconvolution.
Clearly, labs and companies working in the field of aroma analysis could use a more speedy and accurate method, ideally one which regular lab technicians can easily operate. This article describes a new method that meets those criteria.
Analysis using the Smart Aroma Database
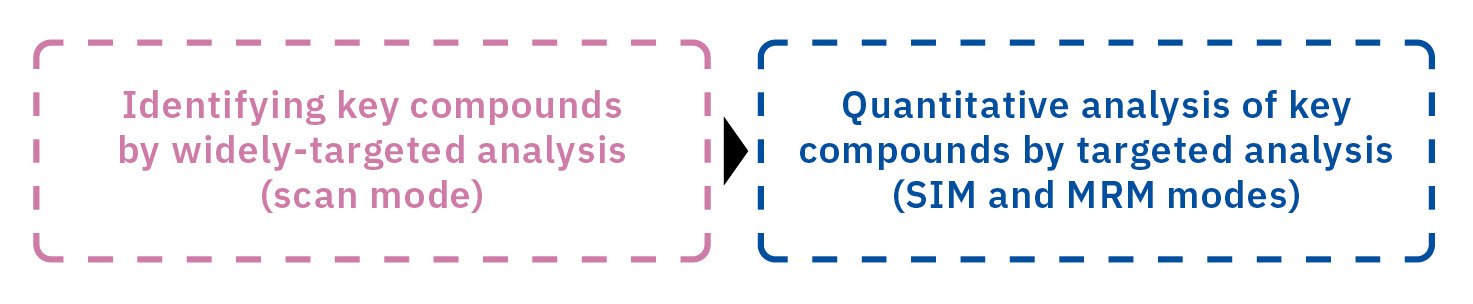
The key to simplifying this complex work is the Smart Aroma Database, which contains analytical information for approximately 500 types of important compounds relevant to fragrances. It provides support for the entire analytical process: from a widely targeted analysis of several hundred important compounds to a high-sensitivity target analysis of key sample compounds using selected ion monitoring (SIM) and multiple reaction monitoring (MRM). When using the Smart Aroma Database, the creation of analytical methods only requires an adjustment of retention times using a standard n-alkane mixture before sample analysis. The results can then be used to automatically and accurately identify the relevant target aroma compounds based on multiple decision criteria, such as retention times, similarity scores and ion ratios.
Samples and analytical conditions
A 20-mg sample of a commercial lip gloss was weighed and sealed in a screw vial for solid phase microextraction (SPME) analysis. First, the compounds contained in the sample were identified by scan-mode analysis using analytical conditions registered in the Smart Aroma Database. Next, SIM and MRM methods were automatically created for the identified compounds, and the sample was analyzed in SIM and MRM modes (Table 1).
Using the Smart Aroma Database
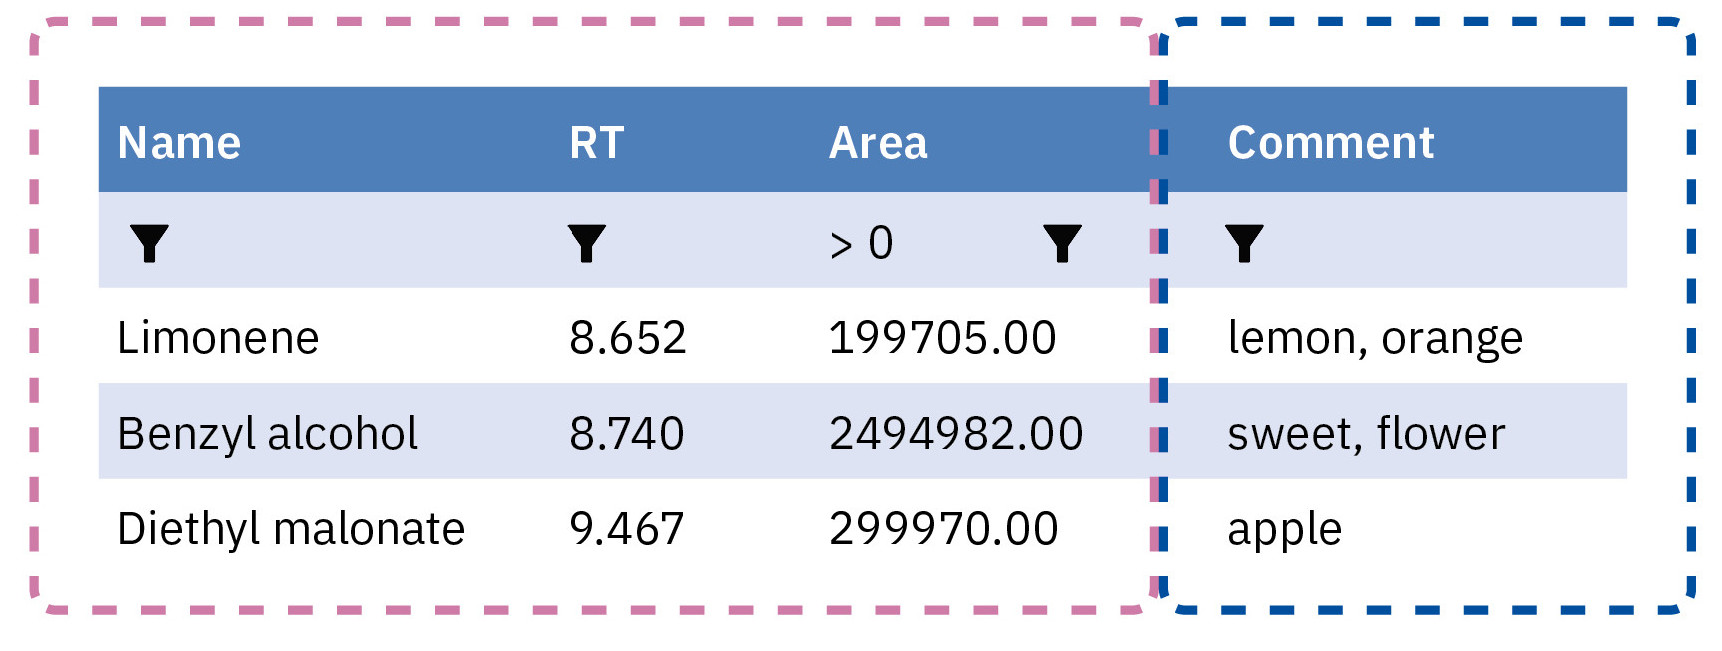
Using the Smart Aroma Database, 31 aroma compounds were detected by scan-mode analysis. These compounds and the corresponding library search similarity scores are listed in Table 2. The Smart Aroma Database narrows down the list of target compounds based on retention times and ion ratios as well as on the similarity scores from searching the library. This results in a more precise and efficient targeted analysis. In addition, as the sensory information is registered, the aroma characteristics of compounds can be checked simultaneously when identification results are obtained (Figure 3). Evaluating product aromas requires determining how the respective compounds affect the product fragrance. With the Smart Aroma Database, identification results and sensory information can be checked at the same time, which is useful for basic evaluations used to determine aroma formulations.
SIM- and MRM-mode analysis
Next, the 31 compounds identified by scan mode were analyzed using the SIM and MRM methods automatically created by the Smart Aroma Database. Because fragrance is determined by the balance between respective aroma compounds, an accurate quantitative analysis is important. However, cosmetics and other personal care products often contain fragrances or active ingredients that are natural substances extracted from plants or other sources. Such compounds are typically detected along with multiple interfering peaks, which can make it difficult to accurately quantify target compounds due to coelutions.
|
System |
|
|
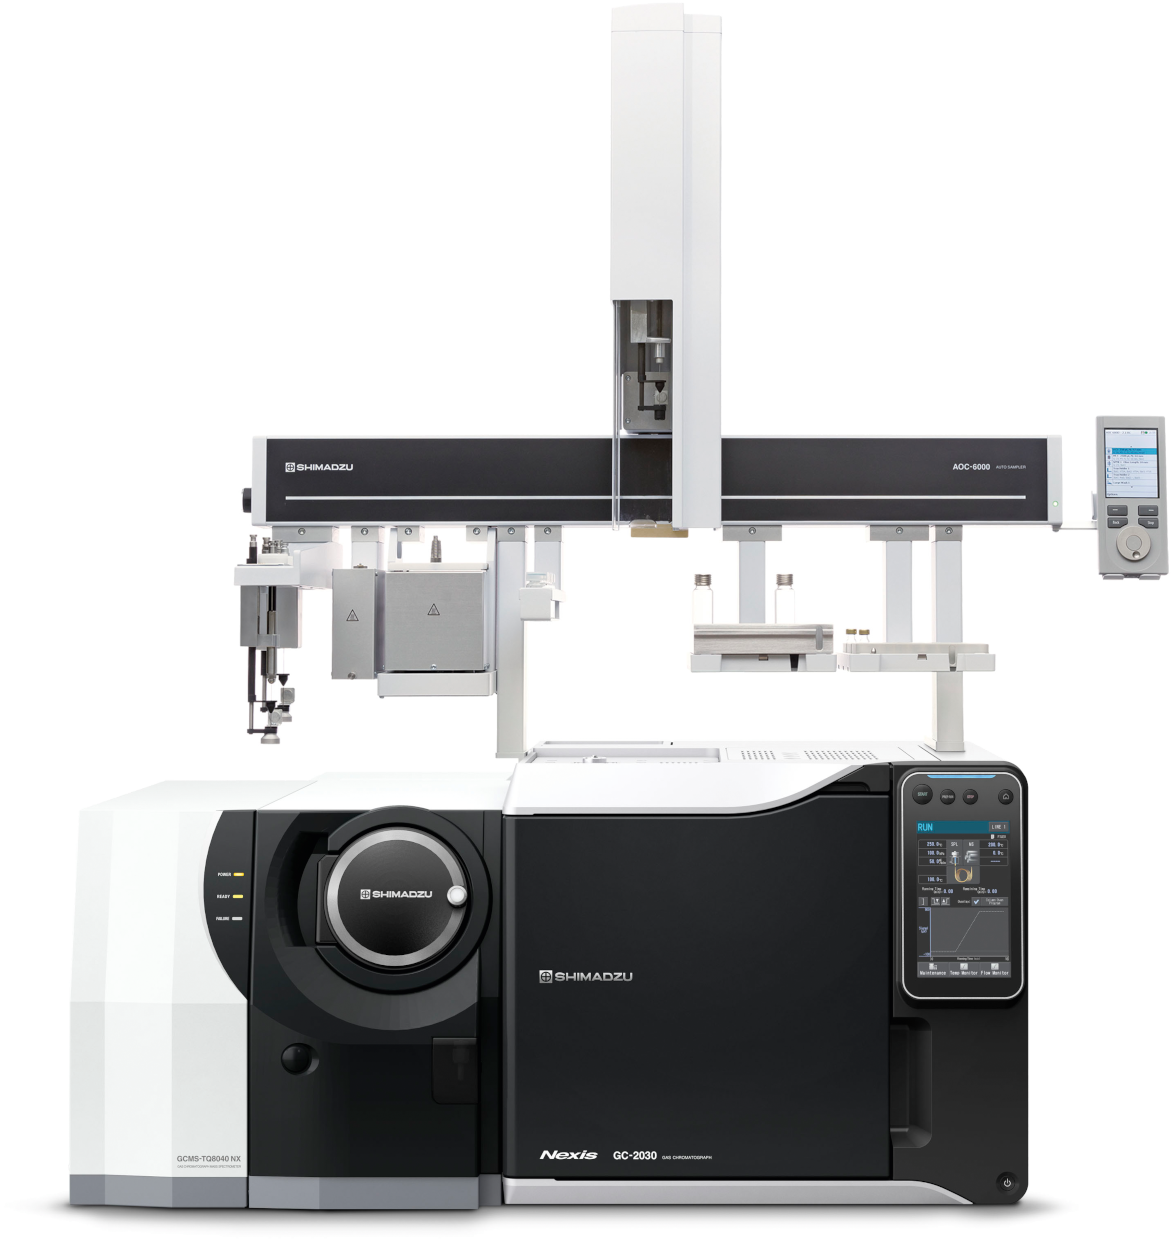
GCMS Model |
GCMS-TQ8040 NX |
|
Autosampler |
AOC-6000 plus |
|
Column |
SH-I-5Sil MS (30 m x 0.25 m I.D x 0.25 µm) |
|
AOC-6000 conditions |
|
|
SPME Arrow |
DVB/Carbon WR/PDMS |
|
Conditioning temp. |
270 °C |
|
Sample extract time |
30 min |
|
Sample desorb. time |
1 min |
|
GC Conditions |
|
|
Injection mode |
Split |
|
Split ratio |
5 |
|
Carrier gas |
He |
|
Carrier Gas Control |
Pressure (83.5 kPa) |
|
Column temperature |
50 °C (5 min) -> 10 °C/min -> 250 °C (10 min) |
|
MS conditions |
|
|
Ion Source temp. |
200 °C |
|
Interface temp. |
250 °C |
|
Data Acquisition Mode |
SCAN, SIM, MRM |
|
Scan Range |
m/z 35-400 |
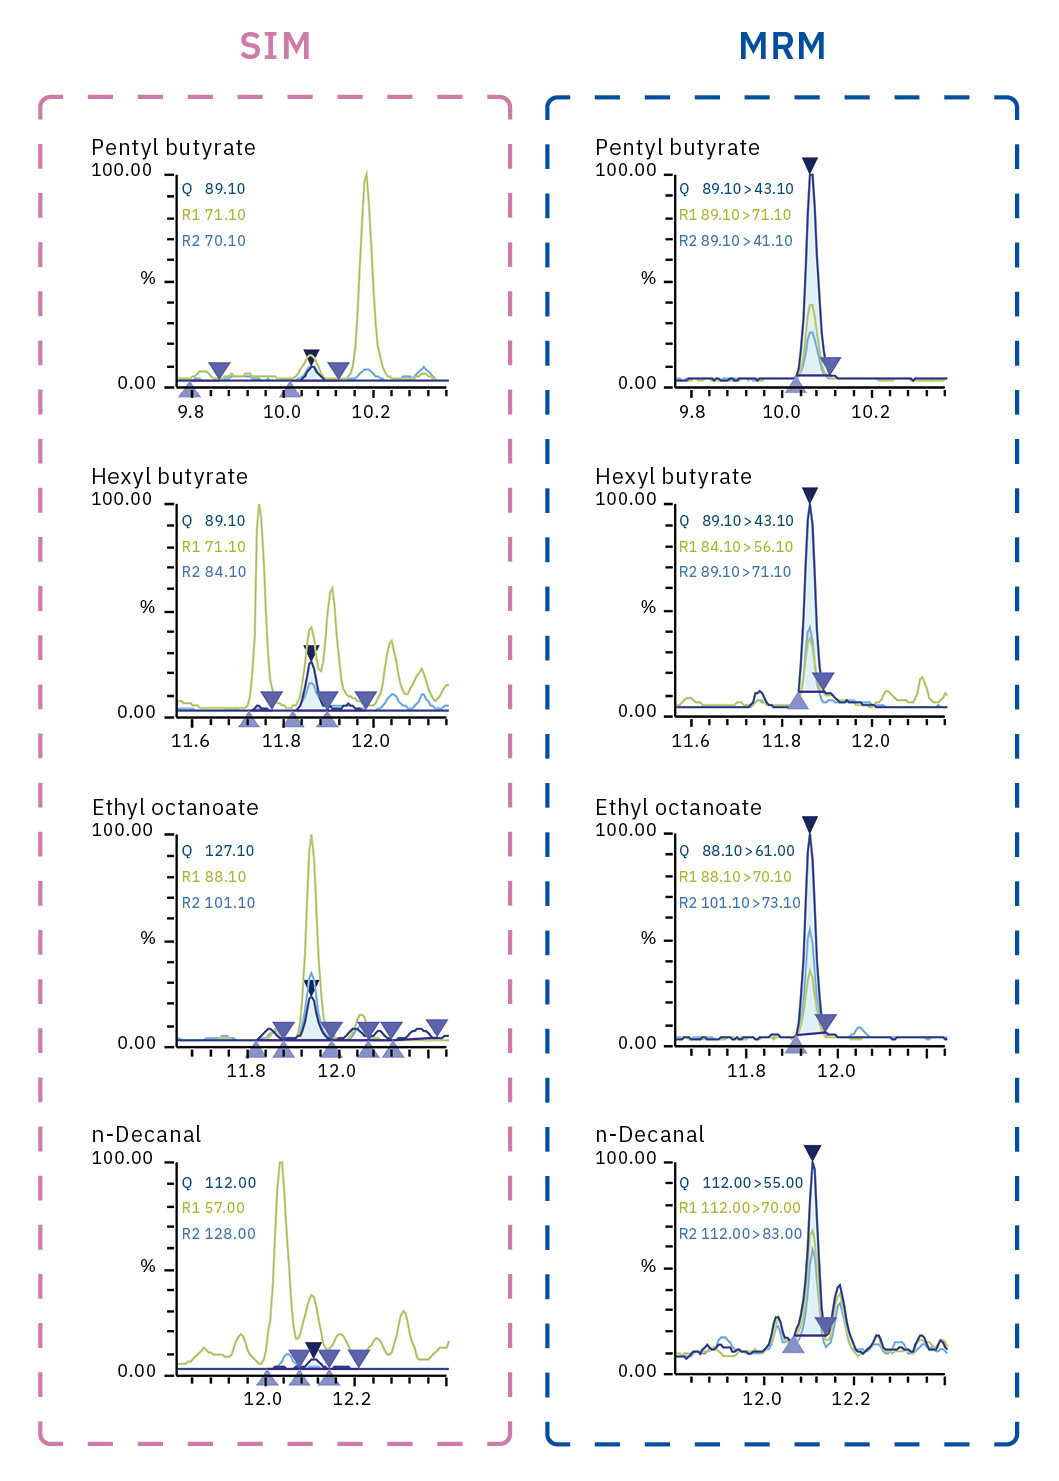
In particular, when comparing multiple analytes, contaminants can vary depending on the sample. When analyzing data from SIM-mode analysis, it may be necessary to make appropriate adjustments to quantitation ions or incorrectly identified peaks in accordance with the sample. In such cases, the higher selectivity of MRM-mode analysis can help minimize the effects so that target compounds can be quantitated more accurately.
Typically, determining MRM-mode analytical conditions is a difficult, time-consuming process. However, the Smart Aroma Database can create MRM methods for the selected compounds automatically, thus ensuring that advanced MRM-mode analyses can be performed easily without special experience or time-consuming steps. Figure 4 is a comparison of SIM- and MRM-mode analysis results, showing that a large number of contaminant peaks are included near target compounds in SIM mode, but that those targets are detected with greater selectivity in MRM mode. Thus, for cosmetics and other samples with complex matrices, MRM mode can be an effective way to suppress the effects of contaminants and achieve more accurate quantification and data analysis – with less effort.
Smart databases make a difference
Shimazu’s Smart Aroma Database enabled 31 aroma compounds emitted from lip gloss to be quickly identified. This helped to increase the accuracy and efficiency of qualitative analysis of aroma compounds by using mass spectral similarity scores calculated based on the aroma compound library. The library included within the database can narrow down the list of candidates – rather than using only mass chromatograms and ion comparisons for identification. By analyzing the specified internal standard in advance, it can also provide information about semiquantitative values useful for development work. In addition, the Smart Aroma Database can be used to easily create SIM and MRM methods for more sophisticated analyses of aroma compounds in cosmetics or other samples with complex matrices. And all of that makes a big difference.
|
Compound |
Similarity Score |
|
1-Butanol |
95 |
|
Methyl Butanoate |
96 |
|
Ethyl isobutyrate |
92 |
|
Ethyl butanoate |
96 |
|
Ethyl lactate |
92 |
|
Butyl acetate |
97 |
|
Ethyl 2-methylbutyrate |
96 |
|
cis-3-Hexen-1-ol |
80 |
|
Isoamyl acetate |
97 |
|
Methyl hexanoate |
96 |
|
Benzaldehyde |
94 |
|
Ethyl hexanoate |
94 |
|
Octanal |
88 |
|
(3Z)-3-Hexenyl acetate |
95 |
|
Hexyl acetate |
98 |
|
Compound |
Similarity Score |
|
Limonene |
96 |
|
Benzyl alcohol |
94 |
|
Diethyl malonate |
93 |
|
(E)-Linalool oxide |
84 |
|
Pentyl butyrate |
92 |
|
Linalool |
96 |
|
Nonanal |
94 |
|
Benzyl acetate |
94 |
|
(Z)-3-hexenyl butyrate |
96 |
|
Hexyl butyrate |
85 |
|
Ethyl octanoate |
92 |
|
n-Decanal |
95 |
|
Benzyl butyrate |
81 |
|
Methyl cinnamate |
86 |
|
gamma-Decalactone |
93 |
|
gamma-Undecalatone |
93 |