Simplifying the potency-testing of CBD gummies for labs
Flexible new method streamlines accurate assessment of cannabidiol content in gummy-based sweets

The recent and rapid growth of the global cannabinoid industry has included the commercial introduction of a wide range of nutraceutical products. Among the most popular of these are gummy-based candies. Shimadzu conducted a series of experiments to assess the ability of currently available equipment to measure cannabidiol (CBD) potency in gummy-based candy. The extraction method was evaluated by standard addition, using non-cannabinoid containing, as well as commercially available CBD gummies. The tests clearly showed that simple solvent extraction, followed by HPLC analysis on the i-Series LC-2060 with photodiode array (PDA) detector provided a sensitive, robust method for accurately extracting and measuring CBD content, while using minimal additional laboratory equipment.
Background
In recent years, the cannabis plant has been receiving renewed attention, and much of that has been of a positive nature. While its use for medicinal or recreational purposes is still subject to much debate, products containing < 0.2% of the psychoactive compound Δ9-tetrahydrocannabinol (THC) have long been legal in many countries.
As a result of these two factors, the market for edibles containing cannabidiol (CBD) has expanded dramatically. This has increased the burden on manufacturers for accurate quantification of cannabinoids in their products, e.g. for accurate labeling, consumer safety, quality control and regulatory compliance. Especially with products that resemble children’s candies – such as CBD-containing gummy bears – it is essential to guarantee the absence of any potentially intoxicating ingredients.
Origins of the study
Angela Jein, a liquid chromatography technical specialist with Shimadzu in the UK, had become increasingly aware that both manufacturers and laboratories were facing challenges in quantifying the CBD content of their confectionary products. Eventually, and despite the complications posed by the Covid-19 pandemic and the restrictions imposed by it, Angela was able to initiate a six-month-long study of how CBD extraction processes could be improved to better meet market needs.
Goals & challenges
Goal No. 1: Testing a new method for better performance
According to Angela Jein, the first goal of the study was to test and ”provide a simple, yet reliable method for extraction and analysis of cannabinoids (in CBD nutraceuticals) to make it easy and straightforward for manufacturers and control labs to ensure their quality.”
Challenge: Dealing with complex matrices
Analysis of active ingredients in edibles in general is always challenging, as food samples contain a large variety of substances that can interfere with the assay (i.e. the determination of specific amounts of defined compounds within a solution). In gummy-based candies (Figure 1), the high sugar and gelatine content are such challenges.
In addition, recent general trends have created other complications. Cannabinoid gummies have increasingly developed in line with the market demand for vegan and sugar-free alternatives to conventional products, which are often gelatine-based and contain sugar.
To overcome these obstacles, the most effective way to accurately measure the analytes of interest is to combine an efficient and selective extraction method with a ”blank” reference sample from a gummy matrix containing no cannabinoids. The blank is then ”spiked” by the addition of a known concentration of cannabinoid standard, followed by extraction and quantification. In this manner, the recovery and accuracy of the method can be properly established.
Goal No. 2: Creating an economical method
The second goal of the study focused on the bottom-line practicalities of testing. Again, according to Angela Jein, the few CBD extraction methods available for food, cosmetic and nutraceutical products ”usually feature a large amount of high-tech equipment, such as cryogenic sample preparation, automated shaking equipment, centrifuges and more.” Therefore, the scope of this test included the goal of constructing a robust method whereby the extraction procedure could be satisfactorily achieved with minimal additional laboratory equipment.
Challenge: Limiting the need for additional laboratory equipment
The analysis of edibles poses a challenge for the many laboratories not stocked with the entire range of traditional extraction equipment, including macerators, centrifuges, water baths, mechanical shakers, rotary evaporators, etc.
The study – in detail
Materials and methods
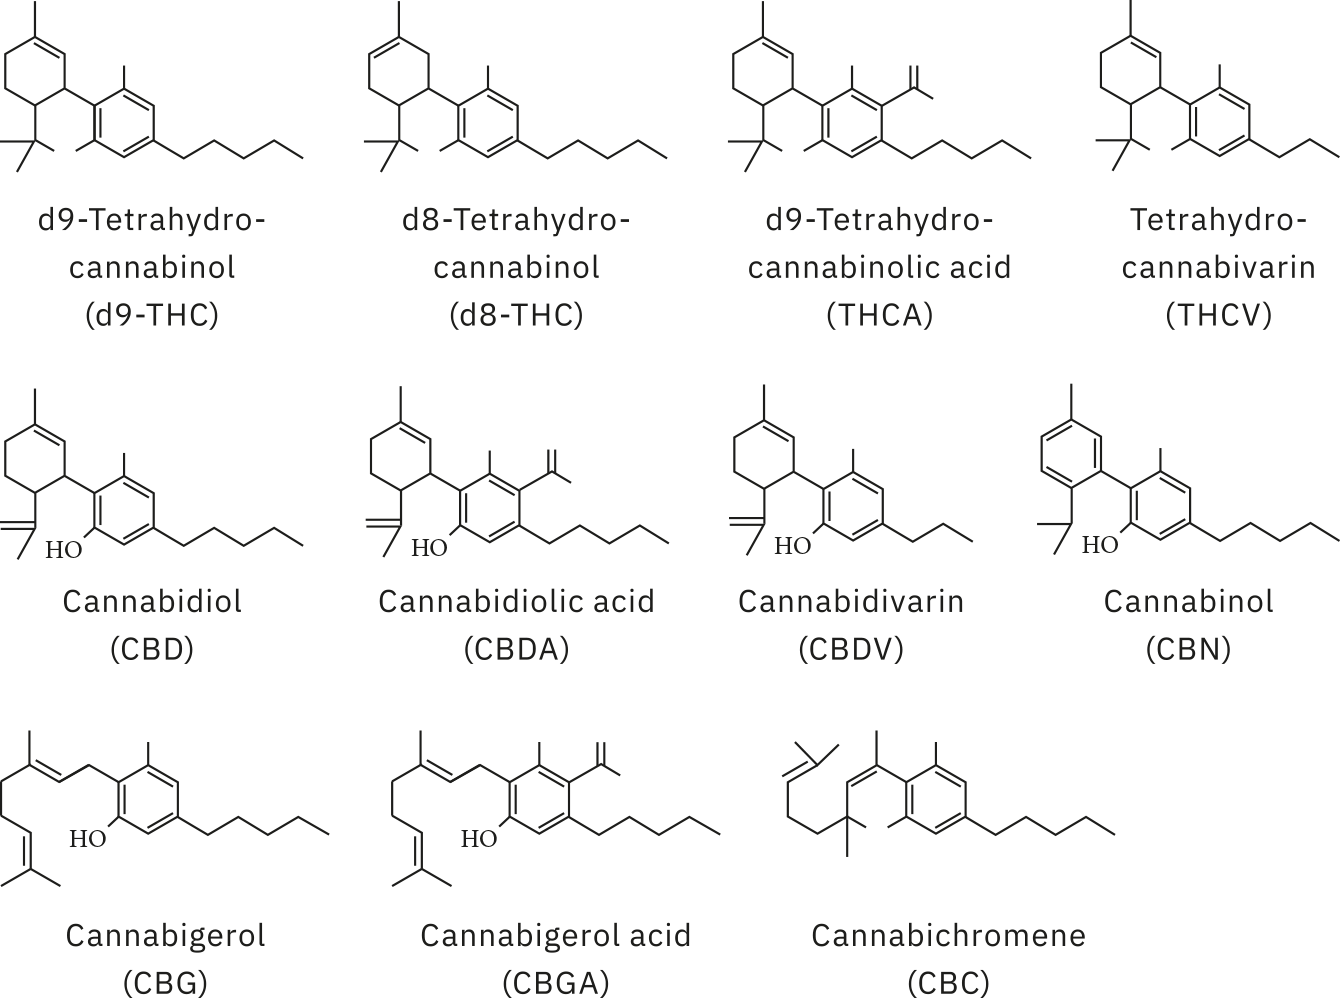
Analysis of all samples was carried out using Shimadzu’s high sensitivity method for potency testing [1], run on the LC-2060 with photodiode array (PDA) detector, an integrated i-Series ultra-high-performance liquid chromatography (UHPLC) system. Reference standards were prepared from individual cannabinoid standards across a concentration range of 0.5 to 90.9 ppm for 11 cannabinoids (Figure 2): cannabidivarin (CBDV); cannabidiolic acid (CBDA); cannabigerolic acid (CBGA); cannabigerol (CBG); cannabidiol (CBD); tetrahydrocannabdivarin (THCV); cannabinol (CBN); Δ9-tetrahydrocannabinol (Δ9-THC); Δ8-tetrahydrocannabinol (Δ8-THC); cannabichromene (CBC); Δ9-tetrahydrocannabinolic acid (THCA).
Sample preparation
The spiking solution (A) for CBD-only was prepared at approximately 100 mg/L using an isolate of CBD with known purity in methanol. The spiking solution (B) for all cannabinoids was prepared by placing a known volume of each cannabinoid directly into the sample.
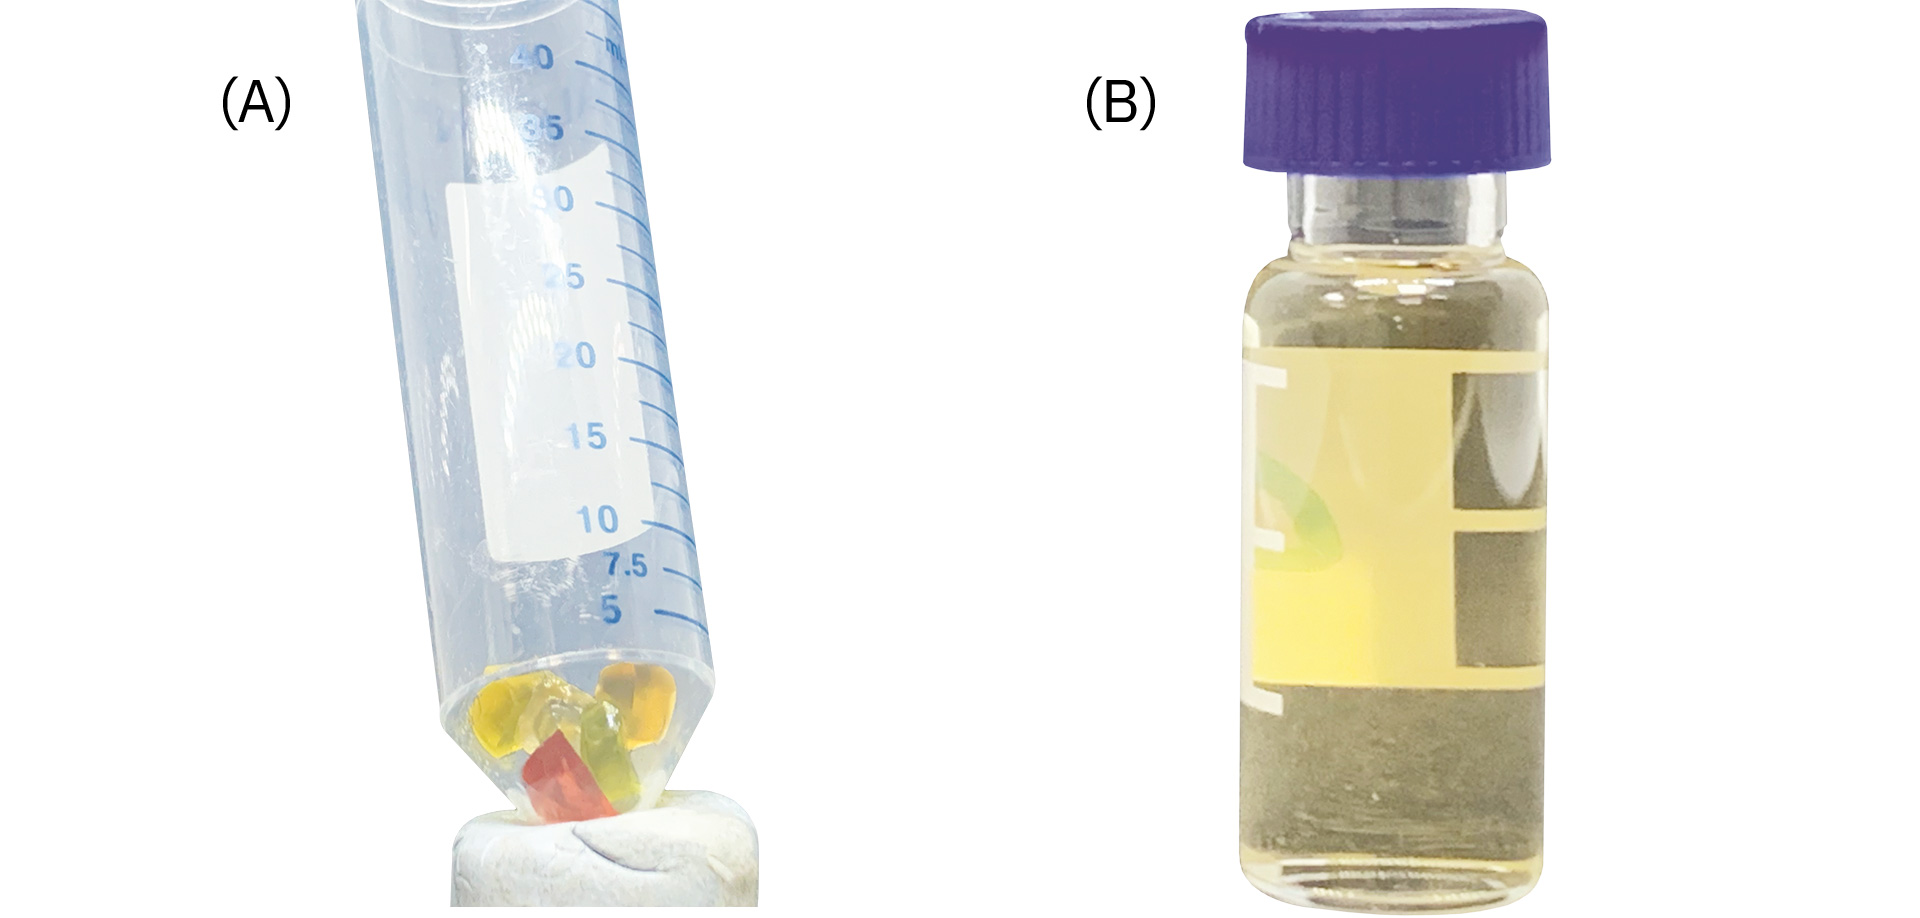
Control gummy confectionary with no cannabinoid content is commercially available and was used as a blank reference to validate the extraction method. These gummies were cut into small pieces and thoroughly mixed to form a representative sample.
Spiking with specific quantities of spiking solution A or B was carried out and allowed to absorb into the gummy before proceeding with the extraction method depicted in
Figure 3.
To evaluate the precision of the extraction procedure, six replicate samples were prepared by addition of spiking solution A for a final CBD concentration of 20 ppm. In addition, two samples were spiked with solution (B) for duplicate analysis of all 11 cannabinoids after extraction.
Commercially available CBD edibles are sold in a wide range of sizes and concentrations, so accuracy testing was carried out in duplicate at 5 ppm, 20 ppm and 40 ppm.
To establish selectivity of the assay against unknown peaks present in the gummy matrix – and which could potentially interfere with the detection of cannabinoids – the following reference samples were tested:
- Clear (only) gummy / no spike
- Red (only) gummy / no spike
- Orange (only) gummy / no spike
- Yellow (only) gummy / no spike
- Green (only) gummy / no spike
- Gummy of all colors / no spike
- Randomly colored gummy / no spike
- No gummy present / spike
- No gummy present
For real-life samples, three commercially available CBD gummies (vegan and non-vegan), from two different manufacturers were analyzed using the method described. Sub-samples from each type were taken and prepared by cutting them into small pieces (< 1/16 sizes). Multiple aliquots (8) were tested for each sample to look at the robustness of the samples themselves.
Sample 1 – non-vegan – Manufacturer A [multicolored]
Sample 2 – vegan – Manufacturer A [multicolored]
Sample 3 – vegan – Manufacturer B [green only]
Results and discussion
Table 1 lists the results obtained for the precision, accuracy and selectivity of the extraction and quantification of CBD in the reference samples.
|
Identification / Number |
CBD content (ppm) |
% nominal |
|
|
Spiking solution A |
— |
107.2 mg/mL |
— |
|
Precision |
1 |
19.886 |
98.9 |
|
2 |
19.905 |
99.0 |
|
|
3 |
20.187 |
100.4 |
|
|
4 |
20.254 |
100.8 |
|
|
5 |
19.862 |
98.8 |
|
|
6 |
19.933 |
99.2 |
|
|
Accuracy |
1 (25% precision) |
4.984 |
99.2 |
|
2 (25% precision) |
4.930 |
98.1 |
|
|
3 (100% precision) |
20.109 |
100.1 |
|
|
4 (100% precision) |
19.839 |
98.7 |
|
|
5 (200% precision) |
39.821 |
99.1 |
|
|
6 (200% precision) |
40.194 |
100.0 |
|
|
Selectivity |
1 – Clear / No spike |
— |
— |
|
2 – Red / No spike |
— |
— |
|
|
3 – Orange / No spike |
— |
— |
|
|
4 – Yellow / No spike |
— |
— |
|
|
5 – Green / No spike |
— |
— |
|
|
6 – All / No spike |
— |
— |
|
|
7 – Mixed / No spike |
— |
— |
|
|
8 – Mixed with spike |
19.848 |
98.8 |
|
|
9 – No gummy / No spike |
— |
— |
|
|
Identification / Statistical Aspect |
CBD content (ppm) |
% nominal |
|
|
Precision |
Average |
20.005 |
99.5 |
|
Standard Deviation |
0.170 |
99.5 |
|
|
%RSD |
0.851% |
0.851% |
|
|
Accuracy |
Average 25% |
4.957 |
98.7 |
|
Standard Deviation |
0.038 |
0.008 |
|
|
%RSD |
0.770% |
0.770% |
|
|
Average 100% |
19.974 |
99.4 |
|
|
Standard Deviation |
0.191 |
0.009 |
|
|
%RSD |
0.956% |
0.956% |
|
|
Average 200% |
40.008 |
99.5 |
|
|
Standard Deviation |
0.264 |
0.007 |
|
|
%RSD |
0.659% |
0.659% |
|
To establish selectivity of the assay, all gummy samples were reviewed for any unknown peaks outside of the 11 cannabinoids. A signal at a retention time (tR) of 3.88 min was seen in all chromatograms at varying concentrations. It was found to represent CBD at a level of approximately 0.05 ppm, significantly below the lowest standard.
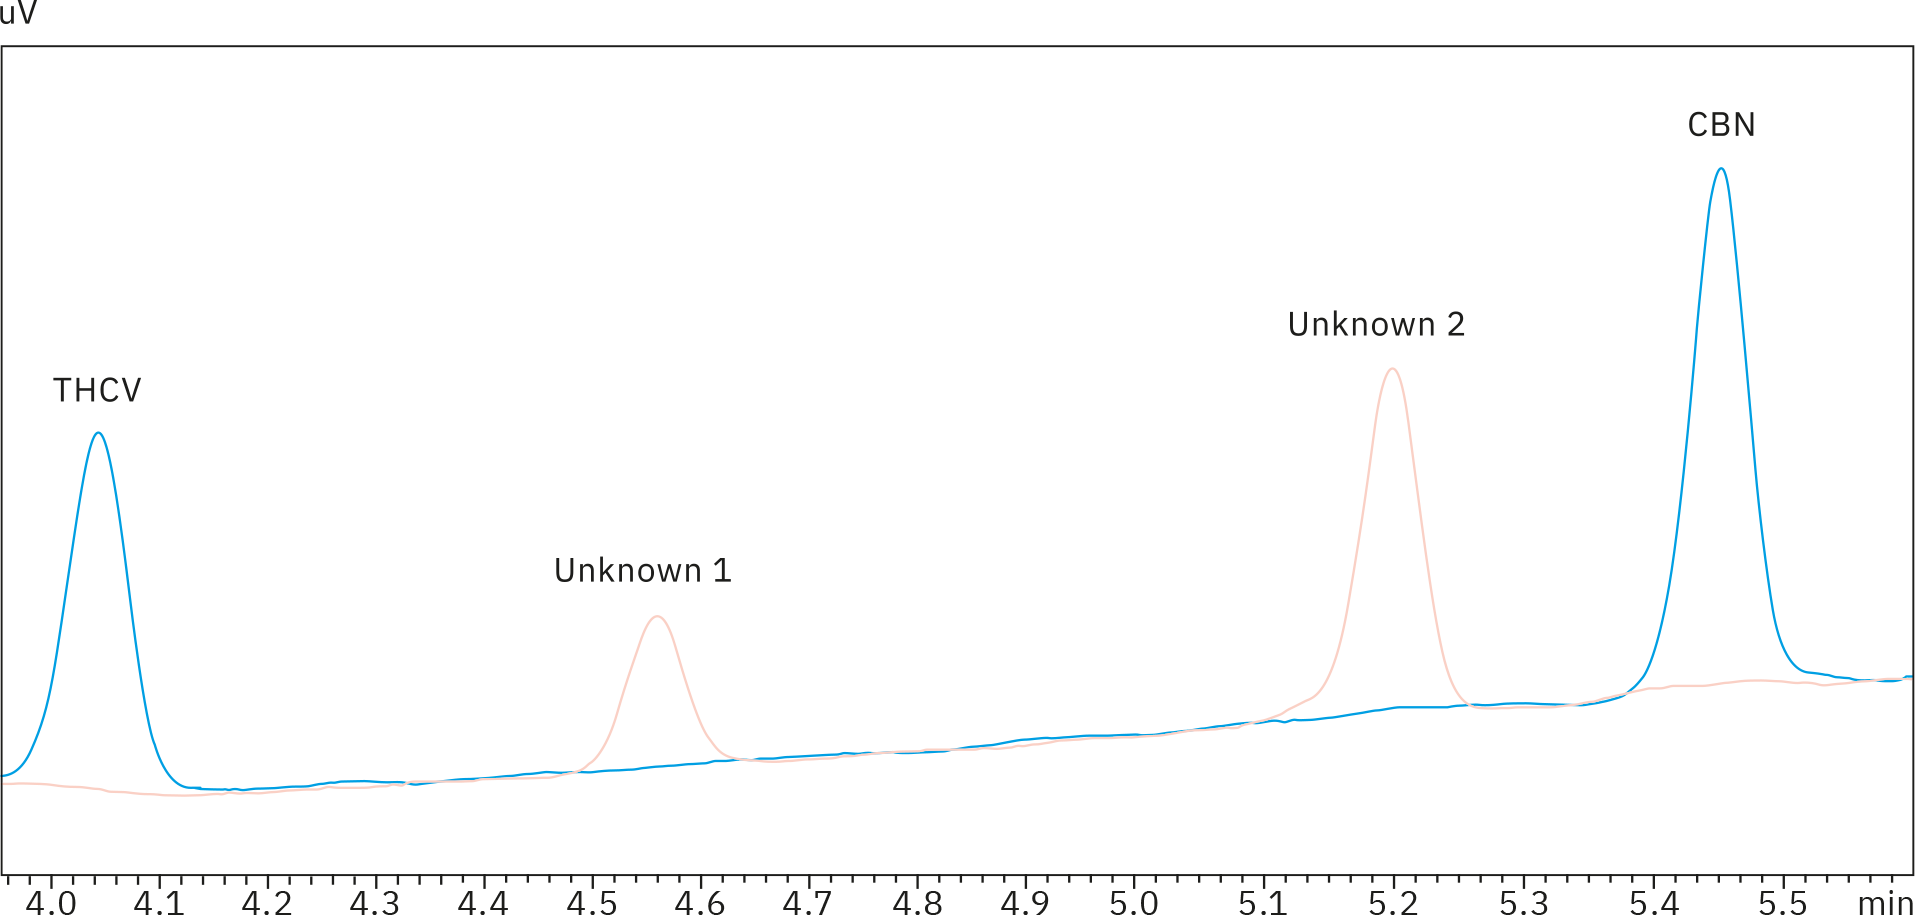
Gummy samples 4, 6, 7 and 8 also showed peaks at 4.52 and 5.15 minutes, most likely due to the yellow colorant in the product, which was the commonality in the four extracts. However, as these two signals – located between peaks of THCV and CBN – were well separated from any other compound of interest, they would not cause any misinterpretation or integration issues. Unknown peaks at tR = 4.52 and 5.15 min are present in reference sample 4, but not in a 0.5 ppm standard solution, as can be seen in the overlay of the two chromatograms (Figure 4).
Additional precision samples, spiked with solution (B) to contain all 11 cannabinoids, were also analyzed using the high sensitivity method. Due to the lower concentration of minor cannabinoids within samples they did not require the additional dilution step after extraction (Figure 3).
Table 3 displays the average recovery results and obtained %RSD for extraction of the two samples to evaluate precision of the procedure for all 11 cannabinoids.
|
Cannabinoid |
Mean content (ppm) |
% nominal |
%RSD |
|
CBDV |
1.976 |
98.8 |
0.465 |
|
CBDA |
2.032 |
101.6 |
1.427 |
|
CBGA |
2.030 |
101.5 |
0.627 |
|
CBG |
1.997 |
99.9 |
0.637 |
|
CBD |
2.033 |
101.7 |
0.835 |
|
THCV |
1.983 |
99.1 |
1.177 |
|
CBN |
1.969 |
98.4 |
1.401 |
|
D9-THC |
2.025 |
101.2 |
0.873 |
|
D8-THC |
1.967 |
98.3 |
1.043 |
|
CBC |
1.971 |
98.6 |
0.359 |
|
THCA |
2.008 |
100.4 |
0.493 |
The three selected commercially available products were extracted and analyzed for all 11 cannabinoids. In sample 1 and 2, the 10 minor cannabinoids were quantified using the non-diluted extract (A), while CBD was determined in the dilution (4 x as described in Figure 3). As sample 3 showed a lower amount of CBD, all cannabinoids were quantified using the non-diluted extract (A). Results of the quantification of cannabinoid content in real-life samples are displayed in Tables 4–6.
|
Result (mg/g) |
||||||||
|
1 |
2 |
3 |
4 |
5 |
6 |
7 |
8 |
|
|
CBDV |
<0.5 |
<0.5 |
<0.5 |
<0.5 |
<0.5 |
<0.5 |
<0.5 |
<0.5 |
|
CBDA |
— |
— |
— |
— |
— |
— |
— |
— |
|
CBGA |
— |
— |
— |
— |
— |
— |
— |
— |
|
CBG |
— |
— |
— |
— |
— |
— |
— |
— |
|
CBD |
4.490 |
4.923 |
4.812 |
4.783 |
4.839 |
4.959 |
4.614 |
4.681 |
|
THCV |
— |
— |
— |
— |
— |
— |
— |
— |
|
CBN |
<0.5 |
<0.5 |
<0.5 |
<0.5 |
<0.5 |
<0.5 |
<0.5 |
<0.5 |
|
D9-THC |
— |
— |
— |
— |
— |
— |
— |
— |
|
D8-THC |
— |
— |
— |
— |
— |
— |
— |
— |
|
CBC |
— |
— |
— |
— |
— |
— |
— |
— |
|
THCA |
<0.5 |
<0.5 |
<0.5 |
<0.5 |
<0.5 |
<0.5 |
<0.5 |
<0.5 |
|
Result (mg/g) |
||||||||
|
1 |
2 |
3 |
4 |
5 |
6 |
7 |
8 |
|
|
CBDV |
<0.5 |
<0.5 |
<0.5 |
<0.5 |
<0.5 |
<0.5 |
<0.5 |
<0.5 |
|
CBDA |
— |
— |
— |
— |
— |
— |
— |
— |
|
CBGA |
— |
— |
— |
— |
— |
— |
— |
— |
|
CBG |
— |
— |
— |
— |
— |
— |
— |
— |
|
CBD |
4.541 |
4.463 |
4.294 |
4.548 |
4.550 |
4.124 |
4.595 |
4.520 |
|
THCV |
— |
— |
— |
— |
— |
— |
— |
— |
|
CBN |
<0.5 |
<0.5 |
<0.5 |
<0.5 |
<0.5 |
<0.5 |
<0.5 |
<0.5 |
|
D9-THC |
— |
— |
— |
— |
— |
— |
— |
— |
|
D8-THC |
— |
— |
— |
— |
— |
— |
— |
— |
|
CBC |
<0.5 |
<0.5 |
<0.5 |
<0.5 |
<0.5 |
<0.5 |
<0.5 |
<0.5 |
|
THCA |
<0.5 |
<0.5 |
<0.5 |
<0.5 |
<0.5 |
<0.5 |
<0.5 |
<0.5 |
|
Result (mg/g) |
||||||||
|
1 |
2 |
3 |
4 |
5 |
6 |
7 |
8 |
|
|
CBDV |
— |
— |
— |
— |
— |
— |
— |
— |
|
CBDA |
— |
— |
— |
— |
— |
— |
— |
— |
|
CBGA |
— |
— |
— |
— |
— |
— |
— |
— |
|
CBG |
— |
— |
— |
— |
— |
— |
— |
— |
|
CBD |
0.903 |
0.608 |
0.733 |
0.677 |
0.726 |
0.713 |
0.968 |
0.637 |
|
THCV |
— |
— |
— |
— |
— |
— |
— |
— |
|
CBN |
— |
— |
— |
— |
— |
— |
— |
— |
|
D9-THC |
— |
— |
— |
— |
— |
— |
— |
— |
|
D8-THC |
— |
— |
— |
— |
— |
— |
— |
— |
|
CBC |
— |
— |
— |
— |
— |
— |
— |
— |
|
THCA |
— |
— |
— |
— |
— |
— |
— |
— |
As CBD was the only peak found in all three samples within the concentration range, statistical analysis of CBD alone was performed on the eight extractions. The results are shown in Table 7.
|
Sample# |
Average |
Standard Deviation |
%RSD |
mg/gummy |
% nominal |
|
1 |
4.762 |
0.159 |
3.33 |
9.51 |
95.1 |
|
2 |
4.454 |
0.162 |
3.64 |
18.86 |
94.3 |
|
3 |
0.746 |
0.126 |
16.91 |
2.41 |
48.2 |
Additional information for the gummies analyzed was also considered. The concentration displayed on commercial products is typically represented by mg/gummy or mg/bag and the number of gummies reported. Accordingly, the analysis was carried out by weighing 10 pieces from each sample to obtain an average weight of the gummies.
Sample 1 – 19.9713 g/10 gummies [10 mg/gummy]
Sample 2 – 42.3488 g/10 gummies [20 mg/gummy]
Sample 3 – 32.2951 g/10 gummies [5 mg/gummy]
Results shown in Table 7 also include the mg/gummy results and the % nominal results as stated on the packaging.
Conclusion
The study concluded that Shimadzu’s high sensitivity method for potency testing using the i-Series LC-2060 with photodiode array (PDA) detector provided a highly robust way to accurately measure CBD content and a simple solvent extraction procedure limiting the overall amount of additional laboratory equipment required for sample pretreatment.
Evaluations of extractions of spiked gummy bears provided accurate data with good recoveries (greater than 98%, < 1.5% RSD for all cannabinoids). In addition, the use of commercially available products proved that the extraction procedure was suitable and adequate for both vegan and non-vegan candy. While one sample (sample 3) showed low % nominal results, in combination with a high %RSD it was possible to conclude that this sample was not a homogenous product, with variations arising as a result of the manufacturing process.
References
- Shimadzu Corporation, Application News No. HPLC-016, Potency Testing in Cannabis Extracts Using a High Sensitivity Method with the Cannabis Analyzer for Potency, February 2017