Detecting PFAS compounds in food packaging
Detecting PFAS compounds in food packaging
Better assessing the hidden threat of “forever chemicals”

Graz University of Technology, Austria

Graz University of Technology, Austria
Poly- and perfluoroalkyl substances (PFAS) – a.k.a. “forever chemicals” – are widely used in everyday applications, and there are approximately 5,000 known PFAS structures. This article presents a targeted approach for detecting and quantifying 24 PFAS commonly found in paper and board matrices. Using accelerated solvent extraction to extract PFAS, identification and quantification was done using high-performance liquid chromatography coupled with triple quadrupole mass spectrometry. Apparent recovery values were in the 84–94 % range, with method detection limit values in the 0.1–0.5 ng/g range.
Forever chemicals
Poly- and perfluoroalkyl substances – PFAS – are man-made chemicals which are widely used in a range of applications, from water-resistant clothing to food-packaging materials. Often called ”forever chemicals”, these compounds have a special chemical structure: multiple fluorine atoms attached to an alkyl chain. In addition to a fluorinated alkyl chain, compounds contain a terminal functional group, such as carboxylate, sulfonamide, phosphonate or alcohol.
Good news / Bad news
The bond between carbon (C) and fluorine (F) is one of the strongest chemical bonds known. Additionally, the size of the fluorine atom is just right to pack closely around a carbon chain and shield it from interaction with other atoms.
This is both good news and bad news. Because of their properties, PFAS repel water, fat and dirt. This makes them very useful for various applications, including non-stick cookware, stain-proof surfaces, firefighting foams, food packaging materials and various consumer products.
But because PFAS are highly resistant towards chemical and physical strains, the bad news is that they are long-lasting, bio-accumulative and unfortunately toxic. This means that once they are released into the environment, they survive without degradation and potentially contaminate the food chain for decades.
In recent years, PFAS have been increasingly detected in water, soil, air, as well as in wildlife and human beings. This has raised public awareness of the chemicals, as well as caused growing concern about their presence. For instance, in Belgium in 2021, the Flemish government issued a warning to residents to stop eating products from their own gardens because of the high levels of PFAS in their water, soil and food.
Meanwhile, residents in Ronneby in Sweden sued their drinking water provider for personal injury caused by drinking PFAS-contaminated water. And in Maine in the USA, PFAS contamination in the soil caused some farmers to lose their livelihood. PFAS have also been found in packaging products from many fast-food chains.[2]
As a result, some PFAS have recently begun to be regulated or even phased out. But so far only a few of the substances have been assessed for risk by the European Food Safety Authority (EFSA) or the Environmental Protection Agency (EPA).[3, 4] Currently, there are various regulatory initiatives that specify acceptable limits of some PFAS, however these have been imposed mainly for environmental matrices.
Assessing the threat of PFAS in food packaging
PFAS can enter the human body through various sources, but one of the major pathways is food consumption. [5] As a result, in recent years much focus has been placed on PFAS found in packaging materials which are in direct contact with food. PFAS are not naturally present in fresh paper fiber. However, they are often inserted into a layer that is added to paper and board to prevent packaging from soaking up water and fat. Additionally, they can be introduced into the final product during the recycling process.
There are several different analytical methods used for detecting and quantifying PFAS in food-packaging materials, depending on the desired type of analysis. However, the most selective and sensitive method is liquid chromatography coupled with triple quadrupole mass spectrometry – LC-MS/MS.
Recently, researchers at the Institute of Analytical Chemistry and Food Chemistry at the Graz University of Technology in Austria tested a simple method for extracting PFAS from paper and board matrices using accelerated solvent extraction (ASE), followed by quantification using LC-MS/MS. Here is a look at their work.
What did you do?
We analyzed 24 PFAS substances most commonly found in paper food-contact materials. A mixture of these, with a concentration of 2,000 ng/mL, was purchased from Wellington Laboratories (Guelph, Ontario). For each substance, we identified the precursor ion and product ion, as well as the retention time (Table 1).
|
Compound |
Acronym |
RT |
Precursor ion |
Product ion |
|
1. Perfluoro-n-butanoic acid |
PFBA |
1,14 |
212.80 |
169.10 |
|
2. Perfluoro-n-pentanoic acid |
PFPeA |
3,22 |
262.80 |
219.10 |
|
3. Potassium perfluoro-1-butanesulfonate |
L-PFBS |
3,77 |
298.90 |
79.90 |
|
4. Sodium 1H.1H.2H.2H-perfluorohexane |
4:2FTS |
4,66 |
326.90 |
306.90 80.80 |
|
5. Perfluoro-n-hexanoic acid |
PFHxA |
4,75 |
312.90 |
268.95 |
|
6. Sodium perfluoro-1-pentanesulfonate |
L-PFPeS |
4,97 |
348.90 |
80.00 98.95 |
|
7. Perfluoro-n-hepatonic acid |
PFHpA |
5,62 |
363.00 |
319.05 169.10 |
|
8. Potassium perfluoro-1-hexanesulfonate |
PFHxSK |
5,71 |
398.90 |
80.05 98.90 |
|
9. Sodium 1H.1H.2H.2H-perfluorooctane sulfonate |
6:2FTS |
6,19 |
426.90 |
407.10 80.00 |
|
10. Perfluoro-n-octanoic acid |
PFOA |
6,23 |
413.00 |
369.10 169.05 |
|
11. Sodium perfluoro-1-heptanesulfonate |
L-PFHpS |
6,27 |
449.00 |
80.00 98.85 169.15 |
|
12. Perfluoro-n-nonanoic acid |
PFNA |
6,72 |
463.00 |
419.00 217.10 |
|
13. Potassium perfluorooctanesulfonate |
PFOSK |
6,74 |
498.90 |
79.95 98.90 |
|
14. Sodium 1H.1H.2H.2H.-perfluorodecane sulfonate |
8:2FTS |
7,12 |
526.90 |
506.90 81.05 |
|
15. Perfluoro-n-decanoic acid |
PFDA |
7,14 |
513.10 |
469.05 |
|
16. Sodium perfluoro-1-nonanesulfonate |
L-PFNS |
7,14 |
548.90 |
80.00 98.90 |
|
17. N-Methyl-Perfluorooctanesulfonamido acetic acid |
N-MeFOSAA |
7,31 |
570.00 |
419.10 512.00 219.10 |
|
18. N-Ethyl-Perfuoroctanesulfonamido acetic acid |
N-EtFOSAA |
7,49 |
584.00 |
419.05 526.00 482.95 |
|
19. Perfluoro-1-octanesulfonamide |
FOSA |
7,48 |
498.00 |
78.00 |
|
20. Perfluoro-n-undecanoic acid |
PDUdA |
7,50 |
562.80 |
518.90 269.00 |
|
21. Sodium perfluoro-1-decanesulfonate |
L-PFDS |
7,51 |
598.90 |
80.00 99.00 |
|
22. Perfluoro-n-dodecanoic acid |
PFDoA |
7,81 |
612.90 |
568.75 |
|
23. Perfluoro-n-tridecanoic acid |
PFTrDA |
8,08 |
662.90 |
618.95 |
|
24. Perfluoro-n-tetradecanoic acid |
PFTeDA |
8,32 |
713.00 |
669.00 168.85 268.95 |
Two series of calibration solutions were prepared by dilution with 50:50 % (v/v) methanol:water. For high-concentration calibration, we prepared a series of 9 calibration solutions at concentrations of 100, 50, 25, 20, 15, 10, 5, 2.5 and 1.25 pg/µL. For low-concentration calibration, 10 calibration solutions at concentrations of 20, 10, 5, 2.5, 1, 0.5, 0.25, 0.1, 0.05 and 0.01 pg/µL were prepared.
How was the sample prepared?
As a sample we used unprinted recycled paper (70 g/m²), which had previously been analyzed for the presence of PFAS. The paper was cut into small pieces, and 2 grams were used for experiments. The paper was spiked with a PFAS mixture with different concentrations of our standard solution – 100, 50, 20, 10, 5, 2.5, 1, 0.5 and 0.1 ng/g.
After drying, the samples were extracted with methanol using accelerated solvent extraction (ASE). The collected extracts were placed in a nitrogen evaporator and evaporated to dryness under a gentle stream of nitrogen, and then reconstituted in methanol:water (50:50) % (v/v). Finally, the solutions were filtered using 0.22 µm regenerated cellulose filters and transferred into polypropylene vials for LC-MS/MS measurement.
What were the analytical conditions, and what kind of equipment did you use?
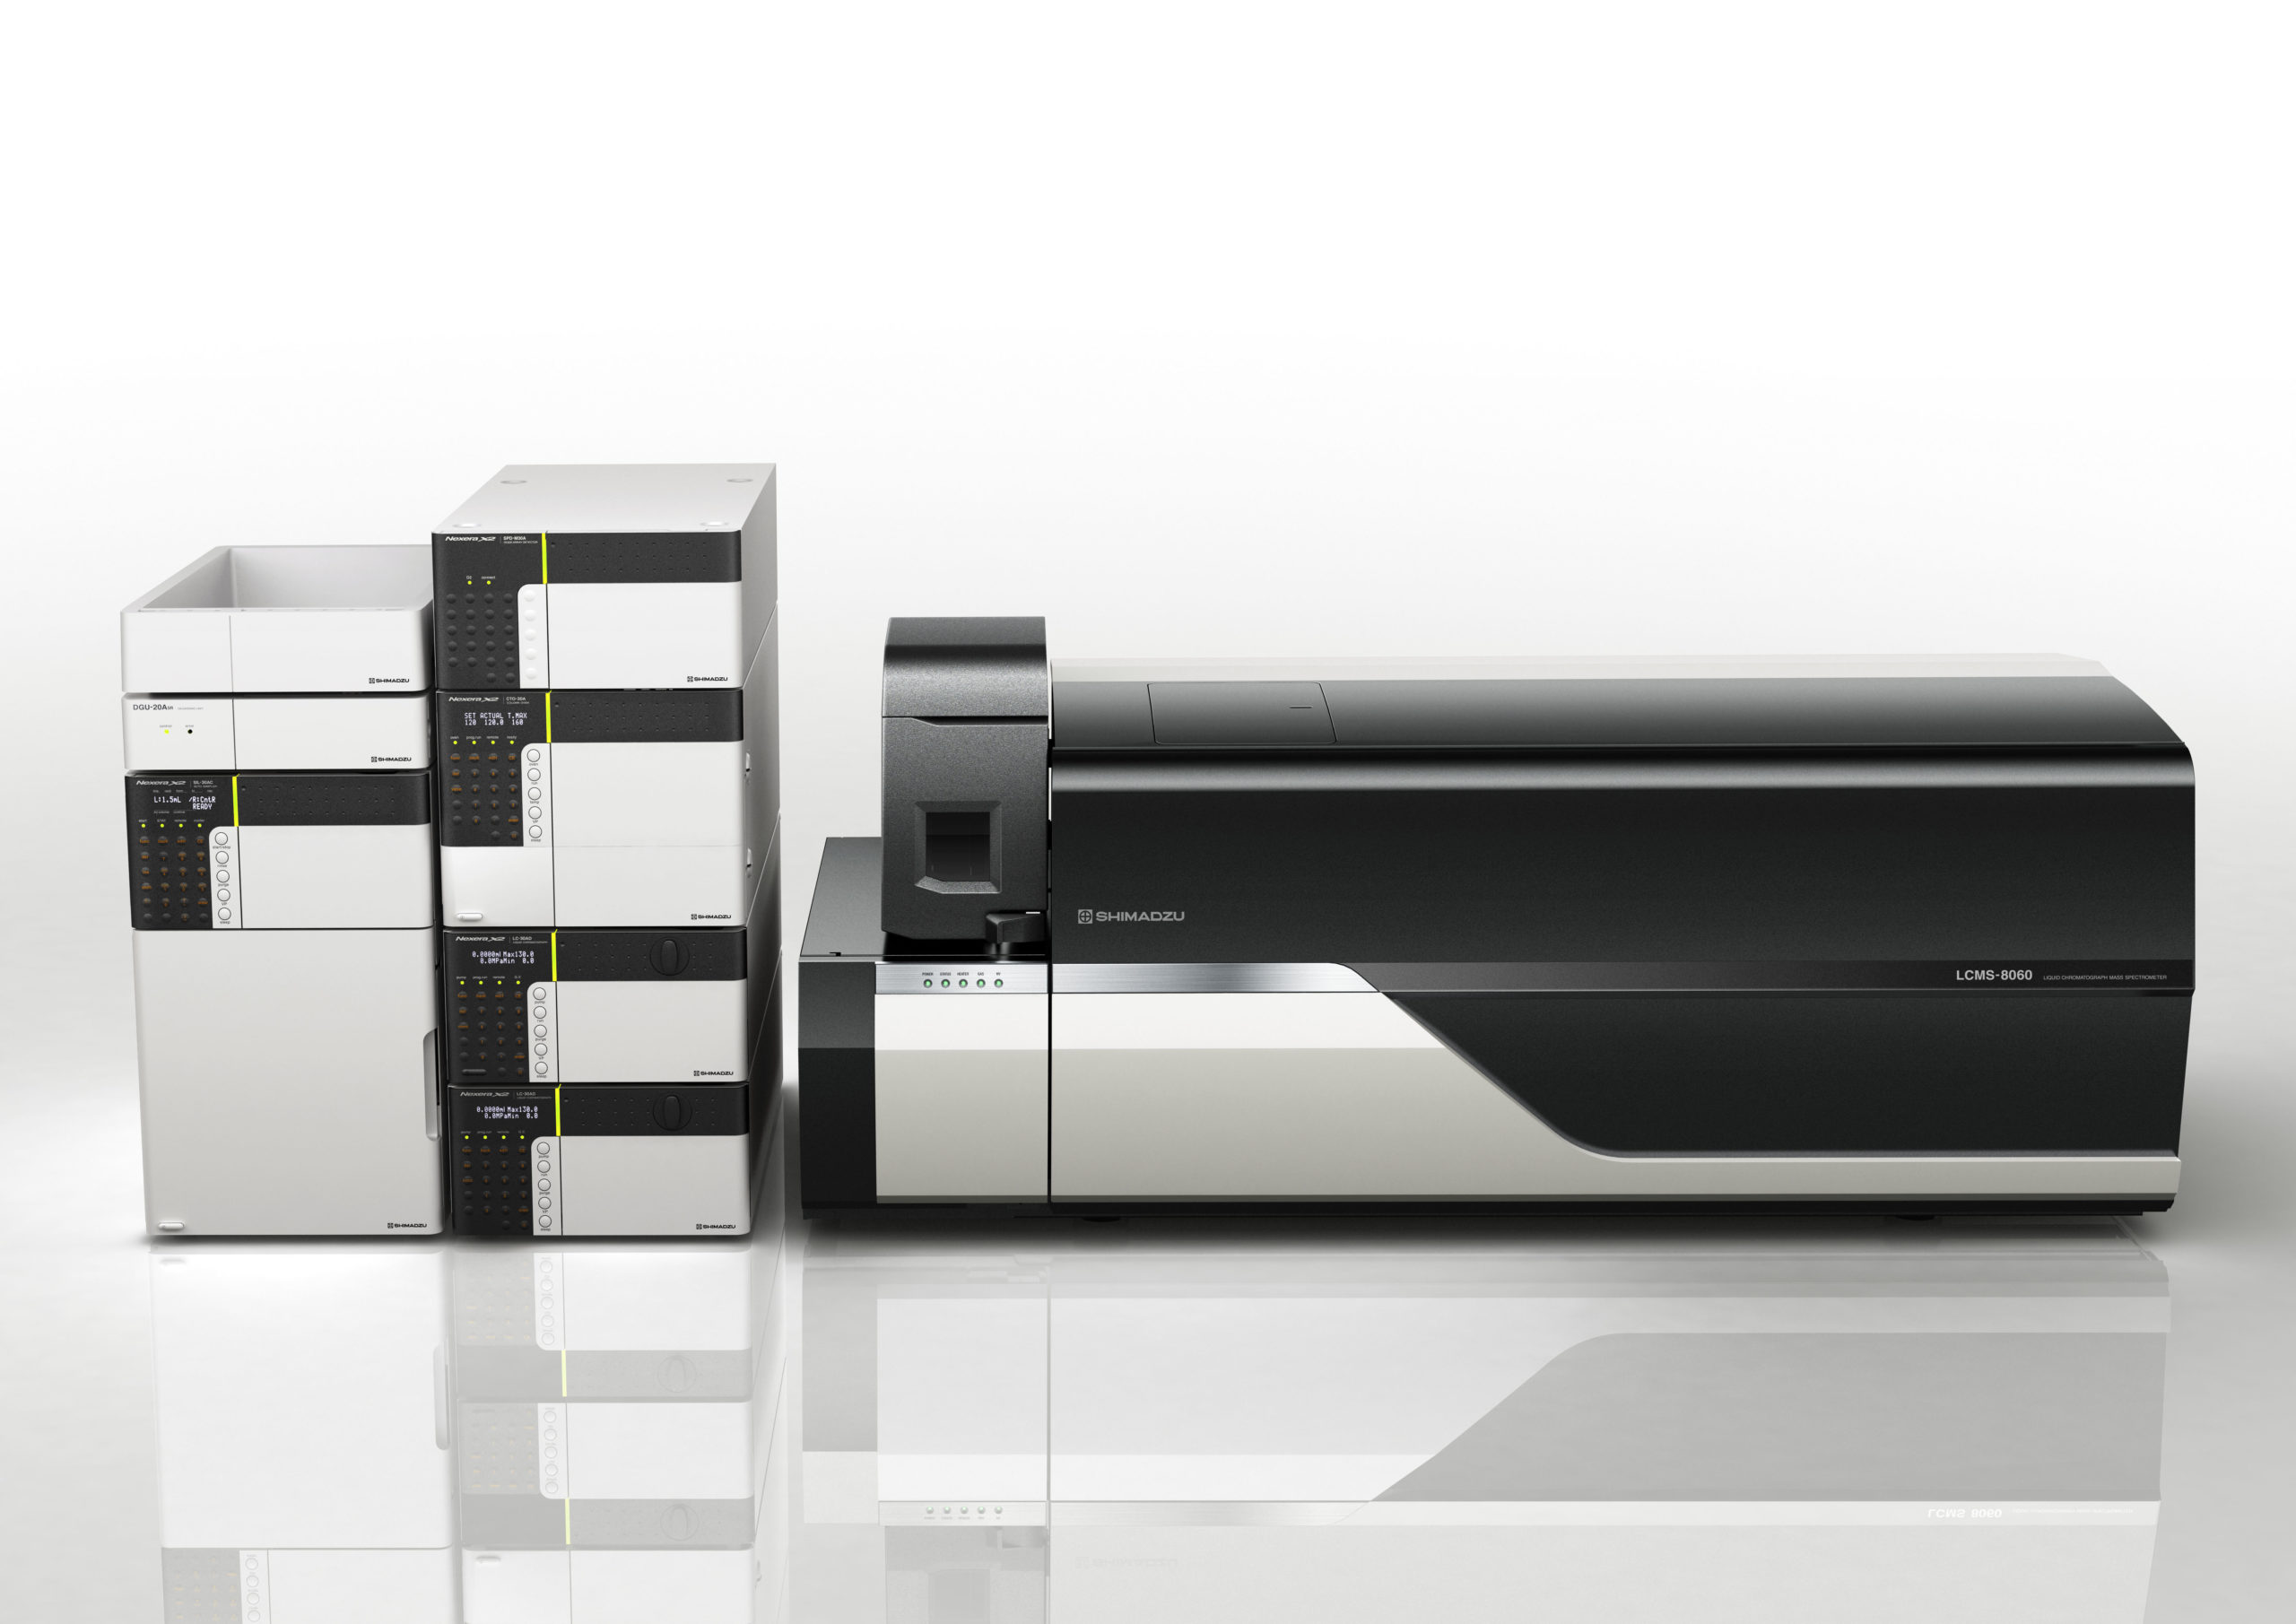
We used an extraction method in combination with a chromatographic separation process and mass-selective detection. Specifically, the PFAS analysis was carried out by injecting 5 µL of the prepared solutions into a Shimadzu LCMS-8050 system with the parameters detailed in Table 2 and Table 3. The analytes were chromatographically separated using a Restek Raptor C18 column. To separate PFAS which could potentially leach out from the instrument upstream of the injector, we used a Restek Delay column installed between the mixer and autoinjector.
|
LC System and Parameters |
||
|
LC System |
Shimadzu LCMS-8050 |
|
|
Analytical Column |
Restek Raptor C18 2.7µm 50 x 2.1 mm |
|
|
Delay Column |
Restek PFAS Delay Column 5 µm x 50 mm x 2.1 mm |
|
|
Column temperature |
40˚C |
|
|
Injection |
5 µl |
|
|
Mobile phase |
A: 5 mM ammonium acetate B: MeOH |
|
|
Flow rate |
0.4 ml/min |
|
|
Run time |
10 min |
|
|
Gradient |
Time (min) 0 8 8.01 10 |
%B 20 95 20 20 |
|
MS Acquisition Parameters |
|
|
MS Instrument |
Shimadzu LCMS-8050 |
|
Interface |
ESI |
|
Interface Temperature |
300˚C |
|
Desolvation Line Temperature |
100˚C |
|
Heat Block Temperature |
200˚C |
|
Heating Gas Flow |
10 l/min |
|
Drying Gas Flow |
10 l/min |
|
Nebulizing Gas Flow |
2 l/min |
|
Interface Voltage |
-0.5 kV |
What were your results?
Calibration curve linearity
The calibration solutions were analyzed at five injections for each concentration. Both at high-range and low-range concentration solutions, the regression coefficient (R2) was above 0.99 for most analytes. However, the standard deviation between the five measurements at low-range concentrations was for some analytes – especially higher PFAS – somewhat higher (Table 4).
Extraction – linearity and recovery
All the samples were measured five times, and linearity was determined from five measurements for each analyte. Recovery of the analyte was calculated using the calibration curves from previous experiments (Table 5). Even after extraction the regression coefficient was above 0.99 for the majority of analytes, except for higher PFAS. It is evident that PFAS with 10 carbon-atom chains have lower linearity, which is decreasing with the length of the carbon chain. The average recovery between all the analytes is 88.8 %, which is within the required criteria (80–120 % of the true value) set by the EU Reference Laboratory for Halogenated POPs.[6]
|
high range linearity |
low range linearity |
||||
|
Compound |
R2 |
RSD % |
R2 |
RSD % |
|
|
PFBA |
0.9984 |
0.94 |
0.9921 |
1.39 |
|
|
PFPeA |
0.9982 |
1.96 |
0.9921 |
2.00 |
|
|
L-PFBS |
0.9990 |
1.15 |
0.9857 |
2.70 |
|
|
4:2FTS |
0.9950 |
1.09 |
0.9916 |
3.89 |
|
|
PFHxA |
0.9966 |
1.09 |
0.9931 |
4.71 |
|
|
L-PFPeS |
0.9991 |
0.98 |
0.9860 |
5.26 |
|
|
PFHpA |
0.9956 |
1.00 |
0.9940 |
2.93 |
|
|
PFHxSK |
0.9991 |
1.03 |
0.9821 |
5.43 |
|
|
6:2FTS |
0.9944 |
1.19 |
0.9956 |
3.30 |
|
|
PFOA |
0.9883 |
1.00 |
0.9961 |
2.05 |
|
|
L-PFHpS |
0.9988 |
1.33 |
0.9850 |
3.75 |
|
|
PFNA |
0.9857 |
0.91 |
0.9970 |
2.24 |
|
|
PFOSK |
0.9991 |
1.04 |
0.9861 |
6.20 |
|
|
8:2FTS |
0.9767 |
1.78 |
0,9980 |
5.10 |
|
|
PFDA |
0.9749 |
1.03 |
0.9870 |
3.95 |
|
|
L-PFNS |
0.9988 |
3.35 |
0.9974 |
3.37 |
|
|
N-MeFOSAA |
0.9993 |
2.31 |
0.9852 |
10.21 |
|
|
N-EtFOSAA |
0.9904 |
3.06 |
0.9840 |
2.90 |
|
|
FOSA |
0.9992 |
0.84 |
0.9945 |
4.95 |
|
|
PFUdA |
0.9782 |
1.78 |
0.9976 |
5.09 |
|
|
L-PFDS |
0.9984 |
1.73 |
0.9870 |
3.40 |
|
|
PFDoA |
0.9972 |
1.82 |
0.9891 |
5.54 |
|
|
PFTrDA |
0.9981 |
4.78 |
0.9833 |
9.52 |
|
|
Compound |
Linerarity (R2) |
Recovery (%) |
|
PFPeA |
0.9933 |
84.64 |
|
L-PFBS |
0.9933 |
91.47 |
|
4-2FTS |
0.9877 |
89.22 |
|
PFHxA |
0.9933 |
89.37 |
|
L-PFPeS |
0.9932 |
89.39 |
|
PFHpA |
0.9932 |
86.37 |
|
PFHxSK |
0.9934 |
90.37 |
|
6:2FTS |
0.9880 |
85.31 |
|
PFOA |
0.9929 |
87.86 |
|
L-PFHpS |
0.9929 |
89.74 |
|
PFOSK |
0.9922 |
90.49 |
|
8:2FTS |
0.9828 |
85.39 |
|
PFDA |
0.9898 |
89.02 |
|
L-PFNS |
0.9901 |
88.99 |
|
N-MeFOSAA |
0.9900 |
86.75 |
|
N-EtFOSAA |
0.9818 |
88.99 |
|
FOSA |
0.9889 |
93.24 |
|
PFUdA |
0.9853 |
89.46 |
|
L-PFDS |
0.9868 |
90.52 |
|
PFDoA |
0.9710 |
89.43 |
|
PFTrDA |
0.9050 |
90.41 |
|
PFTeDA |
0.6665 |
89.67 |
Accurately recording contamination
From the personal safety of the individual to the overall security of our planet, the ability to accurately measure contaminants is of vital importance. Only then can the risks be properly assessed and actions taken to reduce them. Despite their many benefits, PFAS currently pose a risk worth measuring.
The researchers in Graz succeeded in developing a method to specifically identify and precisely quantify PFAS in food packaging. They also concluded that the award-winning Shimadzu LCMS-8050 reliably measures PFAS concentration ranges up to 0.01 pg/µL, and that its combination of high sensitivity with outstanding speed parameters makes it well-suited for high-throughput multi-component analysis. This means that the LCMS-8050 can be beneficially used as an integral part of a simple and efficient method for the monitoring and quantification of PFAS in paper-based food-packaging materials.
References
- D. X. Trier, C. Taxvig, A. K. Rosenmai et al., PFAS in Paper and Board for Food Contact: Options for Risk Management of Poly- and Perfluorinated Substances, Nordic Council of Ministers, Copenhagen K, 2018.
- “Revealed: the dangerous chemicals in your food wrappers,” The Guardian, 24.3.2022.
- US EPA, “PFAS Laws and Regulations | US EPA,” 7/12/2021, https://www.epa.gov/newsreleases/epa-identifies-drinking-water-contaminants-potential-regulation.
- “Order on food contact materials and on provisions for penalties for breaches of related EU legislation,” European Commission.
- R. B. Jain, “Contribution of diet and other factors to the levels of selected polyfluorinated compounds: data from NHANES 2003-2008,” International journal of hygiene and environmental health, vol. 217, no. 1, pp. 52–61, 2014.
- European Union Reference Laboratory for halogenated POPs in Feed and Food, “Guidance Document on Analytical Parameters for the Determination of Per- and Polyfluoroalkyl Substances (PFAS) in Food and Feed,” Union Reference Laboratory for halogenated POPs in Feed and Food.