
Food fat analysis:
quickly and cleanly
Spread and measure: time-saving analysis of spreadable fats using molecular spectroscopy

Real butter, clarified butter, and margarine are all indispensable to fine cuisine. The EU strictly regulates what can be included in each type of spreadable fat. In food analysis, molecular spectroscopy can be used to quickly determine whether the food contains what it should according to the regulations – and without prior chemical analysis preparation.
Golden yellow, with a delicate flavor, and therefore used frequently: butter, clarified butter, and margarine. But what are the differences between the fats?
Fat is not just fat
Each type of spreadable fat has a different ratio of fat to water. According to EU legislation, butter must have a milk fat content of at least 80% and no more than 90%. It must also contain no more than 16% water. Butter mostly consists of saturated fatty acids, is rather hard when chilled, and only becomes spreadable through the addition of oils.
Clarified butter, on the other hand, is butter that is heated slowly to remove almost all the water, milk protein, and lactose. As a result, it has a fat content of 99.8% and is thus ideal for heating. The healthy aspect is meant to be a high vitamin A content, but this needs to be verified.
Finally, margarine is an emulsion of vegetable and/or animal fats and water or skimmed milk. It has a fat content of between 39% and 90%, so it normally contains a lot less fat. Margarine is also considered healthy because it is rich in vitamins such as A, D, and E. But these are added during the production process.
Well-being at a glance
The debate over which of these fat products is the healthiest or highest quality is a perennial one. In the past, margarine was considered a “cheap substitute” for “real butter“, but today it is well-established among the ranks of spreads, and even considered healthier than its animal-fat-based competitors.
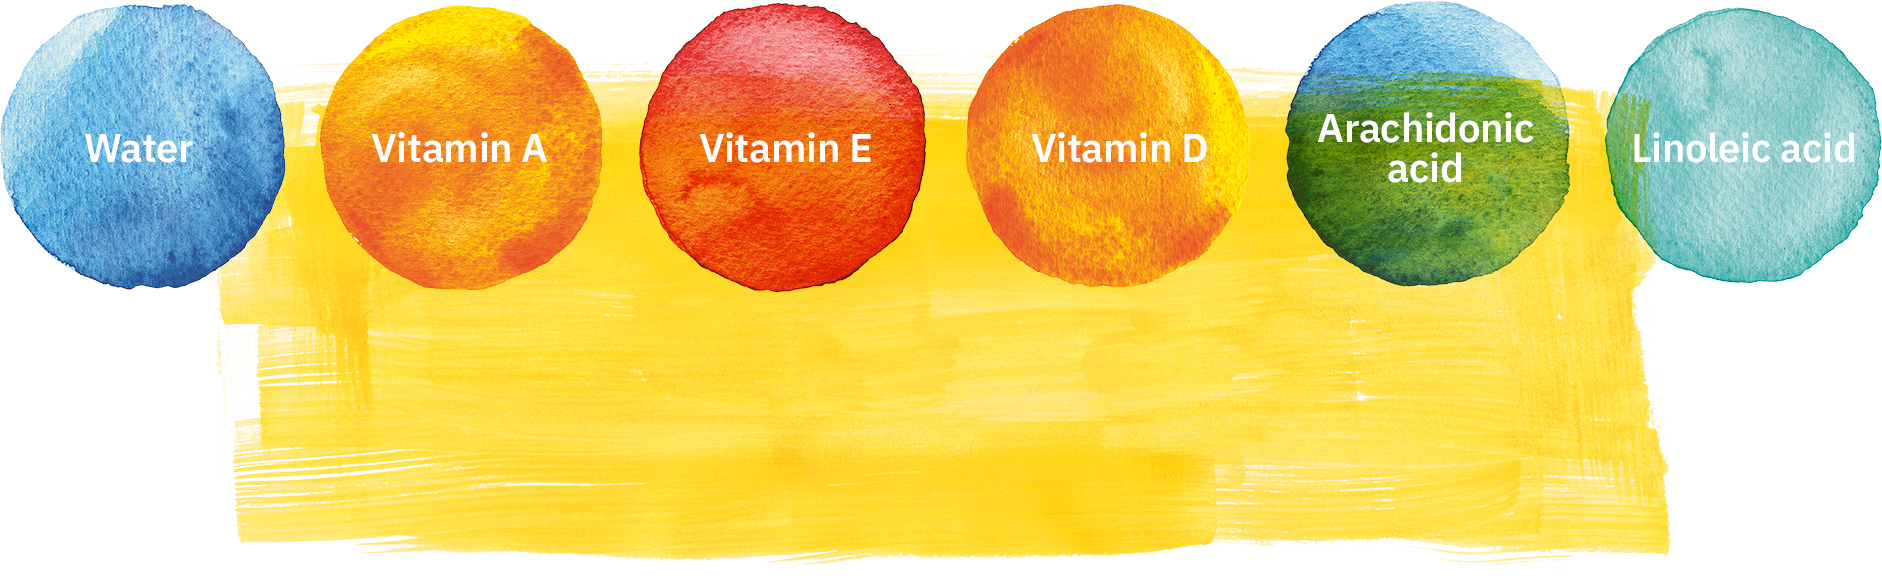
In order to verify the information on the packaging, as well as the safety and the nutritional benefits of the fats used, the analysis of spreadable fats and oils using infrared spectroscopy is a common method in food inspections. Manufacturers of spreadable fats and oils want to know the precise composition of saturated and unsaturated fatty acids in their products because high blood-cholesterol levels are responsible for heart disease and other conditions. The nutritional physiology represented by the cis/trans value of the unsaturated fatty acids is also of interest. Indeed, some unsaturated fatty acids are essential for life, such as linoleic acid and arachidonic acid.
Any chemical analysis should (in theory) include a qualitative and quantitative determination of each fatty acid/each fatty acid ester, but this type of analysis is very complex and time-consuming. Therefore, the industry uses analysis figures (fat parameters) to characterize and identify fats. These include the acid value, saponification value, ester value, and iodine value. The cis and trans-fatty acids can be very accurately determined using infrared spectroscopy. For the purpose of analysis, the signal 3010 cm-1 is selected for unsaturated cis fatty acids and that of 966 cm-1 for unsaturated trans-substituted fatty acids. The water spectrum is in the area of 3350 cm-1 in a broad band.
Quick quality control
Using infrared spectroscopy, it is possible to determine to subject fats to a quick quality control and to determine their water content without having to prepare the fat for the analysis.
In the test, five commercially available fats from the supermarket were examined and the results were compared with the information on the packaging. Infrared spectroscopy analysis was used to demonstrate the differences in water content. Subsequently, fluorescence spectroscopy was used to verify the presence of vitamin A. The fats were measured at room temperature in a solid state.
These spreadable or frying fats differ fundamentally. Some are animal fats while others are vegetable fats, with the animal fats containing less water than the vegetable fats. Since animal fats contain more fatty acids, fat-soluble vitamins can also be expected, which are only present in trace amounts but generally at higher concentrations than in vegetable fats. However, vitamins can also be added to margarines during production.
Since the focus of the analysis was on the speed and ease with which information about the composition could be obtained, the objective for both techniques was to carry out the analysis with simple sample preparation and without chemical pretreatment of the fats. If trace amounts of ingredients are to be determined, other analytical methods and techniques are worth considering, such as chromatography, or – if they are element-specific ingredients – the analysis techniques EDX, AAS, and ICP. [1], [2], [3]
Simple application, quick cleaning: sample preparation and analysis
The sample preparation is simple for both measuring techniques: For Fourier transform infrared spectroscopy (FTIR), the fat is applied bubble-free to the measurement window using a spatula. For the fluorescence spectroscopy, the so-called “front-face” analysis is used. For this, a sample holder of the solid sample holder is filled with the fat up to the rim and covered with a quartz plate so that the quartz is in contact with the fat. This is placed in the solid sample holder in the sample compartment.
For the infrared spectroscopy, a Shimadzu IRSpirit-T FTIR laboratory instrument fitted with a diamond-based ATR accessory was used for a measurement in single-reflection ATR. The diamond is robust and easy to maintain. The measurement window – only 2 mm in size – is wiped with paper until it is subjectively free from fat and is then cleaned again with a fat-dissolving cleaner until it is completely free of any fat. In total, the cleaning takes less than one minute and the accessory is then ready to be used for the next sample.
The Shimadzu RF-6000 fluorescence spectrometer was used for the fluorescence spectroscopy to detect naturally occurring or added vitamins. For example, vitamin A, which is dissolved in the fat, can be measured and determined using fluorescence without chemical pretreatments. Paper is used for cleaning in this case as well, and the sample container and quartz plate are wiped until they are clearly fat-free, and then everything is cleaned again with a fat-dissolving agent. The entire cleaning takes less than five minutes.
|
Various cooking fats and spreads |
|
|
Type |
Description |
|
Ghee/butter fat from cowʼs milk |
Clarified butter with a fat content of 99.8 g per 100 g. |
|
Butter |
Butter from cow‘s milk with a fat content of 82.5 g on 100 g, water content ~17.5 g |
|
Butter plus |
Butter from cowʼs milk plus rapeseed oil, a mixture of 63 % butter and 13 % rapeseed oil, with a fat content of 65 g per 100 g, |
|
Margarine |
Soft margarine with a fat content of 60 g per 100 g and 800 μg vitamin A, water content ~40 g |
|
Margarine |
Baking and cooking margarine with fat content of 70 g per 100 g, water content ~30 g |
A first look – infrared spectroscopy results
The mid-infrared spectra show a strong signal at 966 cm-1 for the low water content fat spectra. This is a clear indication of trans-substituted fatty acids – double bonds – which are responsible for the softness or spreading quality of the fat. Hence, lots of trans-fatty acids are found in oils, but proportionally less in butter and margarine. These so-called “good” fats are added to the latter synthetically. One of the types of butter selected for the analysis is mixed with a rapeseed oil to increase the proportion of trans-fatty acids.
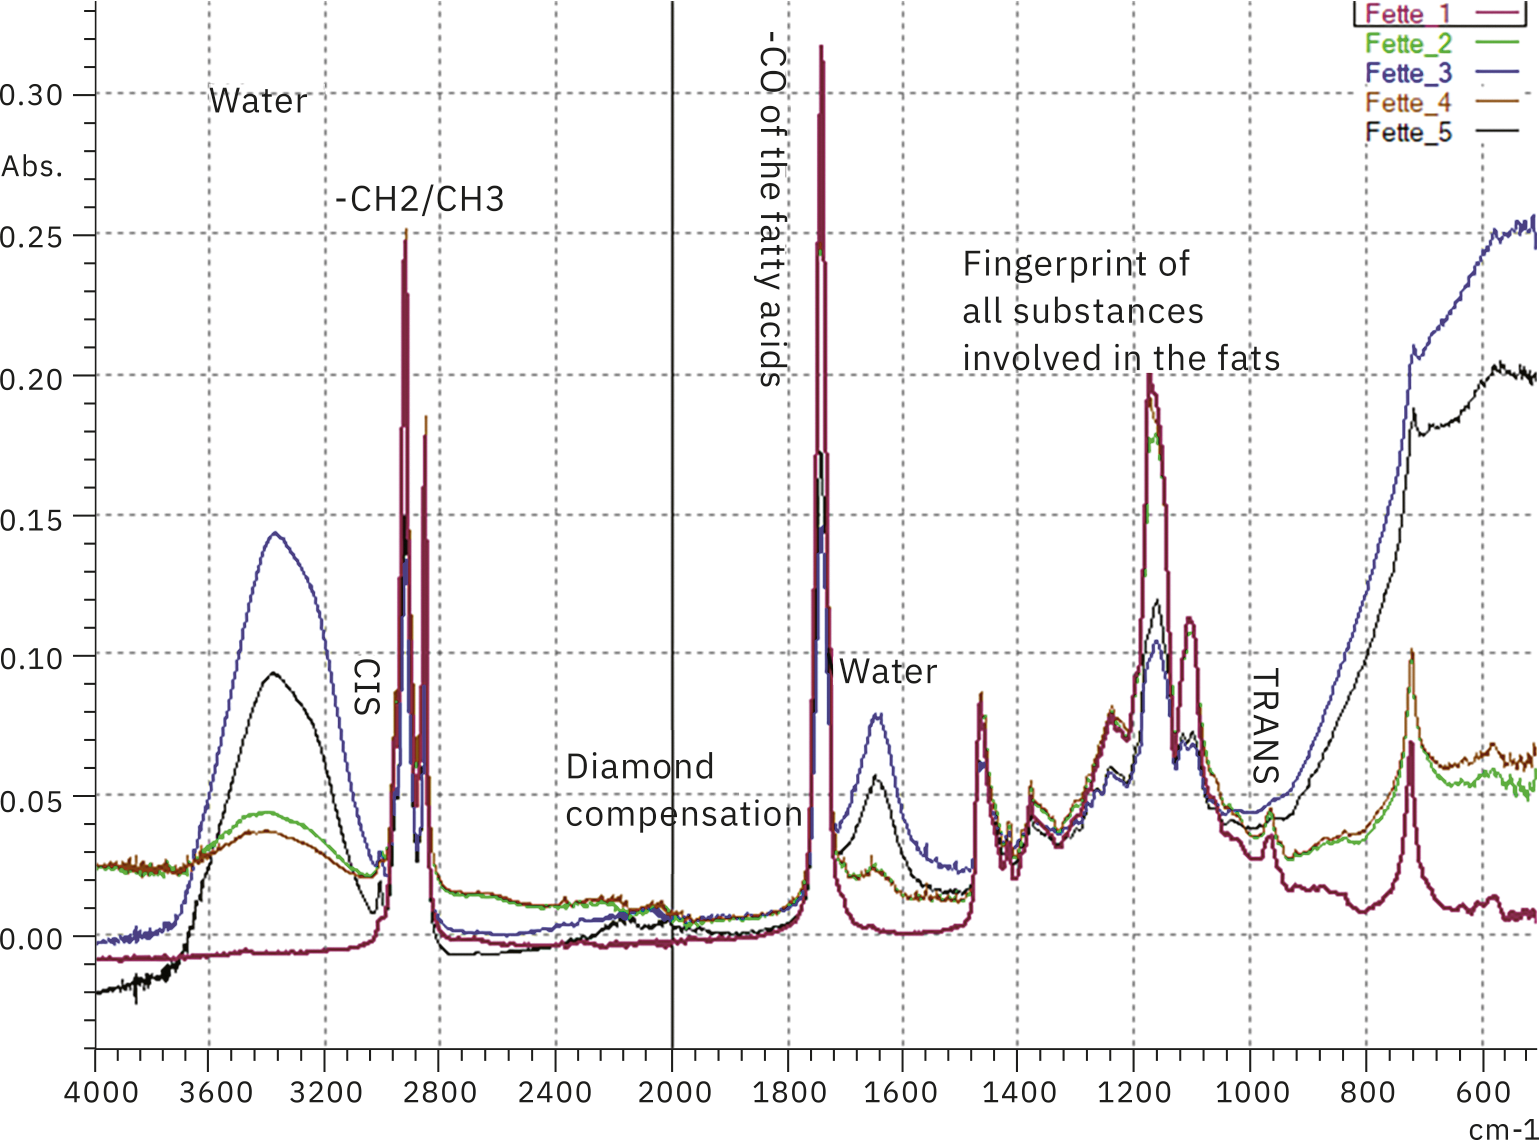
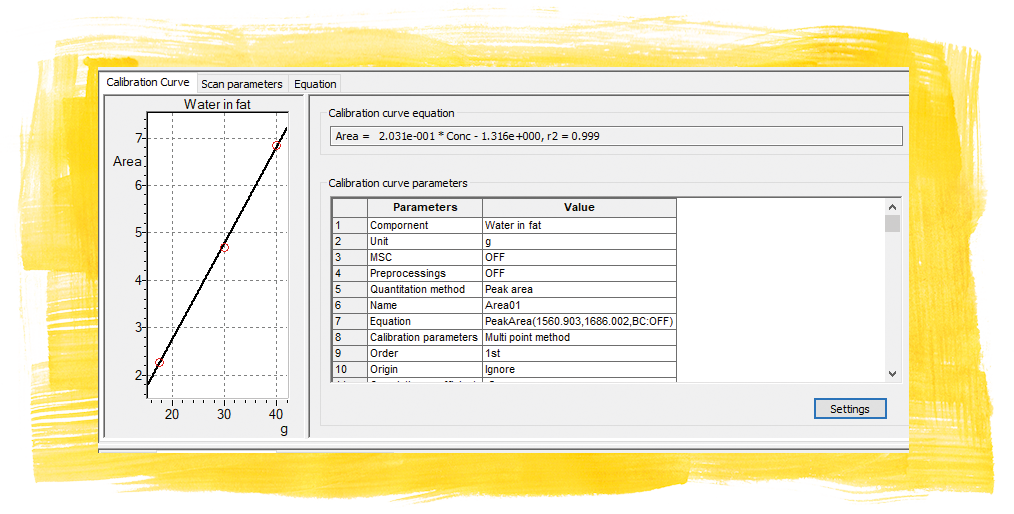
The analysis range can be expanded to include additional ingredients. This is helpful if there are a large number of products. The water content is easy to determine and is clearly shown in the spectra of the five examined samples (Figure 2). The values stated on the packaging were used to calibrate the water signal. The created calibration could be used for the water-content determination of other industrially produced spreadable fats.
|
Band position |
Assignment |
Assignment method |
Assignment fats and intensity |
|
3720-3040 |
Water of crystallization, wide range |
Butter low, margarine high |
|
|
3010 |
Cis-oriented double bond of fatty acids |
CIS-Trans |
Butter, margarine |
|
2980-2820 |
Region of CH2/CH3 vibrations |
All spectra |
|
|
2400-1900 |
Effect due to diamond compensation |
All spectra |
|
|
1700-1750 |
CO of the fatty acid |
OH number/IOD number/saponification |
Butter, butter high, margarine lower |
|
1650 |
Water signals |
Water |
Margarine high, butter lower |
|
1500-1000 |
Fingerprint solid acids and offset water |
All spectra |
|
|
966 |
Trans-oriented double bond of the fatty acid |
CIS-Trans |
Butter, clarified butter, margarine low and not exactly determinable (water superimposed) |
|
900 – 400 |
Offset water |
Margarine intensive |
|
|
722cm-1 |
Deformation CH2 rocking sharp signal |
Clarified butter, butter margarine low and not exactly determinable (water superimposed) |
For the clarified butter, the content was declared to be 99.8 g fat and 0 g water. This was confirmed by the infrared spectrum. The fat spectrum did not contain any water bands. All the other fats (margarine and butter) with water bands were included in the calibration and the water bands were quantified (at 1650 cm-1 assuming that the water content fills up the 100 g and disregarding any ingredients in trace amounts). Due to the width of the water band, an area calculation was selected to be more accurate about the mean of the signal.
With good concordance of the water contents, the blended fat “butter plus oil” was used as the unknown factor in order to check the calibration. This found a water content of 17.8 g. This correlates approximately to the rapeseed oil-free butter (17.5 g) of the same brand.
A second look – fluorescence spectroscopy results
The same fats were measured using fluorescence spectroscopy with the implementation of an EEM matrix. For the analysis, the excitation wavelength was gradually increased against the emission spectrum. When presented as a graph, the wavelengths of the emission spectra (x axis) were plotted against the excitation wavelengths (y axis). These area diagrams feature fluorescence-active areas. Areas, intensity clouds, or hot spots arise due to individual substances or families (such as vitamins) to be classified. In this example, they are retinol (vitamin A, region A), tocopherol (vitamin E, region E), and UV-active ingredients as a matrix (region M).
The EEM matrix of the clarified butter clearly showed a vitamin A-induced spectrum, whereas the butter and margarine demonstrated other emission areas. These can be assigned to the remaining ingredients of butter and margarine, such as vitamins, proteins, and water.
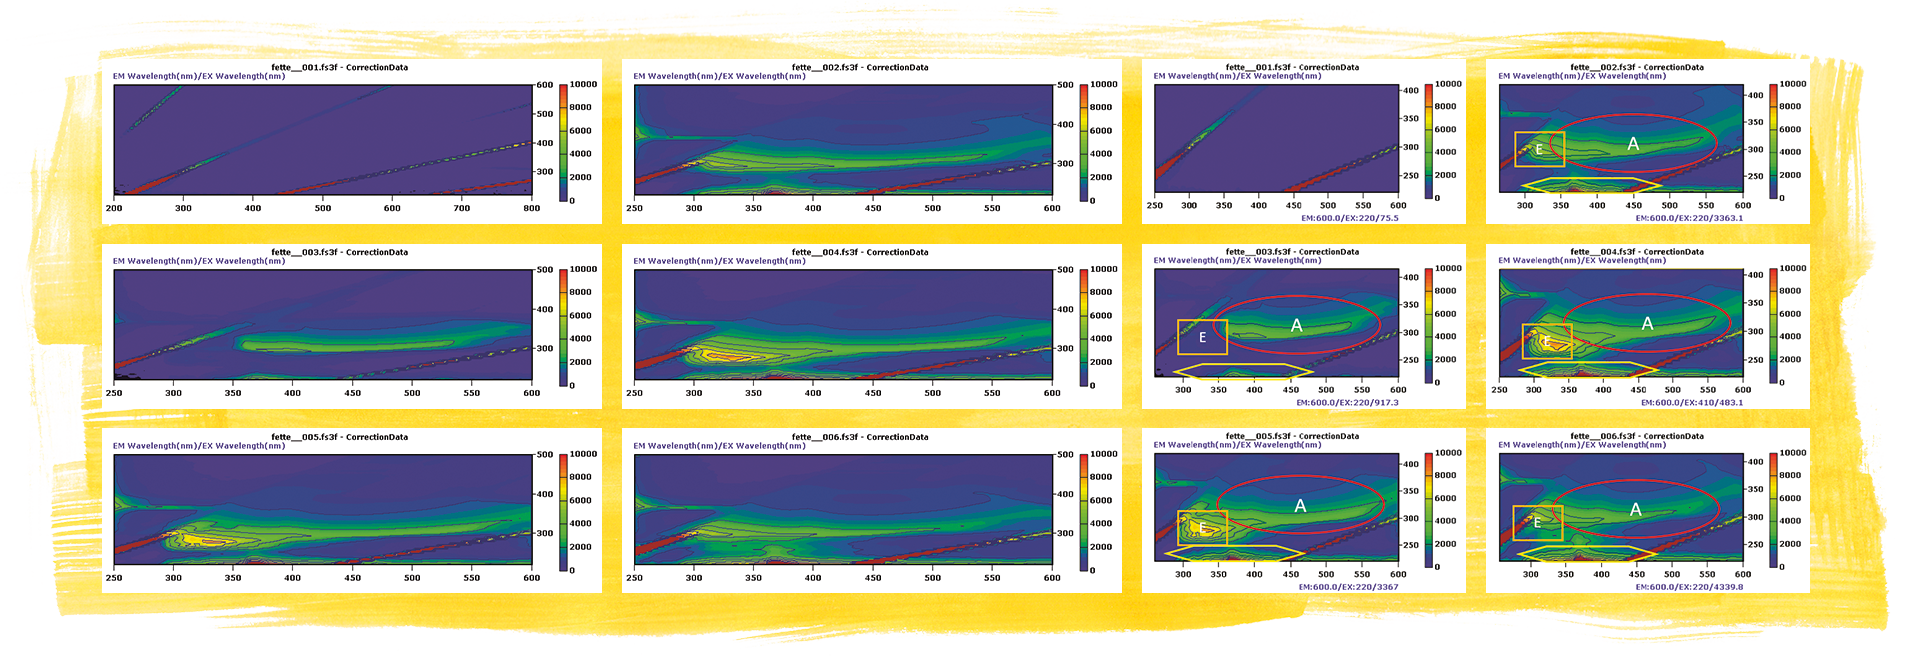
Soft margarine (fat 3, top right), clarified butter (fat 1, middle left), butter and oil mix (center right), butter (fat 4, bottom left), margarine for baking (fat 5, bottom right).
The clarified butter shows a region that can be assigned to vitamin A and demonstrates little intense activity in the area of the UV matrix. All the other EEM matrices also show another intense entry in the E region, which partly overlaps the vitamin A region. In the literature, it is discussed whether this fluorescence of proteins and carbohydrates is caused in connection with residual water or whether other vitamins are being excited. The best candidate for this would be vitamin E. Vitamin E (EX 285 EM 330) is also added to some fats. Vitamin E (tocopherol) is the main vitamin in rapeseed oil and other natural fats, which would match the intense spot of the butter with rapeseed oil, whereas the “pure” butter shows somewhat less fluorescence at this point. The margarines do not have an intense hot spot at this position. [4], [5]
|
Vitamin |
Fat |
average amount/100g |
theor. fluorescence |
Measured fluorescence |
|
A |
Butter |
653µg |
EX:322/EM:340 540nm[3] |
Superimposed 340-350nm |
|
Rapeseed oil* |
550µg |
|||
|
Butter with rapeseed oil |
Superimposed 340-350nm |
|||
|
Margarine 1 |
608µg |
|||
|
Margarine 2 |
Not declared |
|||
|
Clarified butter |
883µg |
EX:322/EM:340 540nm |
||
|
E |
Butter |
2000µg |
EX:285/EM:330[4] |
280-325 |
|
Rapeseed oil* |
18880µg |
|||
|
Butter with rapeseed oil |
280-325 |
|||
|
Margarine 1 |
Not declared |
Not intense |
||
|
Margarine 2 |
Not declared |
Not intense |
||
|
Clarified butter |
Not declared for the investigated brand, in the literature 3200µg are indicated |
– |
||
|
Matrix |
All |
UV active |
More and less intense. |
EX250/EM 300-450nm |
Time is money
The test confirms that the fat spectra can be easily and quickly identified, the content of saturated and unsaturated fatty acids (cis/trans) verified, and the water content determined by using ATR infrared spectroscopy. Robust quantifications should be established for a product-specific calibration because the natural fats do not abide by theoretical calibrations with correlation coefficients with the value 1. They vary, hence the robust models (correlation value: 0.9x).
Fluorescence spectroscopy demonstrates another perspective on food. Chemically untreated, solid fats can be classified. A fat can easily be measured in comparison with a reference material, and thus quality control can be carried out in relation to vitamins.
For both systems, only a short length of time is required for the measurement, compared to the time needed to clean the measurement accessories. For both device systems together, an analysis can take less than ten minutes.
References
- Butter Ordinance, ButtV dated 1997
- Shimadzu C180E059C Food Analysis Guidebook, 2014
- Shimadzu SCA 110 017, Iodine number determination using FTIR–ATR spectroscopy
- Per A. Peterson and Lars Rask, Studies on Human Vitamin A-transporting Plasma Protein Complex and Its Individual Components, The Journal of Biological Chemistry, Vol. 240, No. 24, Issue of December 25, pp. 7544–7550, 1971
- Etsuo Niki and Kouichi Abe, CHAPTER 1: Vitamin E: Structure, Properties and Functions, in Vitamin E: Chemistry and Nutritional Benefits, 2019, pp. 1–11, DOI: 10.1039/9781788016216-00001
eISBN: 978-1-78801-621-6