The “High Absorbance” method for qualification of an interference filter
UV-VIS spectroscopy
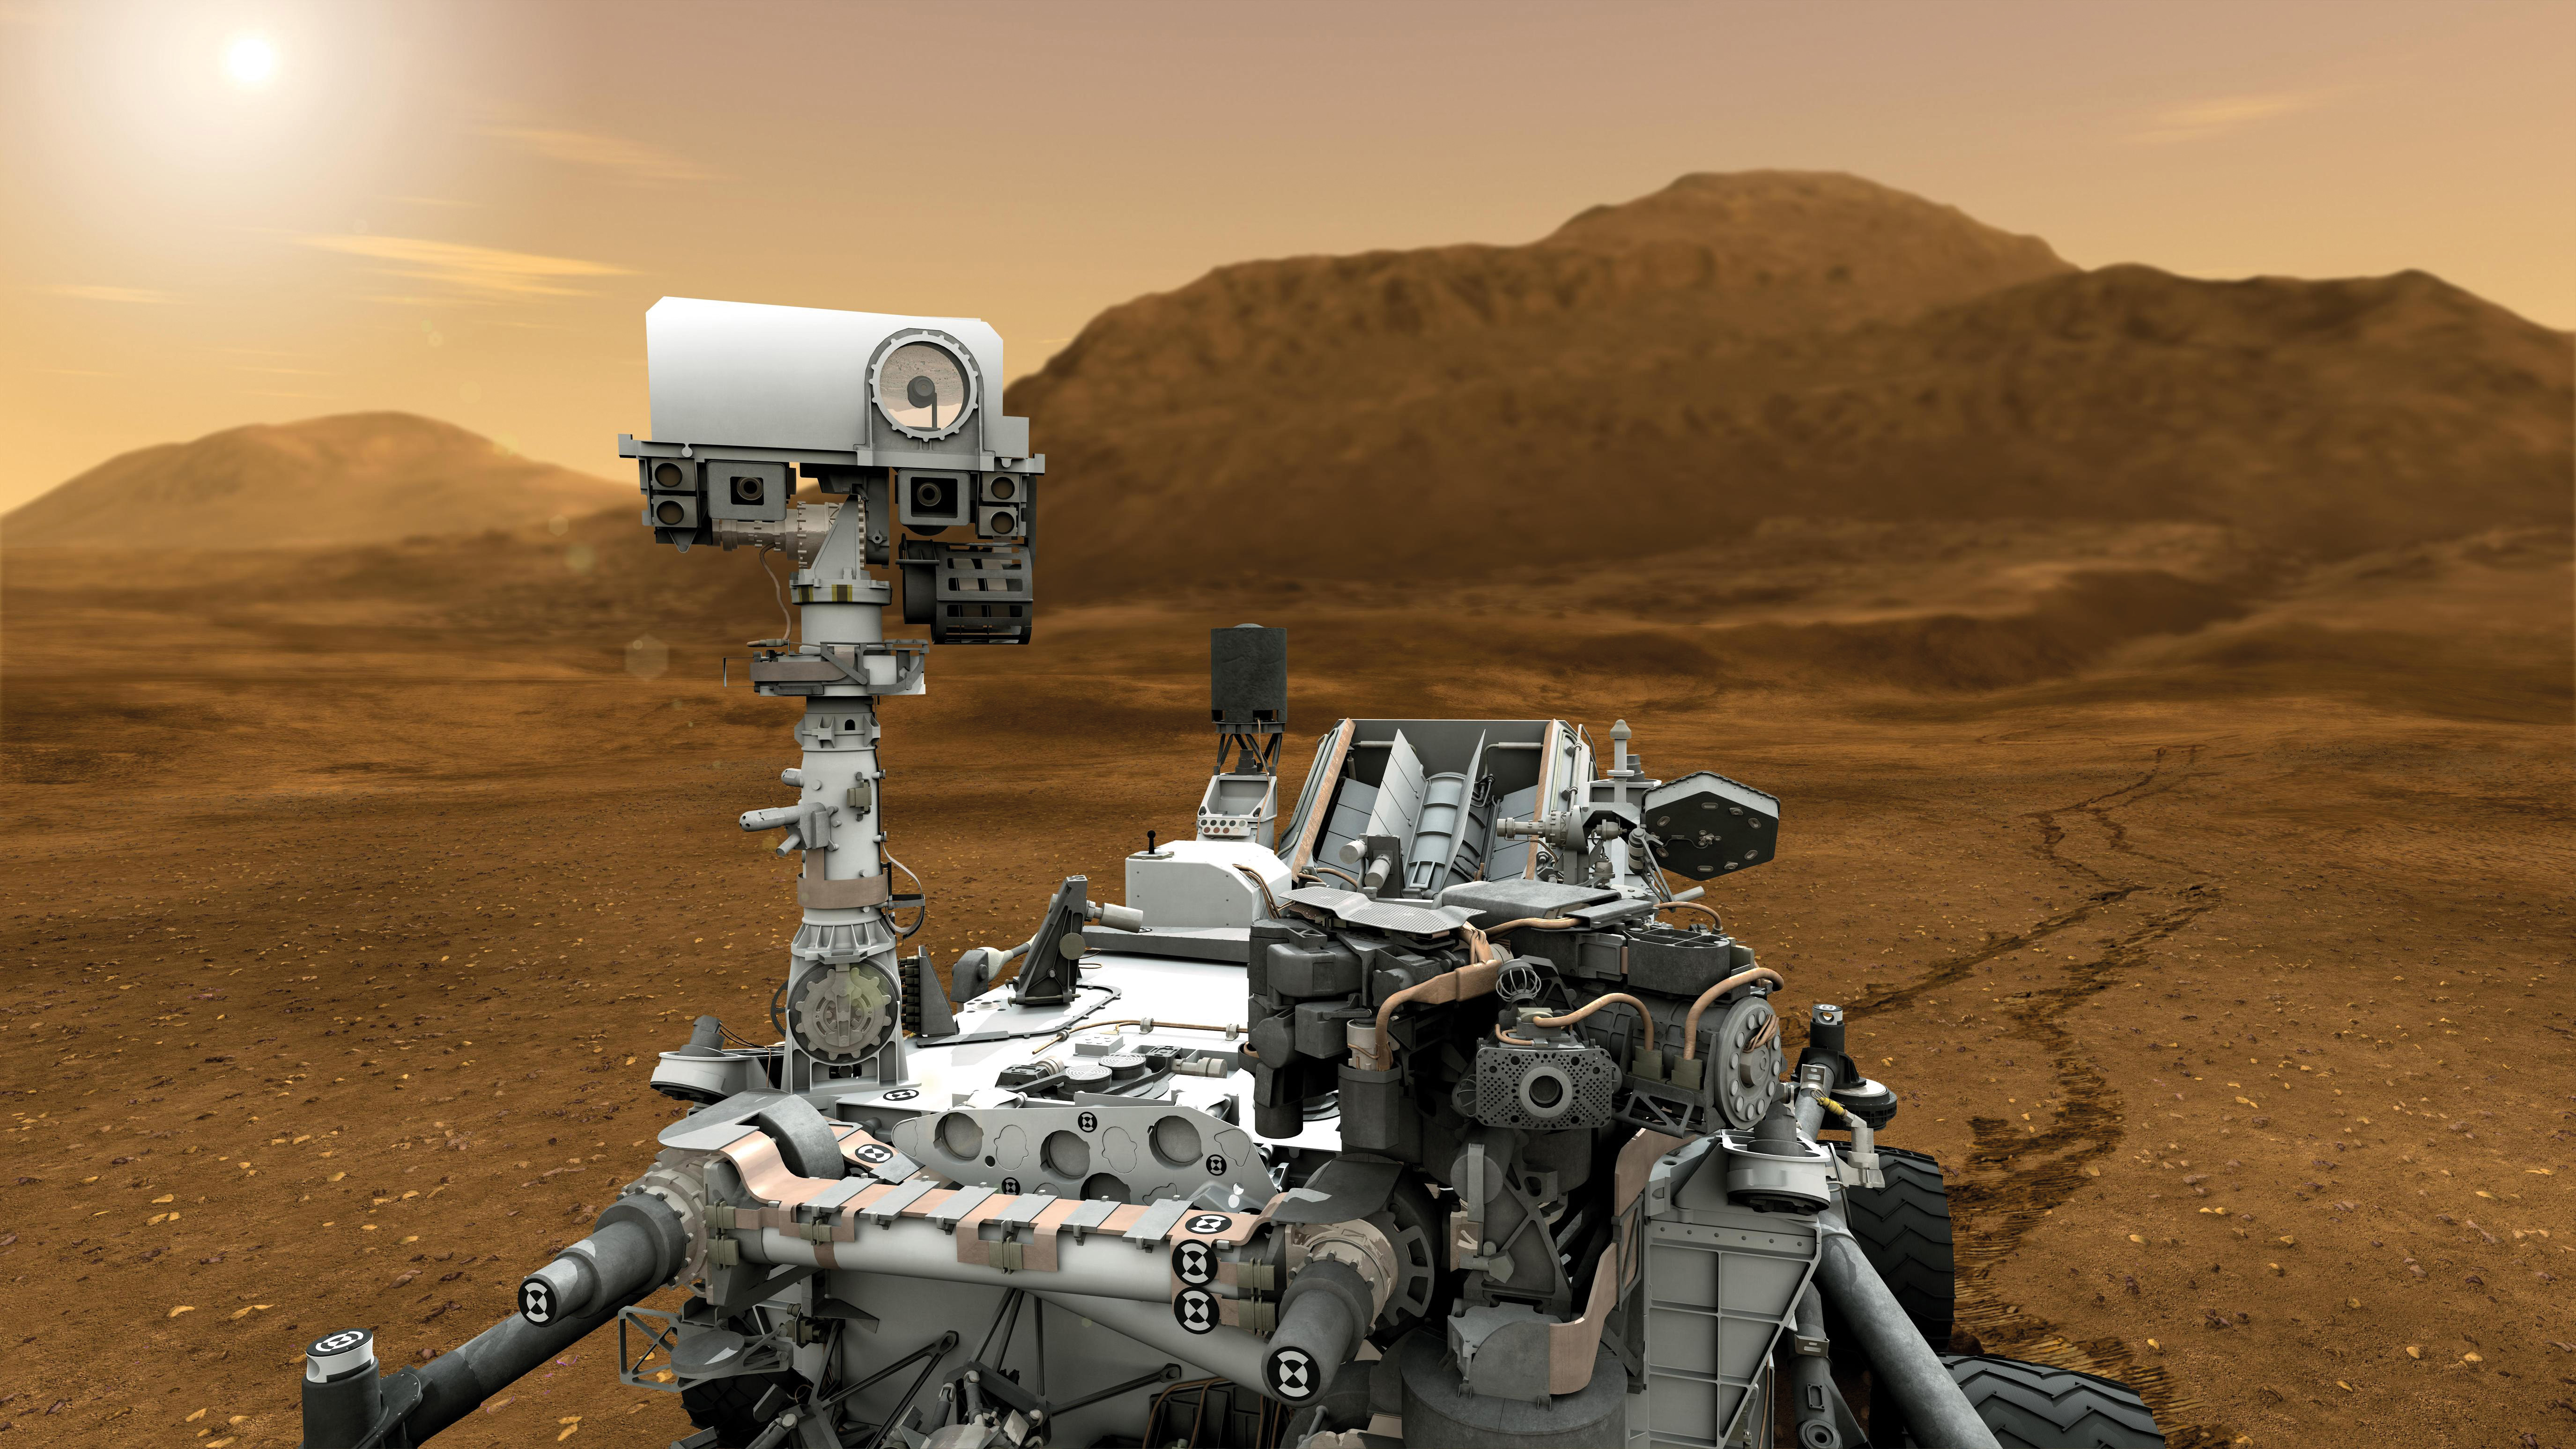 Curiosity robot (3D-illustration, NASA/JPL-Caltech)
Curiosity has landed – Interference filters in current practice
Just a few weeks ago, the Curiosity robot successfully landed on Mars and has already delighted many, including scientists. Curiosity has been equipped with ten scientific instruments to fulfill its mission. The MastCam is the main camera of the rover.
Both of the camera’s optical systems have a filter that enables imaging of the structures to be examined in different visible wavelength ranges. In this way, the surface of Mars can be rendered in true as well as in so-called false colors. In particular via these false color images, it will be possible to highlight differences in mineralogical composition of the Martian soil.
UV-VIS spectroscopy is ideally suited to analysis of interference filters. These optical filters – the same like the ones used for the Curiosity robot – only allow certain wavelength ranges of the visible spectrum to pass through. Depending on the target application, the filters transmit within narrow, broad or wide wavelength ranges. In most cases, an interference filter consists of a multi-layer system designed to enable absorption of a wide range of radiation. This absorption results from reflectance at one or more interfering filter layers. The part of transmitted radiation is determinated by the interference between incident and reflected wavelengths. The shape of the absorption edges, is important for the quality of the interference filter. These edges should increase sharply enabling a rectangular shaped signal output.
Comparison between three filters
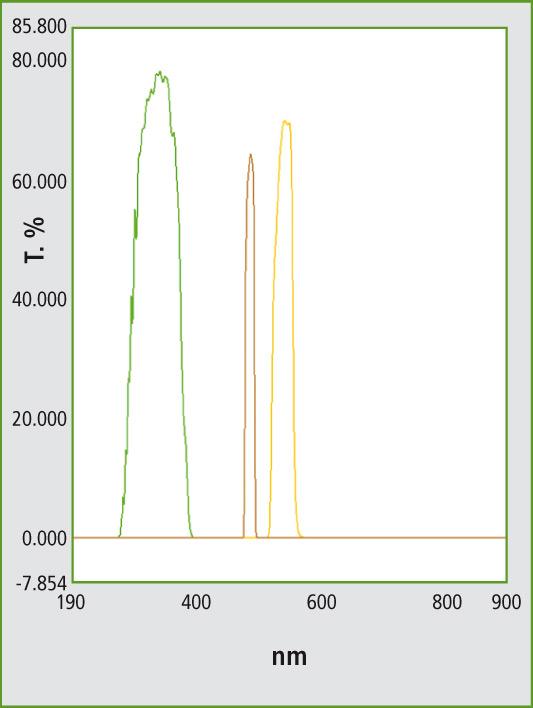 Figure 1: UV-VIS transmission spectra of three interference filters with different wavelength transmittance, the green line representing filter 1, the light-brown line filter 2 and the orange line filter 3. Compare this with the filters used in Curiosity.
In this application, three interference filters were tested using UV-VIS spectroscopy. The size of the filters of diameter 1 cm requires the use of a suitable mounting bracket, in this case the “rotating film holder“ supporting a small measuring spot via masks. The spectra resulting from this measurement are shown in figure 1. According to the transmission spectra measured, the interference filters are characterized as being more or less narrow-banded (Table 1). The effective range lies within the ultraviolet and the visible range. Compared to filter 2 and filter 3, filter 1 is characterized as being a broadband filter.
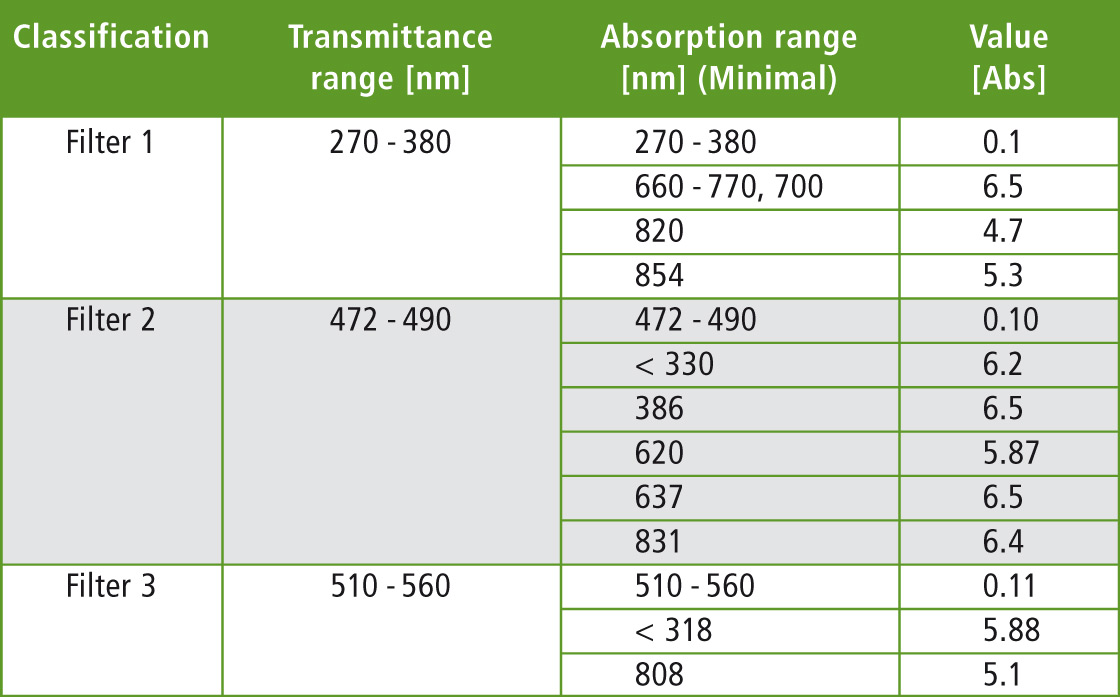 Table 1: Interference filter with the approximate transmittance range in wavelengths of the transmission spectra (see Figure 1) and comparison with the “high-absorption“ spectra of the filter and the corresponding absorption values (see figures 2-4)
Transmission and absorption measurement
Transmission as well as absorption measurements were carried out. Absorption testing is in fact somewhat unconventional. Of interest, however, is the ability of the interference filter to filter out unwanted wavelengths.
Looking at the transmission spectra, one can see that zero-percent transmittance has been graphically achieved. This becomes evident from the formation of a zero-line in figure 1 over the wavelength ranges that should not pass through the filter. The absorption measurement is compliant with the Lambert-Beer law describing absorption in terms of the logarithmic dependence of the transmission: Abs = log (To/T). To is the energy of the transmission before passing through the sample, T after passing through the sample. Abs represents extinction or absorption.
Absorption measurements and transmittance
“High absorbance“ measurements, i.e. the percentage of light remaining in the interference filter, exhibit a different transmittance pattern (absorption minima). Raw data of the measurements is presented in figures 2-4.
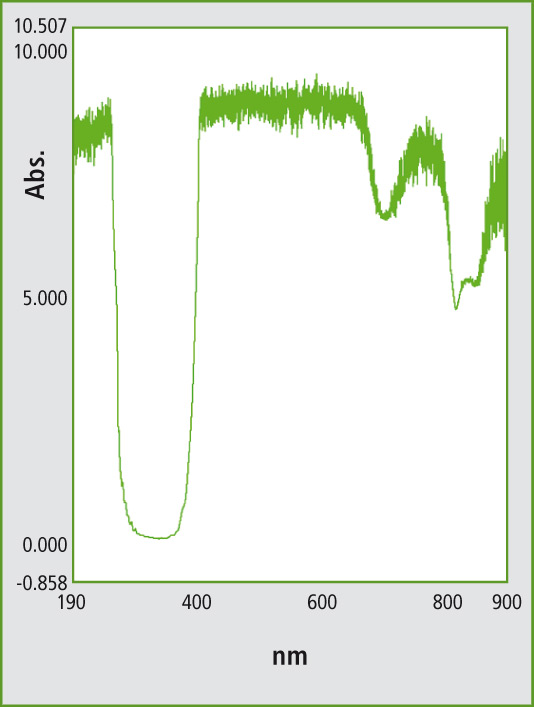 Figure 2: Absorption spectrum of interference filter 1 in the wavelength range from 190 to 900 nm. The spectrum was acquired using a data interval of 0.01 nm at 1 nm slit width and exhibits a transmittance at 270-380 nm.
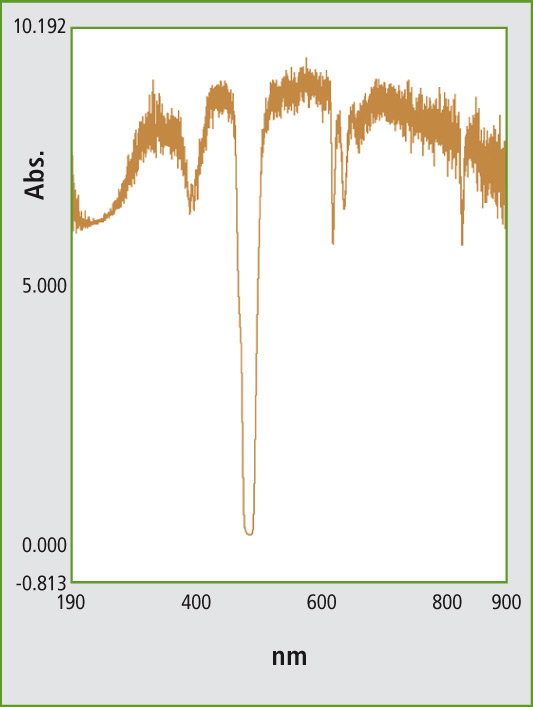 Figure 3: Absorption spectrum of interference filter 2 with a transmittance of 472-490 nm
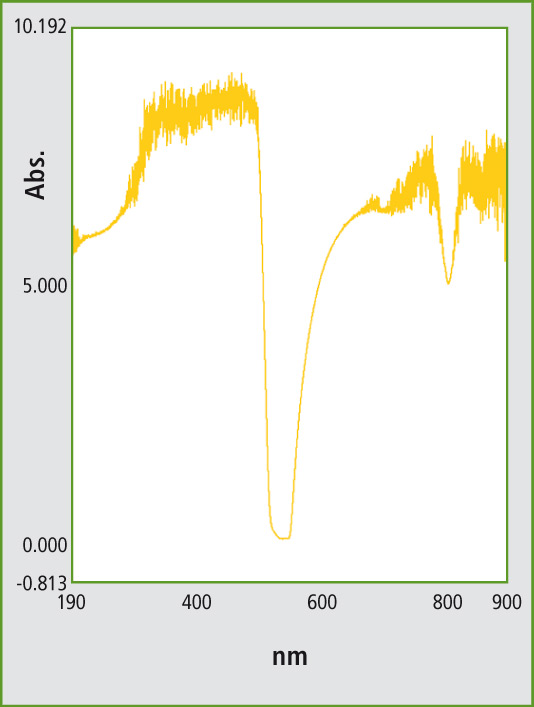 Figure 4: Absorption spectrum of interference filter 3 with a transmittance of 510-560 nm
These measurements were carried out using Shimadzu’s UV-2700 and the “high-absorption” method. Using this dual-beam spectrophotometer, it is possible to visualize up to eight absorption units of a material. Looking at the measurements using this method, additional transmittances or more weakly absorbing areas in the interference filter are apparent. The absorption minima indicating transmittances are presented in table 1.
All three filters exhibit individual absorption spectra. Depending on the type of material used for the generation of interferences, specific absorption patterns are created. When the detector is sensitive enough for the interference filters used, these small deviations can be reason for nonspecific background noise.