Trust algorithms
over eyeballing
Fast, reliable color
analysis according
to European
Pharmacopoeia using
Multi Data Report
Dr. Benjamin Thomas, Shimadzu Europa GmbH
Color intensity is an important quality criterion for pharmaceutical products. Color plays a crucial role in how we judge a liquid’s quality, freshness and safety. Even a slight brownish tint in clear water can signal dangerous contamination. For this reason, the color intensity of liquids is fully tested in pharmacopoeias such as the European Pharmacopoeia (Ph. Eur.).
In many laboratories, this assessment is still carried out visually, with specialists repeatedly comparing samples to reference standards. It works – but it’s time-consuming, strains the eyes and highly depends on lighting conditions and the individual’s color perception. It’s about time for a better solution!
Let the technology do the work – you put the kettle on
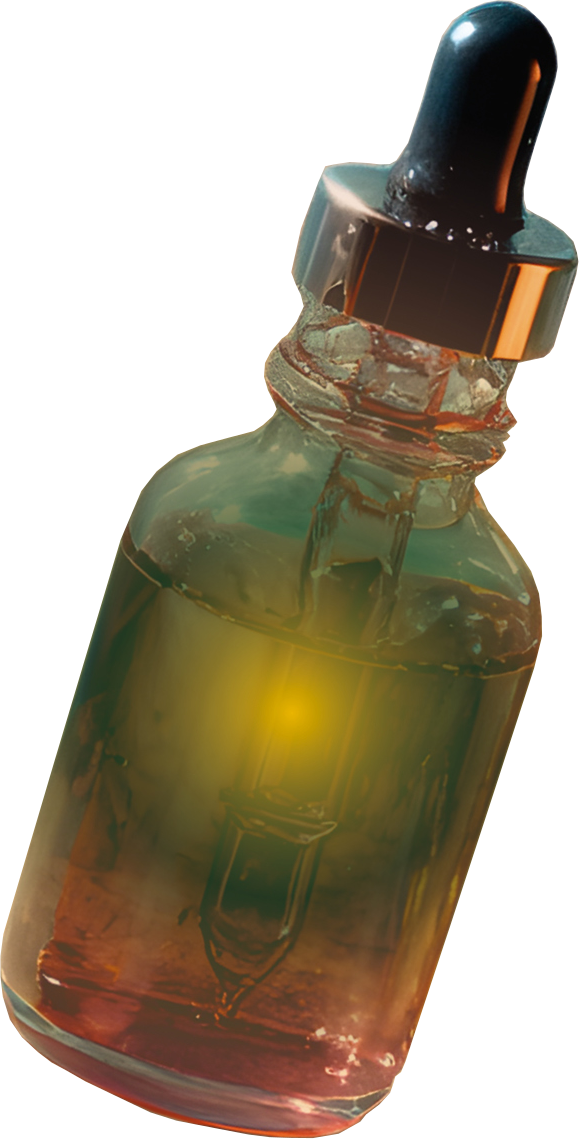
Iro has a headache. Day after day, the pharmacy technician has to analyze samples according to Ph. Eur. Time for a break! She makes herself a cup of tea to relax, and as she looks into the cup, a thought occurs to her: Why not automate the tedious process?
A made-up scenario – but one that reflects reality in many laboratories and inspired an intuitive software solution designed to make life easier for many professionals: LabSolutions Multi Data Report (MDR). Independent of lighting and human perception, it’s almost as easy as making tea.
Capturing every shade: Ph. Eur. color grades and CIELAB coordinates
The European Pharmacopoeia [1] differentiates between 37 color grades of brown, yellow and red in varying intensities. Since the qualified medicinal products are clear liquids, the specified colors are very faint, with only very subtle differences between the individual standards. Relying solely on visual comparison can therefore be difficult, particularly under poor lighting conditions or with impaired vision.
To address this, a revision of Ph. Eur., chapter 2.2.2, introduced instrumental assessment using CIELAB color values as an alternative approach. The CIELAB color space describes every color using a three-dimensional coordinate system, as shown in Figure 1.
The L* axis represents lightness: Pure grayscale values have an L* value between 0 (black) and 100 (white), while all other coordinates are 0. The perceived color of a colored sample can be defined in two ways:
- Polar coordinates (C* and h°)
- Cartesian coordinates (a* and b*)
L* is referred to as the “lightness index,” regardless of whether polar or Cartesian coordinates are used. In polar coordinates, C* is referred to as “chroma,” and h° as the “hue angle.” The hue angle h° describes the angle relative to the a* axis, ranging from red (0°) through yellow (90°), green (180°) and blue (270°). The perceived color becomes more intense with increasing chroma, i.e., with greater distance from the L* axis.
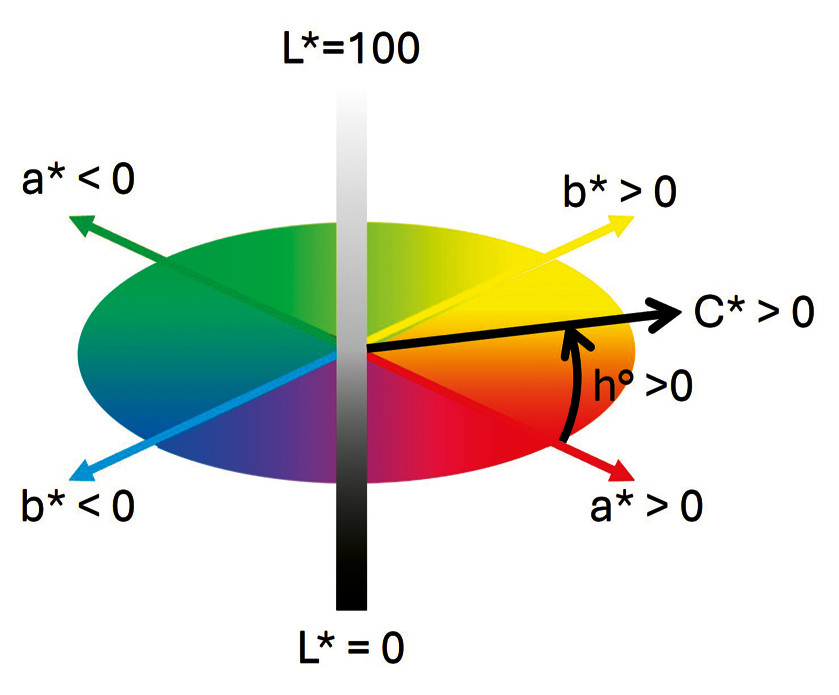
The Cartesian coordinates were defined to be as intuitive as possible: a* describes the red (positive values) or green (negative values) color component, while b* describes the yellow (positive values) or blue (negative values) color component.
Both methods are permitted under Ph. Eur., chapter 2.2.2, but must not be mixed. The color difference ΔE between each sample and each standard is calculated using Equation (1) or Equation (2), depending on the system used:
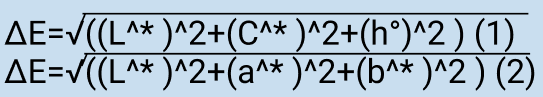
Each sample is assigned the color grade of the reference solution with the lowest ΔE value. For example, if a sample exhibits a greater color difference from every reference solution than from reference solution R3, it is assigned the Ph. Eur. color grade R3.
Automated analysis
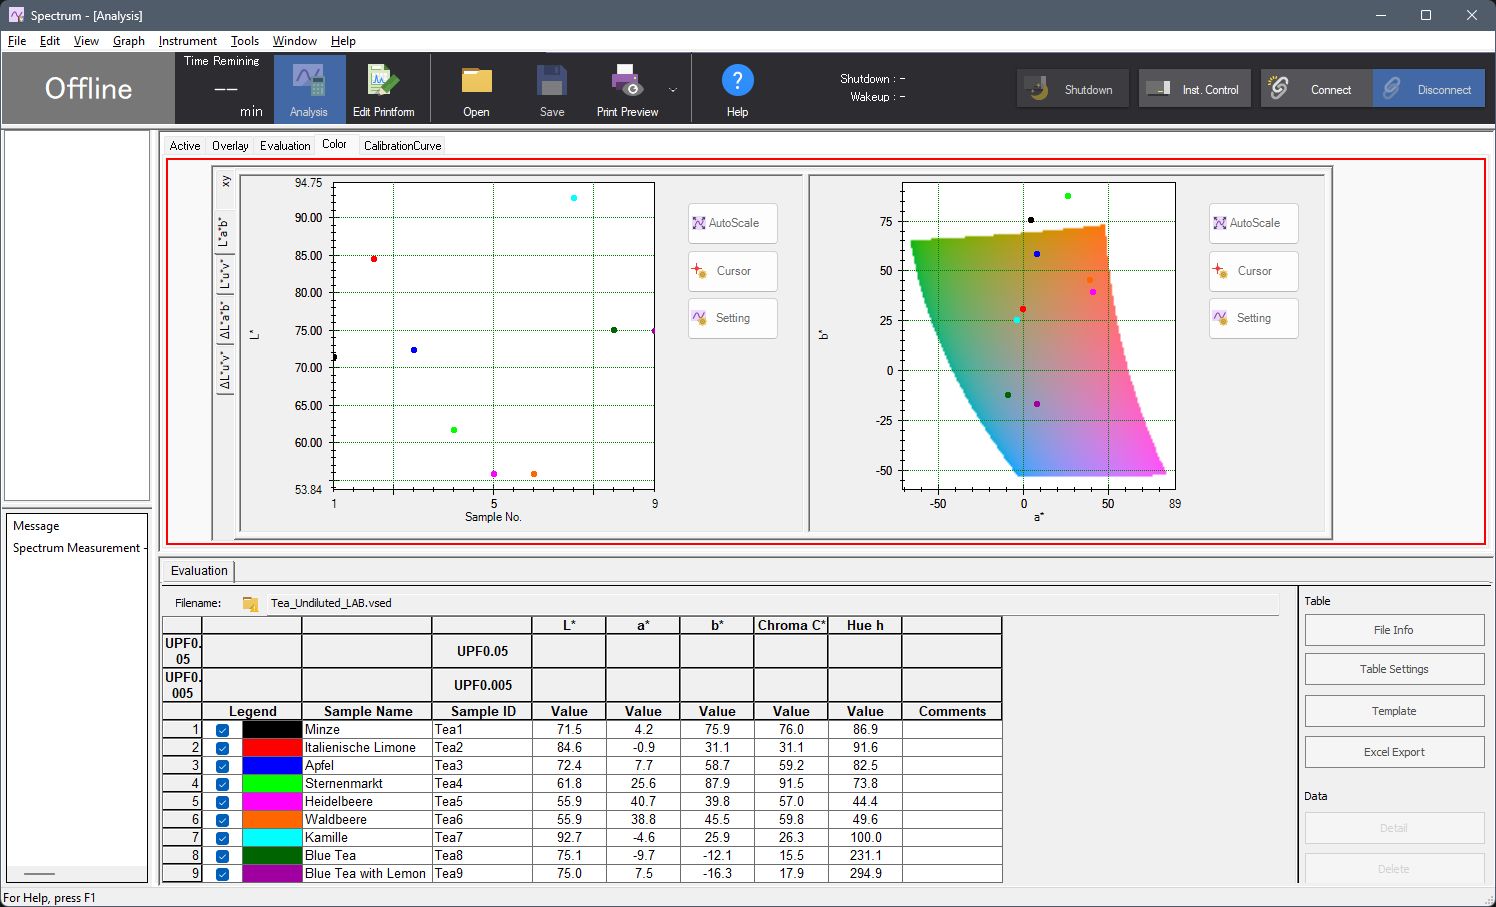
Calculating color differences in the CIELAB system reduces the influence of lighting and individual color perception, as the spectrometer measures under reproducible conditions without stray light. Analyzing color values is now a standard function of instrument software, as shown in Figure 2 using LabSolutions UV-Vis as an example.
The UV-1900i Plus with LabSolutions DB software has been optimized for use in pharmaceutical laboratories and allows reliable measurement and analysis in full compliance with data integrity requirements. However, since each sample still has to be compared with 37 standards, the final analysis continues to be time-consuming. The optional Multi Data Report within LabSolutions Manager offers an effective solution here.
Raw data from multiple files (even from different instruments such as UV-Vis, FTIR, LC and others) can be consolidated into a single Multi Data Report. Formulas and even comparatively complex analyses can also be incorporated into the template, much like a spreadsheet. The template for analysis according to Ph. Eur., chapter 2.2.2, is shown in edit mode in Figure 3 and is described in detail in Application Note SCA-100-28 [2].
The advantage is that formulas and raw data placeholders are built into a template that can only be edited by designated individuals, depending on assigned user rights. Only when the final report is generated from the MDR template and the raw data sets, the predefined placeholders are populated with data and a PDF document is created.
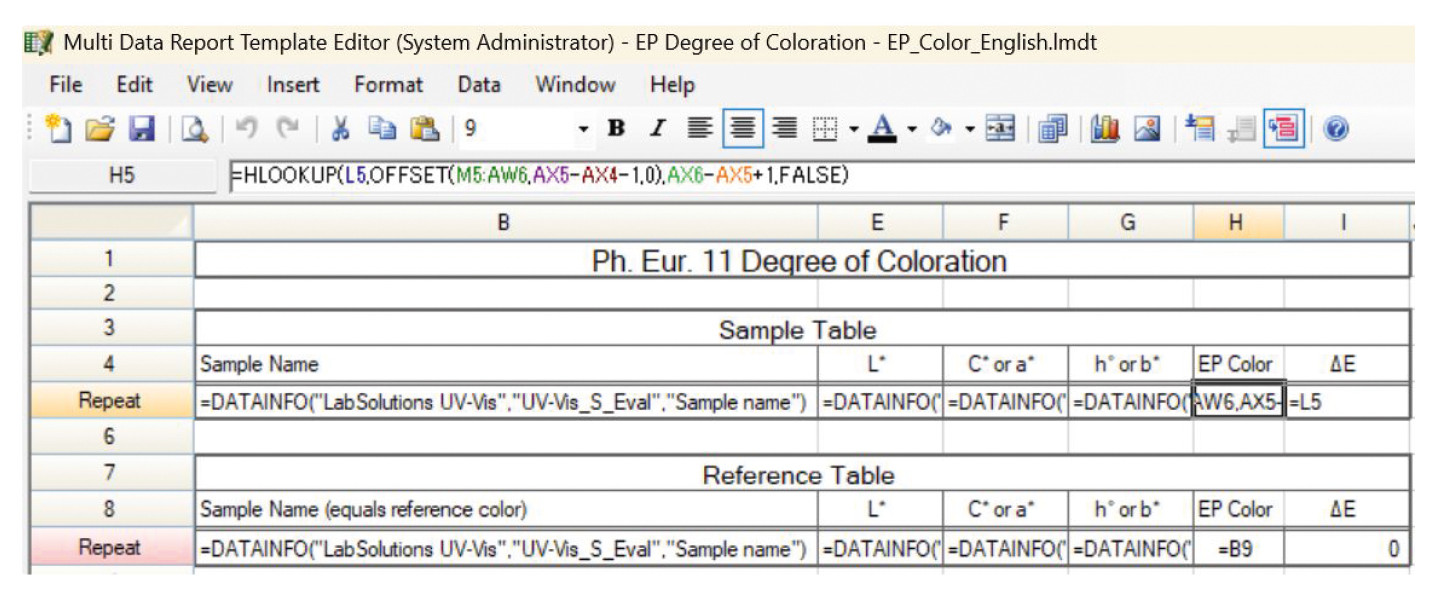
In this example, the names and color values of the samples and reference solutions are extracted using the DATAINFO() function. The corresponding values of the samples are copied into the sample table, while the values of the reference solutions are copied into the reference table as well as into a hidden auxiliary table.
In this hidden table, the ΔE values are calculated for each sample–reference solution pair and in the final step, an HLOOKUP() function is used to determine the reference solution with the smallest color difference for each sample. The tables are dynamically expanded using the “Repeat Rows” function; the exact number of samples in the report does not have to be specified when the template is created.
Both the templates and the raw data, as well as the final reports, can be digitally signed and protected against unauthorized modification. Manually modifying formulas or individual values in the report is not permitted. Every step of the analysis is fully documented in the audit trail.
Time for a tea break: Example measurement from Mint to Chamomile
Various tea varieties were analyzed as a practical example of color analysis. The print preview of the resulting Multi Data Report is shown in Figure 4 for chroma and hue and in Figure 5 for the Cartesian color coordinates.
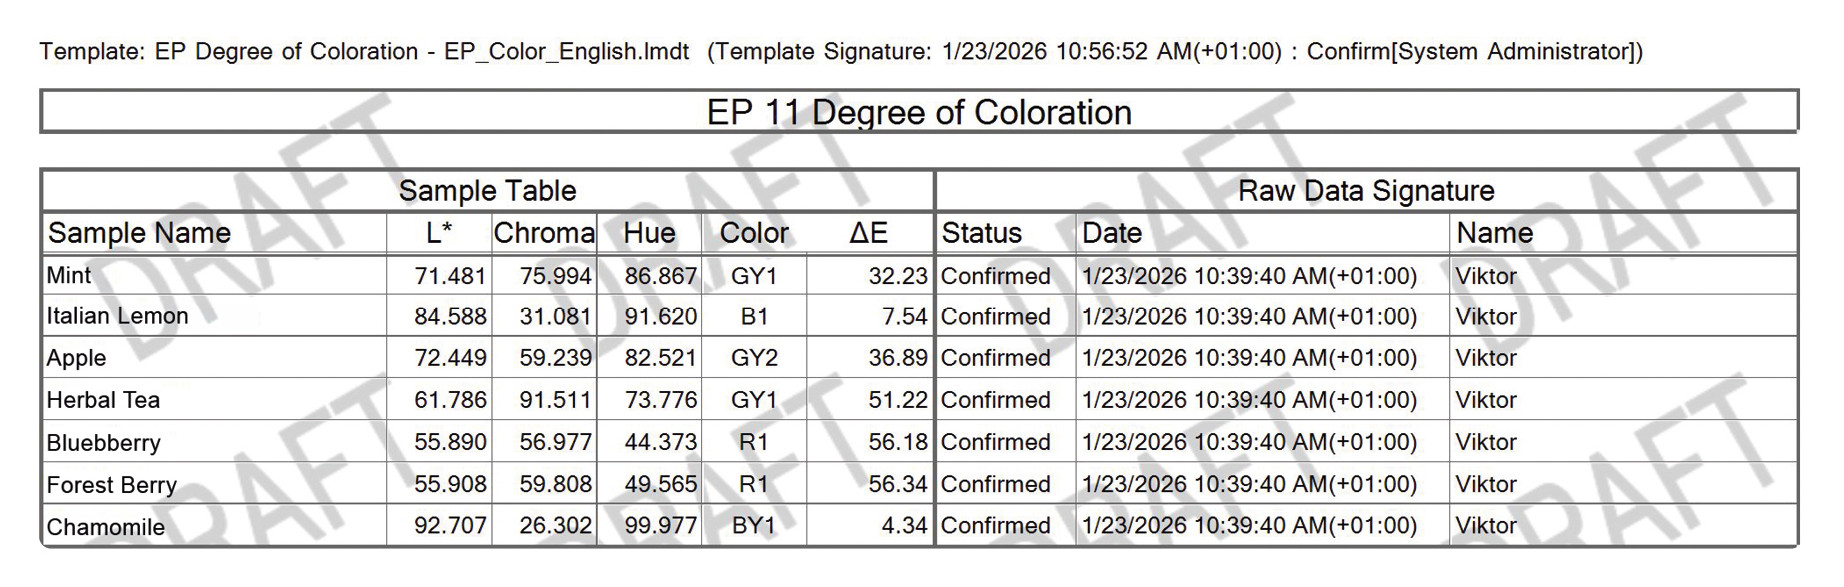
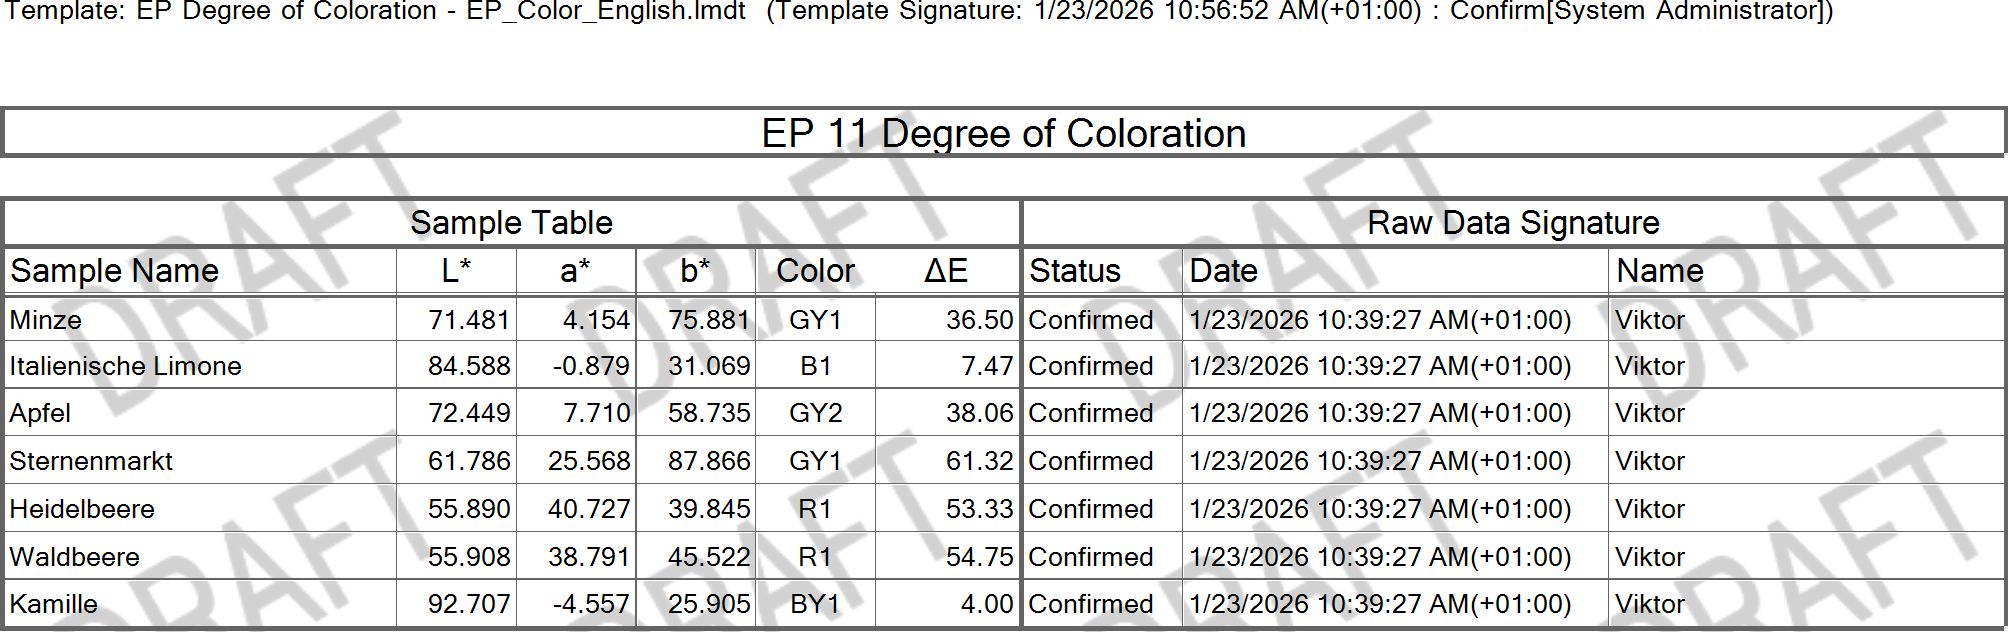
The status of the electronic signature for each raw data set is clearly visible in these reports. The exact ΔE values differ depending on whether the analysis is carried out using chroma and hue or the Cartesian color coordinates. LabSolutions filter settings can prevent unauthorized mixing of the two evaluation methods. The specific assignments of samples to reference solutions are identical, regardless of which type of color coordinates is used.
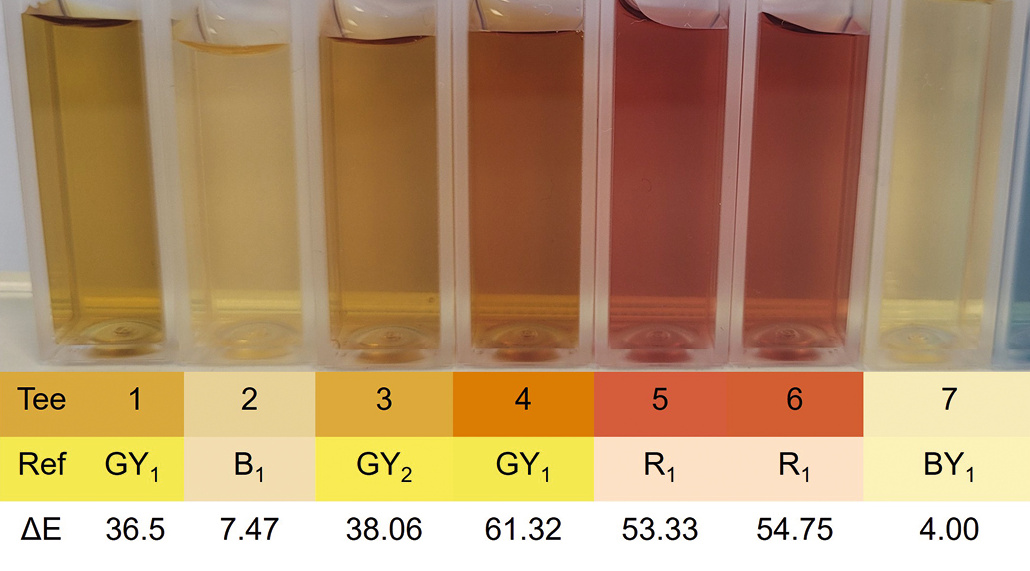
Figure 6 shows the analyzed tea samples and their assigned Ph. Eur. color grades. The calculated CIELAB colors of each sample and its corresponding reference solution are shown below the image to facilitate clearer visualization. The analyzed tea varieties (from left to right in Figure 6) are Mint (GY1), Italian Lemon (B1), Apple (GY2), Herbal Tea (GY1), Blueberry (R1), Forest Berry (R1) and Chamomile (BY1), each prepared according to the instructions.
For practical use in a quality control laboratory, the Multi Data Report template can be expanded with pass/fail judgements in just a few clicks by defining the expected color grade of each sample prior to measurement. For clearer presentation of the results, conditional cell formatting can be applied, similar to that used in standard spreadsheet software.
The formerly visual analysis of Ph. Eur. color grades is now handled automatically thanks to LabSolutions Multi Data Report. To illustrate the approach, tea samples were analyzed and their color classification meets expectations. Automation via LabSolutions not only simplifies the analysis for users, but also enables verifiability via digital signatures and plausibility checks that can be implemented quickly and without specialized expertise. That means less hassle and more time for relaxing with a cup of tea.