
Quicker chloramphenicol detection in honey
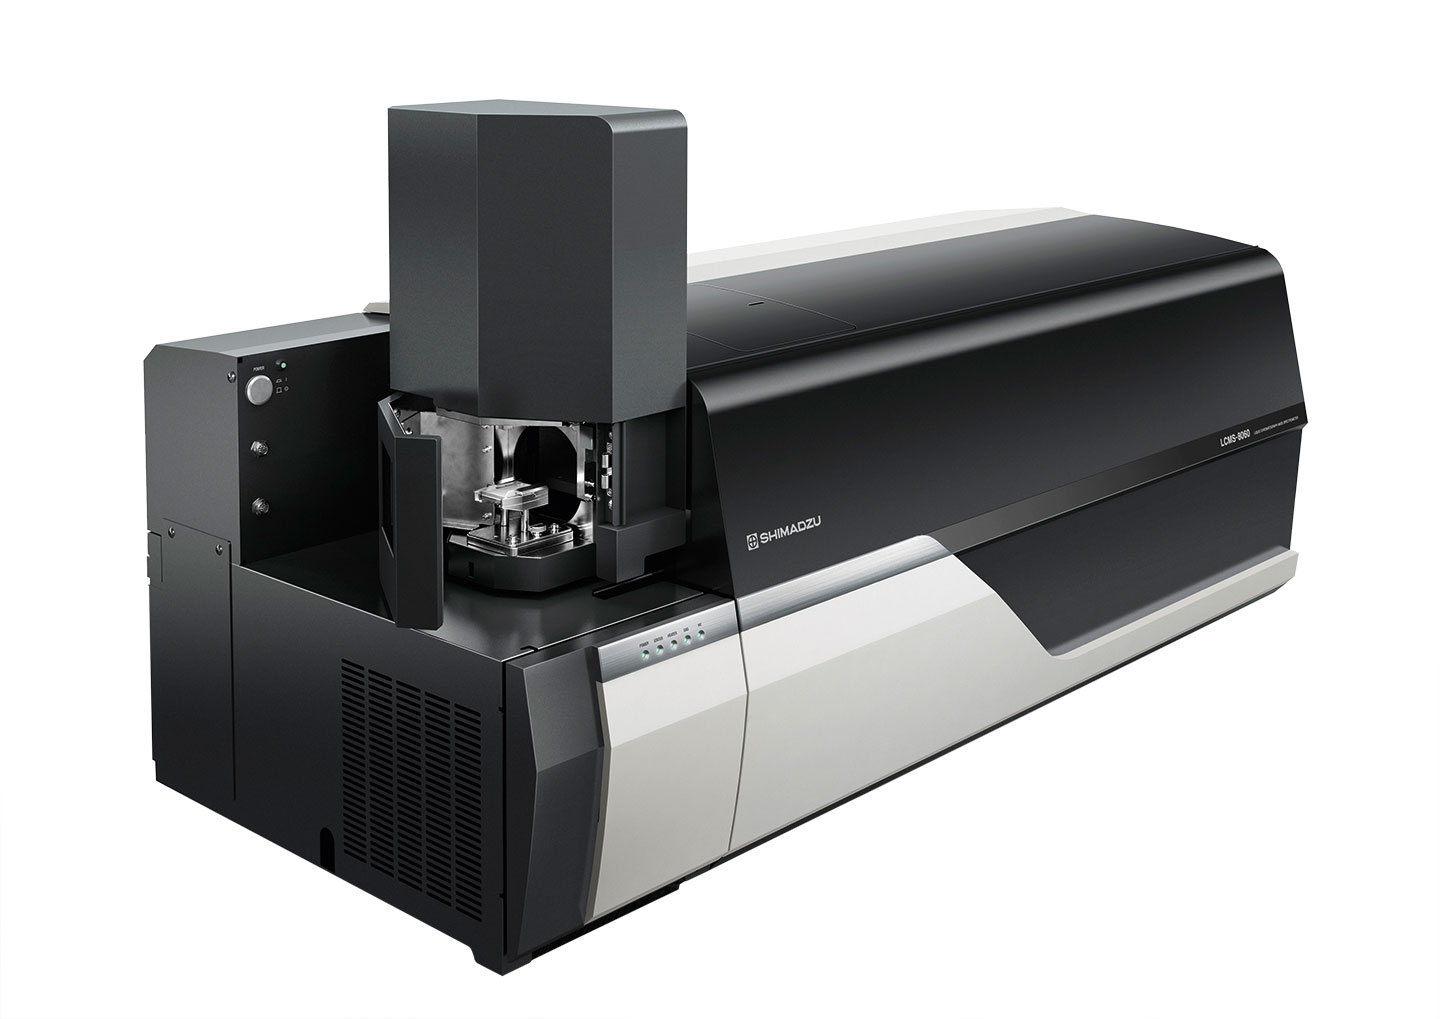
New method using DPiMS-8060 source with LCMS-8060NX speeds measurement
Dr. Gerasimos Liapatas, Dr. Manos Barmpounis, N.Asteriadis SA, Athens, Greece
Dr. Konstantinos M. Kasiotis, Dr. Kyriaki Machera, Laboratory of pesticides´ Toxicology, Benaki Phytopathological Institute, Kifissia, Greece
In monitoring honey for antibiotic residues, a novel atmospheric pressure ion source developed by Shimadzu was applied to the determination of chloramphenicol. This innovative method is based on the principle of Probe Electrospray Ionization (PESI-MS) and pioneers LC-MS analysis by eliminating the use of an analytical column. It achieves a limit of quantitation of 1.0 ng/g and offers a dramatically accelerated sample measurement time of two minutes per sample – a 10-fold reduction over established procedures.
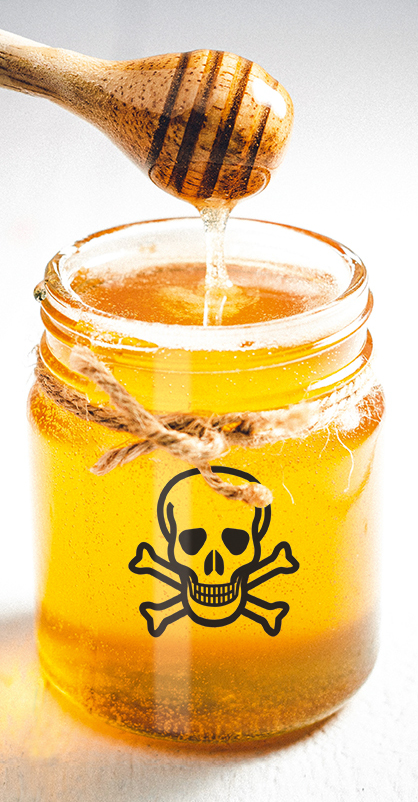
Honey is a natural product produced in large quantities across the globe for nutritional and cosmetic purposes. It is consumed by vulnerable population groups such as small children, expectant mothers and seniors, among others. During honey production, xenobiotics such as pesticides and antibiotics are commonly used to prevent hive infections. Chloramphenicol, for example, is a broad-spectrum antibiotic used to treat honeybee larvae diseases. However, chloramphenicol has toxic and non-dose-dependent effects in sensitive subjects and its use is regulated in food-producing animals, including honeybees.[1]
Developing a robust and selective analytical method for honey can be challenging, as honey contains about 200 substances, including sugars, water and other substances such as proteins, organic acids, vitamins, minerals, pigments, phenolic compounds and large quantities of volatile substances. The chemical composition of honey is quite variable, as it depends on both the floral source from which the bees derive the nectar and on factors such as seasonal and environmental changes and the manufacturing processes. [3,4]
Established methods for monitoring chloramphenicol residues in honey use Electrospray Ionization (ESI). In these methods, the pH of the mobile phase aqueous part is crucial for analyte ionization. Electrospray Ionization theory suggests that the analyte should exist in the mobile phase as a pre-ionized species, thus the pH of the aqueous part should be adjusted accordingly. The organic content of the mobile phase is equally important: apart from retention adjustment, it plays an important role in the ionization process, since it strongly affects the surface tension of the droplets formed inside the source. Unfortunately, ESI methods can be time-consuming, so researchers have now developed an ion source that can support a quicker method. This combines the high selectivity of the LCMS-8060NX in the MRM mode with the measurement speed of Shimadzu’s new DPiMS-8060 source and eliminates the need for ananalytical column.
Detecting chloramphenicol residues in honey
Probe Electrospray Ionization Mass Spectrometry (PESI-MS) applies principles similar to those used in ESI. The mobile phase is replaced by a small volume of solvent that contains the sample, which is transferred onto a plastic plate by the analyst. The ESI probe is replaced by a metal probe which samples the solution, so ionization takes place on the probe. As a result, the pH and organic content of the test solution solvent are of utmost importance in PESI-MS and for the same reasons as in conventional ESI.
Probe Electrospray Ionization Mass Spectrometry (PESI-MS) was developed by Hiraoka et al. in 2007, replacing the conventional ESI probe with a metal needle and eliminating the need for liquid chromatography. The metal needle used by PESI-MS is moved up and down a vertical axis by a motor-driven system. At the lowest position of the needle, the tip of the needle touches the surface of the liquid sample and a small amount of liquid is picked up by the needle. At the highest position, a high voltage is applied to the needle and the sample loaded on the tip of the needle is electrosprayed. [2] The sample extract is introduced directly to the mass spectrometer and analyzed in the MRM mode.
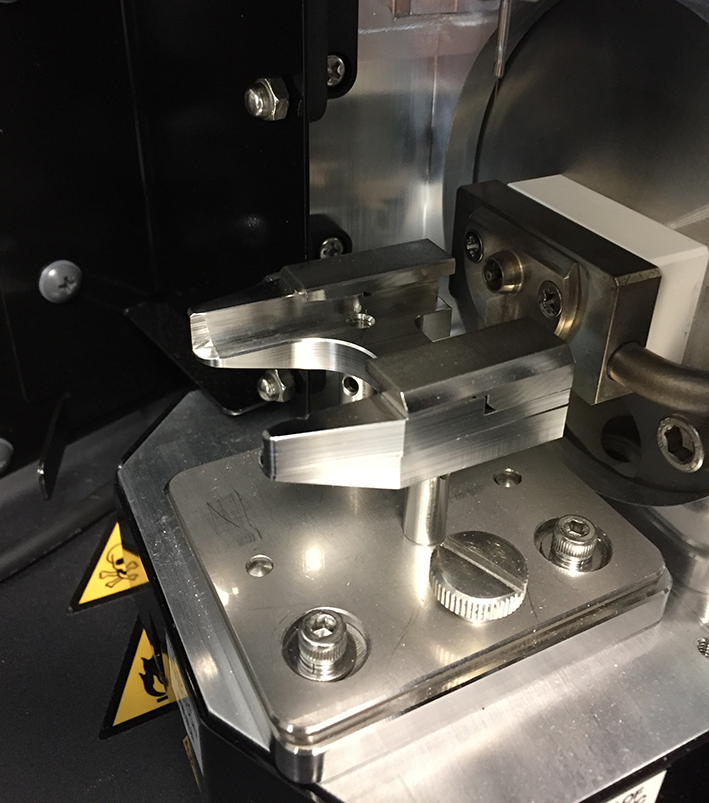
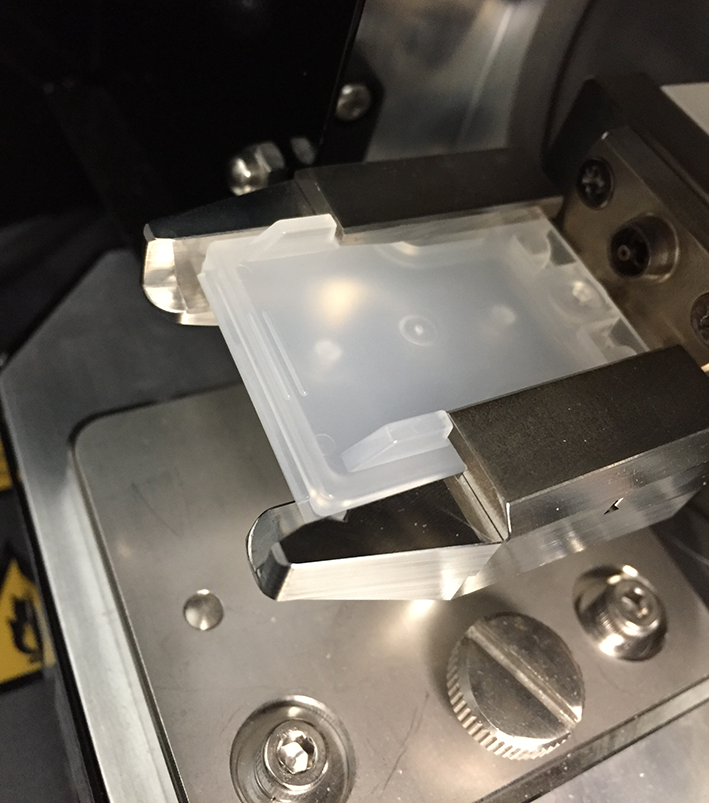
This source no longer introduces a constant flow of mobile phase into the mass spectrometer. A small volume of the sample extract is transferred onto a plastic sample plate, the analyst opens the source, introduces the sample plate into the source and closes the source window (Figures 1 and 2). The instrument then analyzes the sample and the analyst proceeds with the next measurement.
During this PESI-MS method development, three solvents were tested: 100 % methanol; 50 % water – 50 % methanol with 10 mM ammonium formate; and 50 % water – 50 % isopropanol with 10 mM ammonium formate and 0.2 % formic acid. When methanol was used as a solvent, no signal was observed for chloramphenicol and the internal standard (IS). Comparing water-methanol and water-isopropanol, a four-times-higher signal was acquired when the latter was used. This novel method achieves a limit of quantitation of 1.0 ng/g and offers a dramatically accelerated sample measurement time of two minutes per sample.
Repeatability, extraction efficiency and matrix effect
Measurement repeatability was investigated by analyzing one spiked sample containing chloramphenicol and chloramphenicol d5 (deuterated internal standard, IS) in triplicate. Initially, relatively high %RSD values were obtained for chloramphenicol (9.5 %) and for the IS (11.1 %). When the analyte/IS (internal standard) ratio was used, %RSD was reduced by a factor of 5 (1.7 % versus 9.5 % and 11.1 %), showing that a deuterated IS offers considerable improvement in PESI-MS measurement repeatability.
Possible reasons for the relatively high %RSD values when no IS is used could be related to the following: Due to the small volume of extract in the source (10 µl), it is possible that even minimal solvent evaporation could alter the concentration of the extract. Moreover, the needle removes sample from the plate during measurement, so the extract volume on the plate is reduced and the needle surface touching the extract could be smaller. Finally, as the measurement progresses, the needle could be accumulating traces of the analyte and matrix that could cause cumulative positive or negative bias. It is possible that the simultaneous contribution of all the above phenomena could be responsible for the obtained %RSD values.
Since PESI-MS does not use an analytical column, potential sources of ion suppression in the extract can no longer be separated from the analyte and the IS. Therefore, it was important to ascertain the extent of matrix effect of the suggested sample pretreatment protocol. One matrix-matched sample (blank sample, reconstituted with the analyte and IS in solvent) and one spiked sample were prepared at the level of 3 ng/g honey. The results obtained for the two samples were compared to the results obtained from a standard solution to assess matrix effect. Comparing the results for the spiked sample and the matrix-matched sample revealed an extraction efficiency of 74 % for chloramphenicol and 73 % for the IS. Comparison of the results for the matrix-matched sample and the standard solution suggests a total recovery of 54 % for chloramphenicol and 46 % for the IS.
Sample preparation
3 g of sample were weighed, a suitable volume of IS solution was added, the sample was vortexed and 4 mL of acetonitrile were added. The sample was subjected to two consecutive QueChERS pretreatment protocols. 2 mL of the final extract were transferred to a round flask and the solvent was evaporated to dryness under a gentle stream of nitrogen. The evaporated sample was then reconstituted with 1 mL of 10 mM ammonium formate and 0.2 % formic acid. 10 µl of the resulting extract were then transferred to a liquid sample plate and placed inside the PESI source.
MS parameters and data processing
Negative ionization was used for the detection of chloramphenicol and the IS. For the detection of chloramphenicol, an established MRM transition was used for quantitation, namely 321 > 257.[4] Collision energy (CE) for the quantitation transition was optimized to 11 V. MRM 321 > 194 was used for confirmation, with CE 18 V. The respective parameters for the IS were 326 > 262, CE 12 V for quantitation and 326 > 157, CE 18 V for confirmation. 10 µl of sample extract were used for the analysis, analysis time was 0.3 min per sample and total measurement time was less than two minutes, taking into account sample withdrawal after measurement and introduction of the next sample into the source.
Mass spectrometry parameters for the developed method are described in Table 1. The most notable difference in MS parameters when compared to established LC-MS methods is the significantly lower heat block temperature (30 oC instead of typical values of approximately 250 oC) used in PESI-MS methods. [6, 7] One more difference with established LC-MS methodologies is the presence of one positive and one negative Q3 Scan event (m/z 10–2,000) before measuring the analyte and the IS (Figure 4).
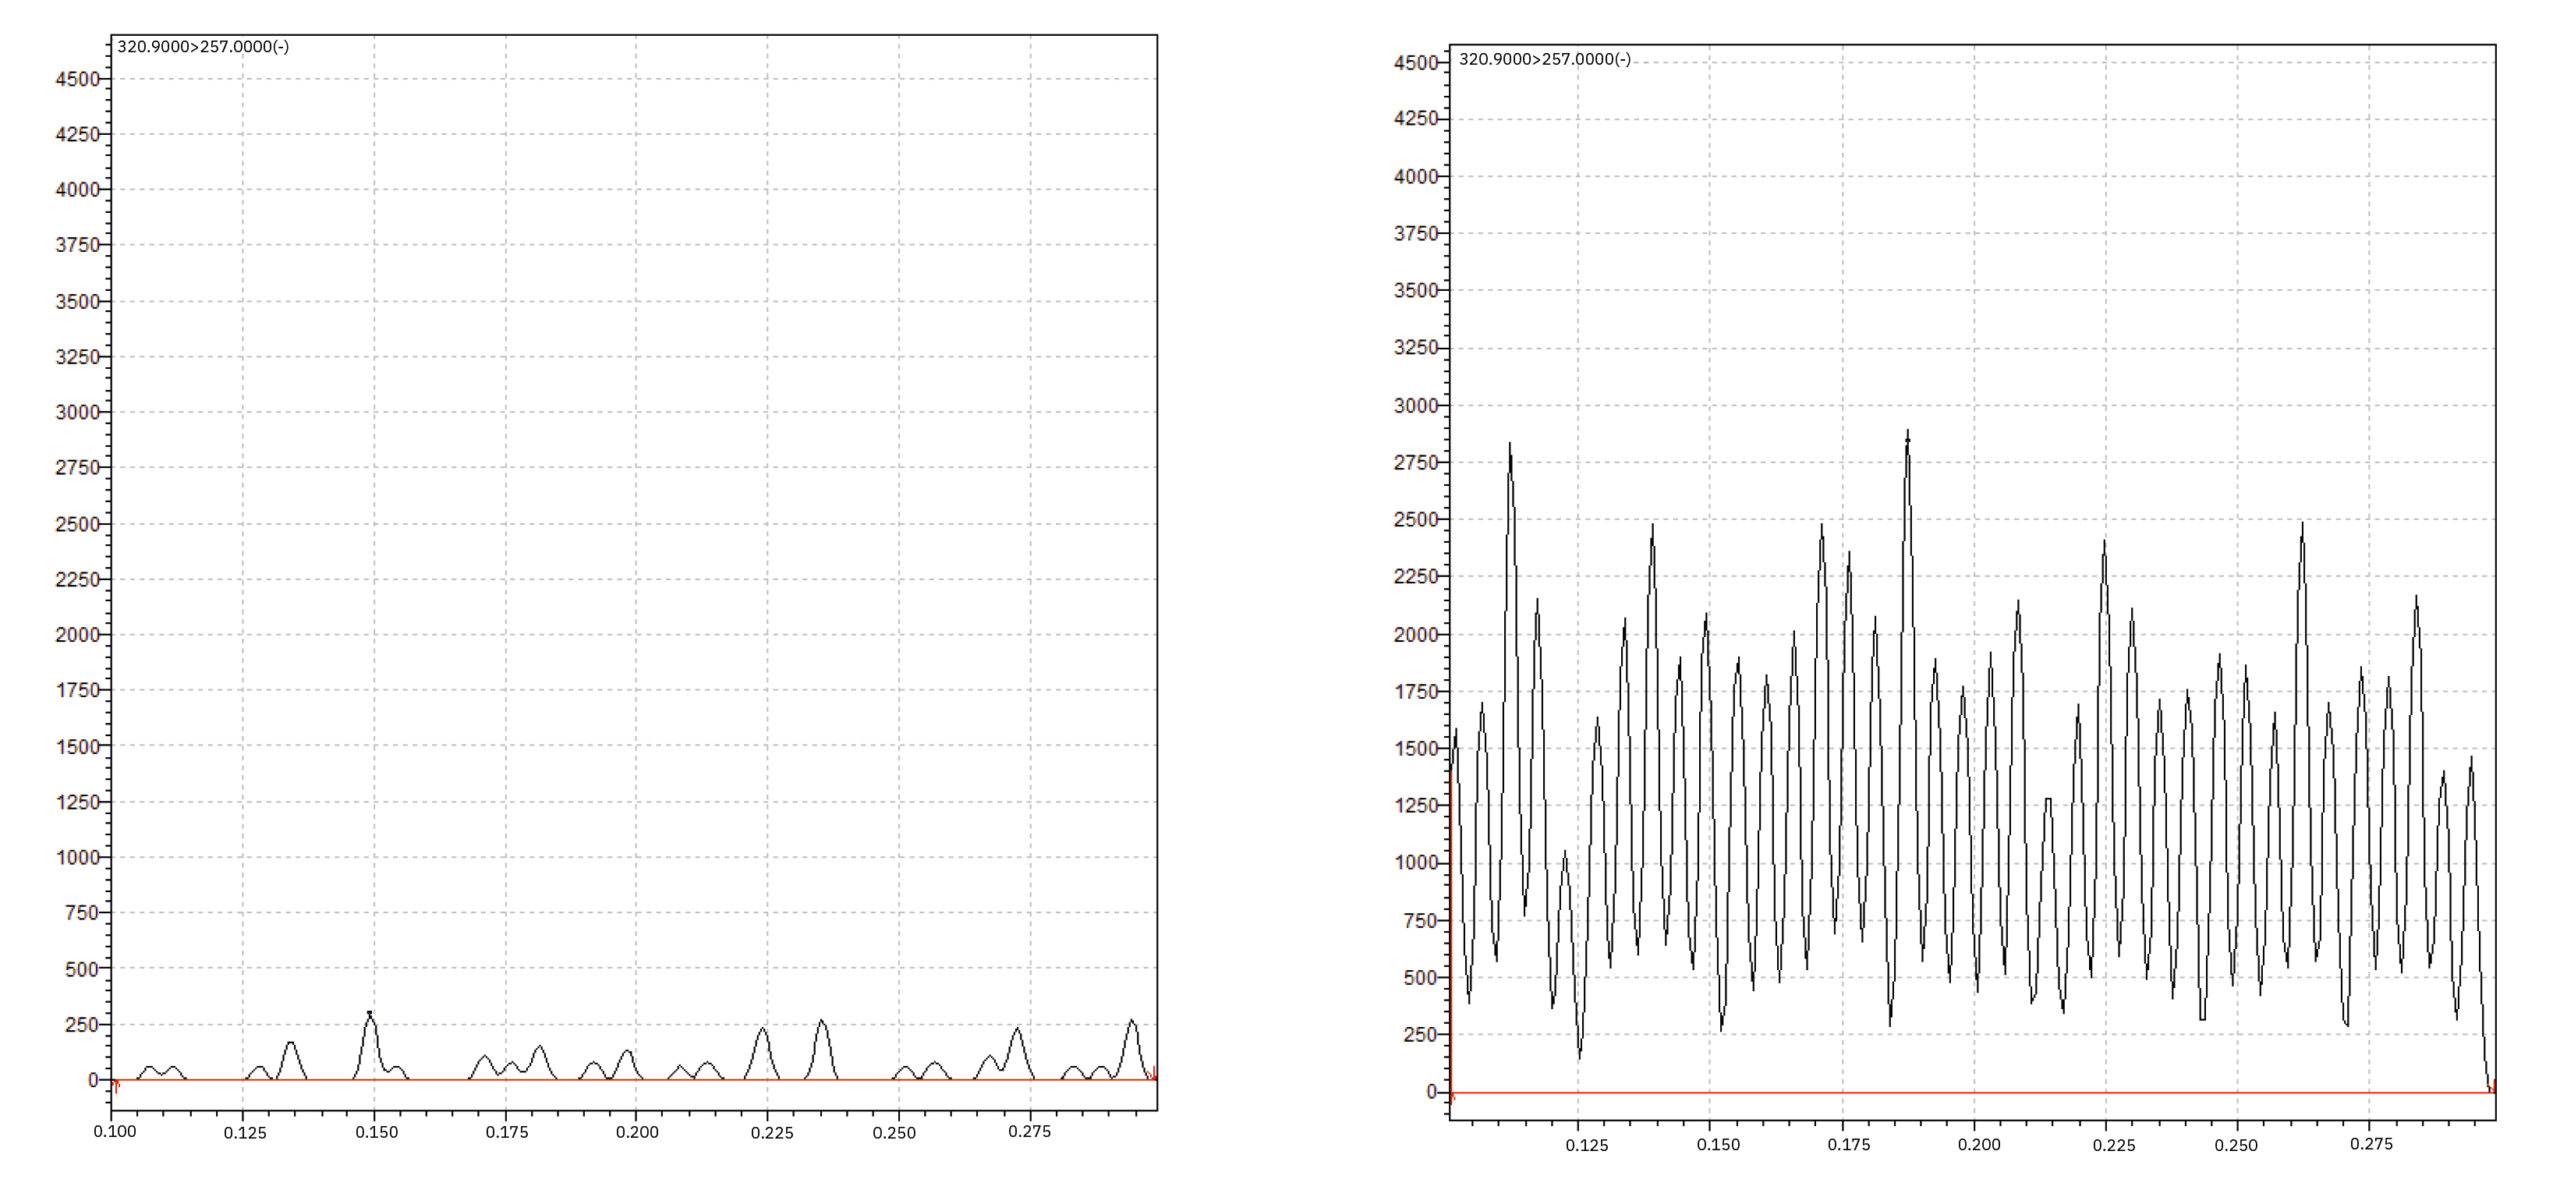
With respect to PESI-MS parameters, two key parameters can be configured in “PESI MS Solution” software: “Ionization outage time” is the amount of time that the probe stops in the ionization position during measurement and “Take sample outage time” is the amount of time that the probe stops in the sample-taking position during measurement. The sum of “Ionization outage time” and “Take sample outage time” represents the probe-moving cycle (Table 2). With respect to the data processing part, using PESI-MS results in a fundamentally different form of raw data. Instead of integrating one chromatographic peak, several tens of peaks must now be integrated. Each peak represents one spontaneous ionization by the PESI needle (Figure 5).
|
Type |
Event# |
+/- |
Compound Name m/z |
Time (0.000 min – 0.300 min) |
|
Q3 Scan |
1 |
+ |
10.0000:2000.0000 |
|
|
Q3 Scan |
2 |
– |
10.0000:2000.0000 |
|
|
MRM |
3 |
– |
CAP 320.9000 > 257.0000, 320. |
|
|
MRM |
4 |
– |
CAP d5 325.9000 > 262.0000, 3 |
|
|
MS Parameter |
Set value |
|
DL temperature |
250 °C |
|
Heat block temperature |
30 °C |
|
Dwell time |
10 ms |
|
Ionization voltage |
2 kV |
|
Q1 resolution |
Unit |
|
Q3 resolution |
Unit |
|
MRM chloramphenicol (Quantitation) |
321 > 257 |
|
MRM chloramphenicol (Confirmation |
321 > 152 |
|
MRM chloramphenicol d5 (Quantitation) |
326 > 262 |
|
MRM chloramphenicol (Confirmation) |
326 > 157 |
|
PESI parameter |
Set value |
|
Ionization outage time |
160 ms |
|
Take sample outage time |
50 ms |
Faster-flowing analysis
In addition to the potentially toxic effects that residual antibiotics in honey can elicit after consumption, antibiotics monitoring is part of a growing global concern concerning the unnecessary use of antimicrobials in agriculture. The latter has been associated with increasing frequency of drug-resistant infections, the mortality of which is expected to rise steeply during the next decades if no drastic measures are implemented. [5] Faster, simpler and easier sample analysis will help high-throughput laboratories around the world to better perform their essential work in keeping us all safe.
References
- S. Rizzo, M. Russo, M. Labra, L. Campone, L. Rastrelli, Determination of Chloramphenicol in Honey Using Salting-Out Assisted Liquid-Liquid Extraction Coupled with Liquid Chromatography-Tandem Mass Spectrometry and Validation According to 2002/657 European Commission Decision, Molecules, 2020, 25, 3481–3494.
- K. Hiraoka, K. Nishidate, K. Mori, D. Asakawa, S. Suzuki, Development of probe electrospray using a solid needle, Rapid Commun. Mass Spectrom., 2007, 21, 3139–3144.
- P.M. Da Silva, C. Gauche, L.V. Gonzaga, A.C.O. Costa, R. Fett, Honey: Chemical composition, stability and authenticity, Food Chem., 2016, 196, 309–323.
- L. Campone, A.L. Piccinelli, I. Pagano, S. Carabetta, R. Di Sanzo, M. Russo, L. Rastrelli, Determination of phenolic compounds in honey using dispersive liquid-liquid microextraction, J. Chromatogr. A, 2014, 1334, 9–15.
- Tackling drug-resistant infections globally: Final report and recommendations: The review on antimicrobial resistance, chaired by J. O’Neill.
- P. Griffeuille, S. Duleaurent, S. Moreau, F. Saint-Marcoux, Driving under the influence of drugs: PESI for the measurement of illicit drugs in saliva, The column, 2021, 17, 13–17.
- P. Griffeuille, S. El Balkhi, S. Bodeau, F. Lamoureux, P. Marquet, S. Duleaurent, F. Saint-Marcoux, Ultrafast measurement of metformin in the clinical setting using Probe Electrospray Ionization Mass Spectrometry, J. Anal. Toxicol., 2022, 00, 1–7.