Turning
thousands of
puzzle pieces
into a clear
picture
Developing successful methods
for complex sample analysis
Dr. Martin Meyer, Shimadzu Europa GmbH

Modern high-performance liquid chromatography (HPLC) is the preferred technique for analyzing complex samples. Its range of applications is remarkably broad – from determining the composition of food products to detecting unwanted impurities in pharmaceuticals, and even identifying trace levels of contaminants in drinking water. For every new question, a tailored separation method must be developed – a process much like piecing together an intricate puzzle. By following a systematic approach, what begins as a maze of endless possibilities gradually takes shape until the full picture emerges.
Structured approach for faster results
If you’ve ever worked on a tricky puzzle, you know that – to solve one that’s truly grand, you always need a careful plan. It’s the same when it comes to developing a separation method. Much like starting a puzzle by selecting the pieces with the most obvious differences – corners, edges or brightly colored sections – you start by defining the framework and examining which parameters are even feasible. The foundation is a three-step approach: screening, data evaluation, optimization.
Systematic screening: Column, mobile phase, solvent
Sorting and preselecting the puzzle pieces: It makes sense to start with a rough screening to narrow down the options before getting lost in the details. A key element is the column, which should be chosen based on the properties of the compound you’re analyzing.
C18 columns are often the first choice, as they’re suitable for nonpolar to moderately polar organic compounds, covering a wide range of substances. Highly polar compounds, on the other hand, are best separated using polar columns such as amino or silica columns. An interesting alternative is the HILIC method (Hydrophilic Interaction Liquid Chromatography), which is particularly suited for highly polar compounds.
Shimadzu’s Shim-pack G series is a great starting point since its range of columns includes 15 different stationary phases designed to address diverse applications. This variety makes it easier to tailor the column selection to the specific requirements of the sample.
Besides the column, the choice of the mobile phase is equally important. The composition of the mobile phase influences not just retention but also peak shape and the reproducibility of the method. Additives such as acids and bases can greatly improve separation performance, while buffered solutions help maintain a stable pH environment. The pH value is especially important for ionizable compounds. Columns with high pH resistance, such as the Shim-pack Scepter series, offer maximum flexibility since they can be used across a pH range of 1 to 12.
Shimadzu also offers various method development column kits that make column selection for method development particularly easy.
Selecting the right solvent is another important step. Acetonitrile often allows for faster methods and sharper peaks, while methanol is more environmentally friendly.
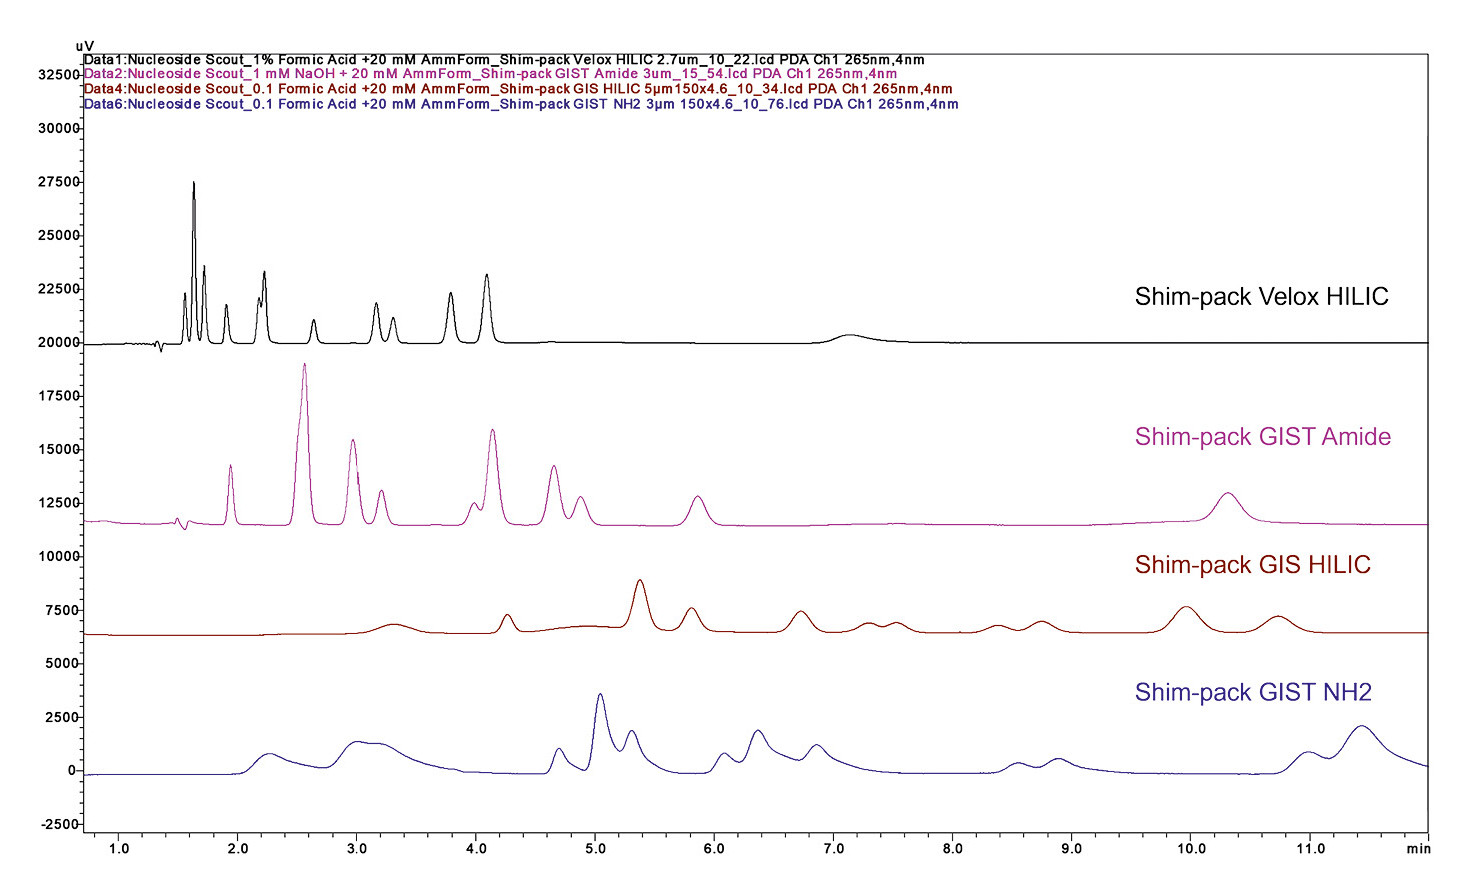
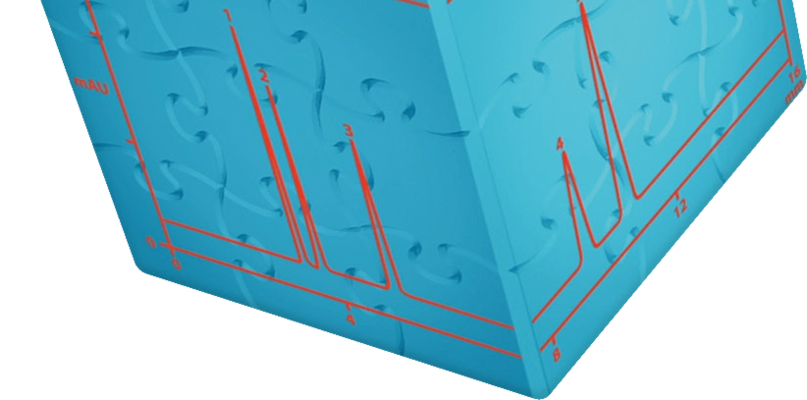
Screening should be performed either isocratically, with constant solvent ratios, or using a simple linear gradient that transitions from mostly aqueous to mostly organic mobile phase. This ratio would be reversed with a HILIC method (Figure 1).

Method development tools: Supported by modern software
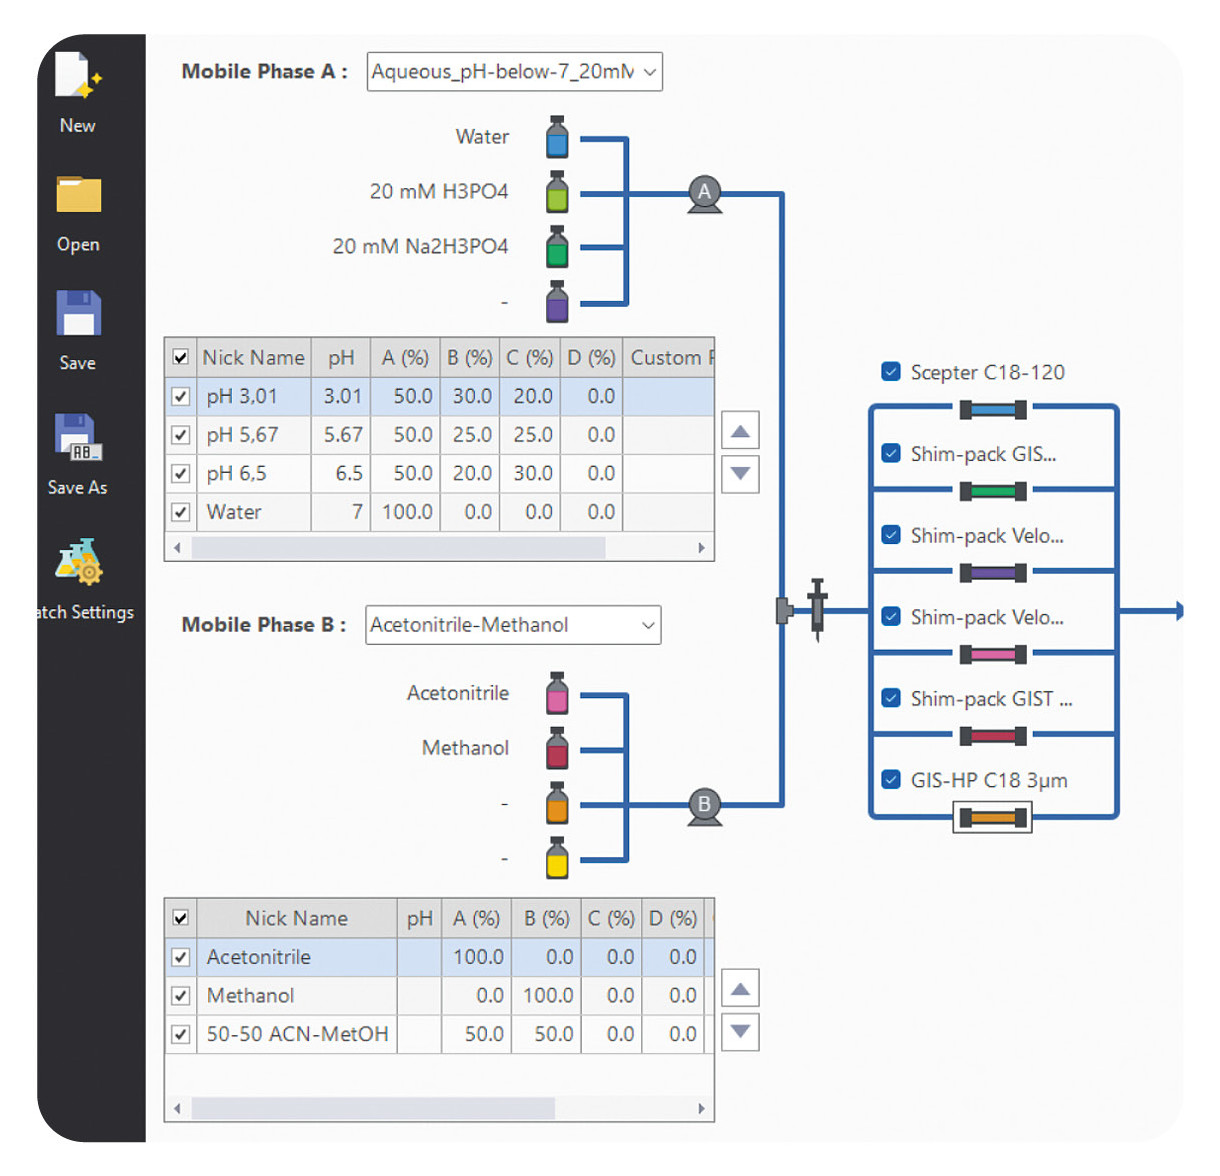
Bring helpers on board: Getting the right support can save both time and resources. This is where LabSolutions MD steps in. This software solution, designed specifically for method development, automates the process, making it much simpler. With the software, various columns and mobile phases can be combined and method parameters adjusted in just a few simple steps. The software then automatically generates a batch that can be measured immediately (Figure 2).
When combined with a Method Scouting System, it offers even greater flexibility. Up to eight solvents and twelve columns can be used in one single setup. In this way, a wide range of combinations can be tested without manually changing the hardware. This not only saves time but also creates structure and makes the process more systematic and reproducible.
| Response | |||
| Minimum resolution |
Peak count |
Separated peak count |
Evaluation val |
| 0.333 | 12 | 5 | 346.938 |
| 0.282 | 12 | 5 | 324.437 |
| 0.318 | 10 | 5 | 274.349 |
| 0.3 | 10 | 5 | 266.437 |
| 0.232 | 9 | 5 | 242.192 |
| 0.291 | 8 | 5 | 208.444 |
| 0.141 | 8 | 5 | 208.195 |
Data analysis: Systematic evaluation of screening results
Defining the framework: Data gathered during screening are key to identifying the best separation conditions. To efficiently evaluate the many measurements, the Method Development System provides an easy-to-use interface that’s perfect for analyzing screening data. The software evaluates the chromatographic results based on several criteria: The focus is on peak resolution, the number of separated peaks and the total number of detected peaks. The combined metric called the “Evaluation Value” is particularly helpful here. It multiplies the number of separated peaks by the resolution. This way, the best separation conditions can be identified at a glance, without the need to review each chromatogram individually (Table 1).
Optimization: From preselection to the optimal gradient
With the puzzle framework now set in place, related groups are formed: The screening results provide the foundation for the next step – optimizing the method, involving a targeted preselection of columns and mobile phases. This reduces the number of variables, allowing the method to be more effectively fine-tuned.
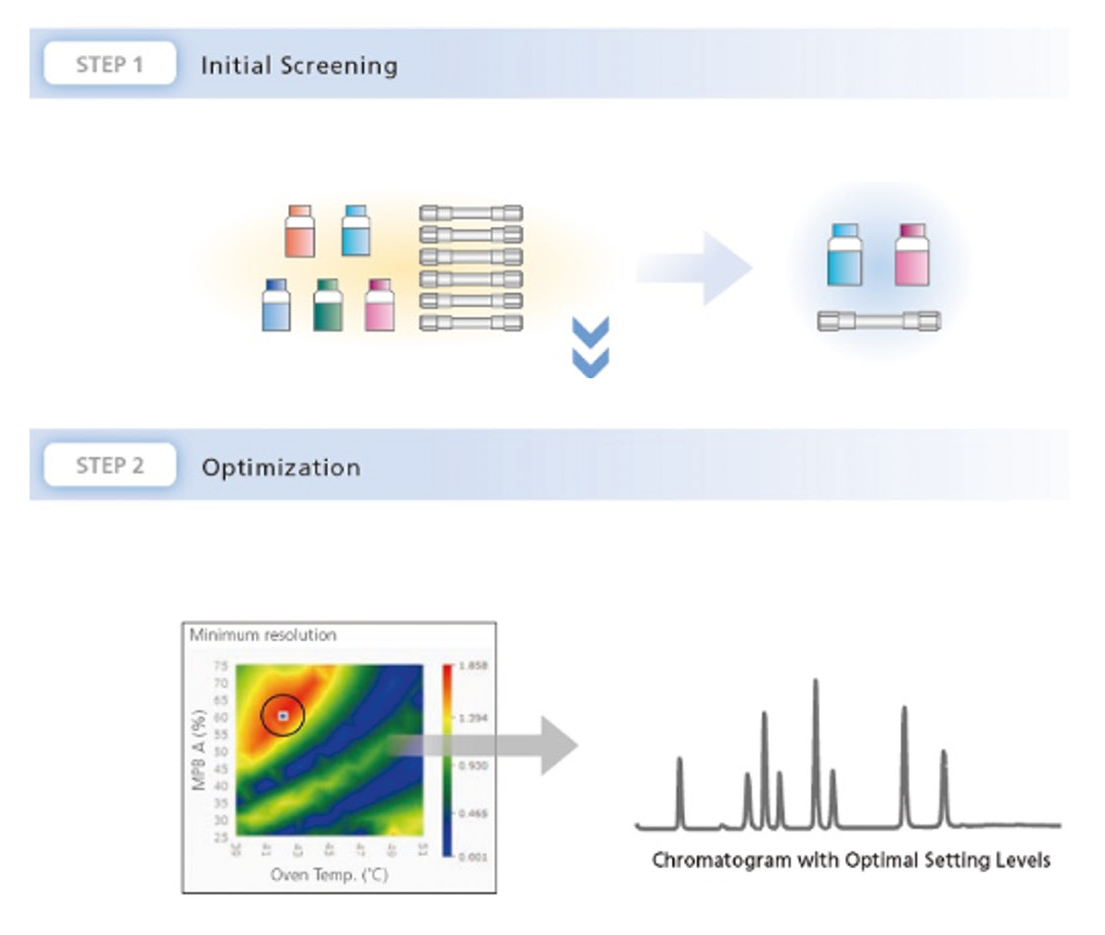
Now, parameters such as temperature, flow rate, injection volume and gradient conditions are systematically varied. As retention times shift accordingly, the software gathers data to build a precise model of the separation. For the model to be successful, the software needs to correctly identify which signals correspond to each component. LabSolutions MD offers a range of matching criteria to help with building the model. This makes it possible to simulate how method changes will affect outcomes without having to test every variation in the lab (Figure 3).
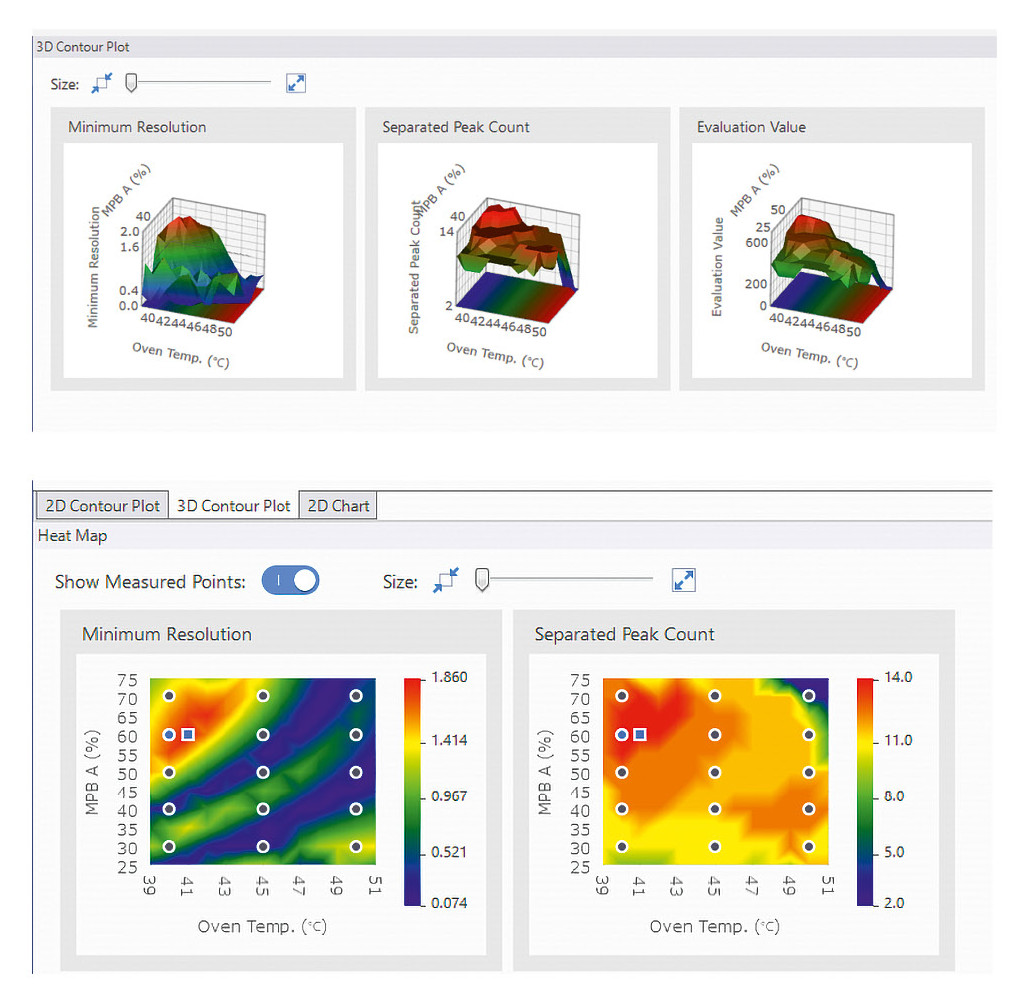
Now it’s time to fit the final missing pieces exactly where they belong: By comparing parameters, the ideal separation conditions can be identified. The software provides a variety of graphs and interface tools to support this process (Figure 4).
An optimized gradient can also be calculated, whether prioritizing the fastest possible separation or the best possible resolution, depending on the requirements of the analysis. This step doesn’t just save time but also ensures maximum method efficiency (Figure 5).
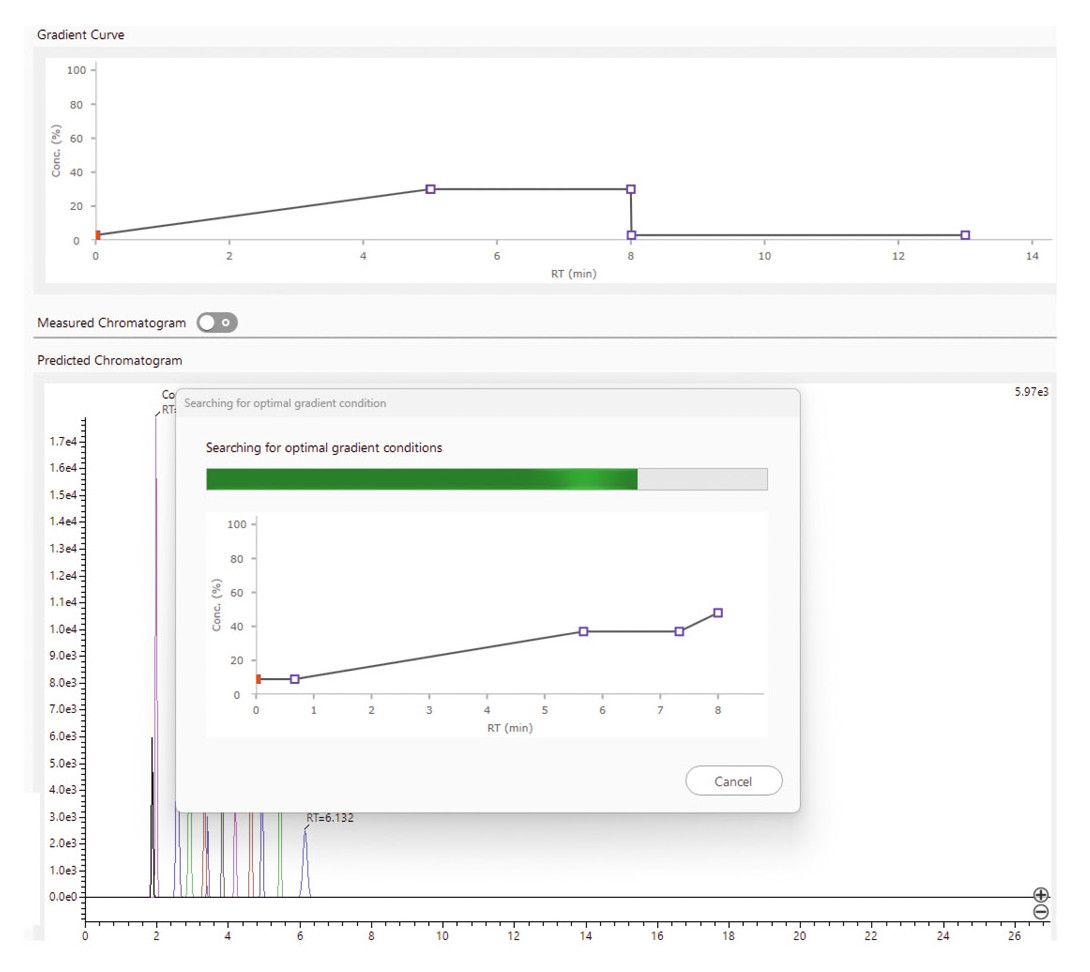
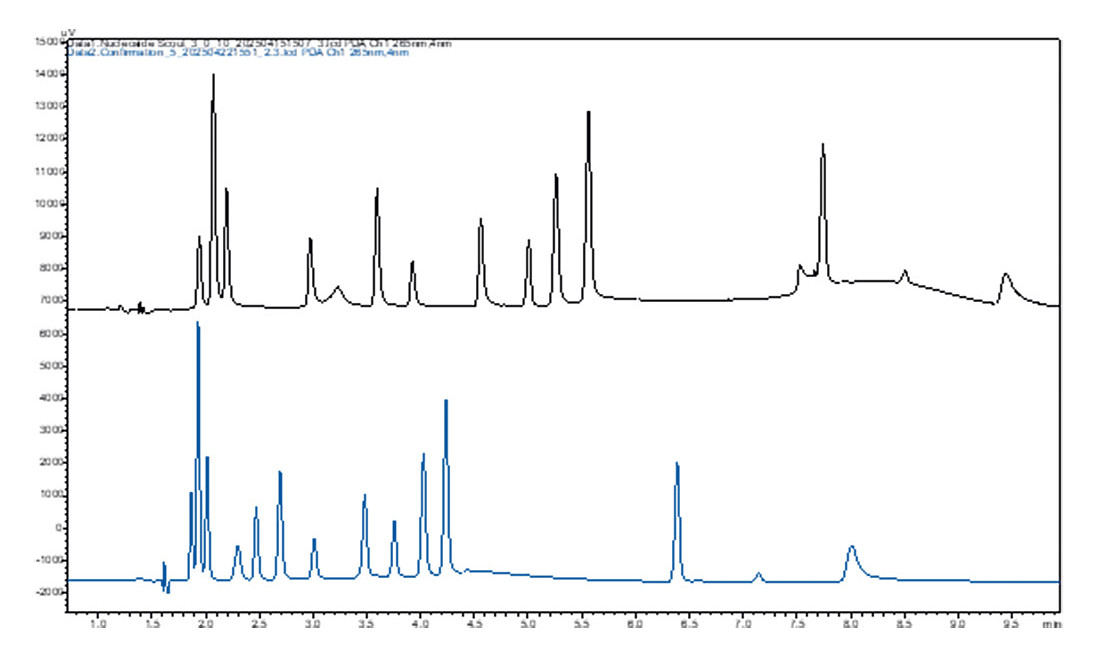
Once the optimal gradient is calculated, the software performs automatic confirmation measurements to verify the model’s predictions. If the results don’t meet expectations, the software adjusts the conditions and repeats the measurements (Figure 6).
The combination of model-based optimization and automated monitoring ensures that the developed method is not only precise and reproducible but also perfectly tailored to the specific requirements of the analysis. This approach is especially valuable when it comes to separating complex samples since it offers high flexibility and efficiency.
Choosing the right parameters in method development is much like locking in the first crucial puzzle pieces – once those are figured out, the rest falls into place much more easily. Modern software, systems and columns make this very step easier, streamline the screening process and ensure reproducible results. Building on this, model-based optimization precisely tailors the method to the specific question at hand. In the end, all the pieces fit together to form a clear picture: This is how even the most complex analytical challenges can be reliably mastered. Job done – puzzle solved.