Raising the profile of what we drink – and eat
Improving the analysis of amino acids by an automatic pre-column derivatization method
Natsuki Iwata, Shimadzu Corporation
Vadim Kraft, Shimadzu Europa GmbH
Testing food and drink for safety, authenticity, quality and nutritional content is vital to maintaining public health, consumer confidence and business success. A recent proof-of-concept experiment on alcoholic beverages confirmed a streamlined new method for amino-acid assessment that is applicable to other food and drink as well. The method delivers increased accuracy while reducing testing runtimes by up to half.
We’ve all seen the stories: the 100 % ground beef that contained horsemeat, the fake fruit juice, the expensive branded whisky that was counterfeit, the adulterated honey. Or the 2009 scandal where melamine was added to milk and infant formula to make them appear richer in protein … and which tragically led to illness and death.
The safety and quality of the things we eat and drink is such a foundational concept of modern life that we often take it for granted. And we assume that what the label claims – about ingredients or nutritional content – is an accurate reflection of the actual contents. Most of the time, all is well. We have laws, regulations, ethical practices and professionals of various kinds who together ensure that consumers know what they are getting, and that it is safe for them to consume. And, because science and technology are always improving, regulations are constantly updated, and responsible businesses adapt to meet those ever-higher standards.
Food and beverage testing helps ensure that regulatory standards are met. Amino-acid testing is one of more sophisticated tools that scientists use to check the quality, safety and authenticity of what we eat and drink, as well as to assess the quantities of various components – protein, for example – for trustworthy nutritional labeling. Amino-acid assessment provides reliable identification – a sophisticated fingerprint – that reveals whether a food product contains what it is supposed to. Inferior, dangerous or simply incorrect ingredients or even the improper mixture of the right ingredients can be accurately identified by amino-acid testing and helps to support health, business success and consumer contentment.
Natsuki Iwata works in Kyoto, Japan, and is an expert in the field of amino-acid testing using high-performance liquid chromatography (HPLC), with numerous related patents, awards and publications. She recently conducted an experiment using amino-acid profiling on alcoholic beverages.
Amino acids and their uses
Amino acids exist as two mirror-image forms, known as D- and L-enantiomers. While L-amino acids are most abundant in biological systems, D-amino acids have recently garnered interest for their effects on food taste, preservation and their emerging role as disease biomarkers.[1] D-amino acids offer distinctive flavor characteristics compared to their L-forms; for example, D-leucine and D-phenylalanine impart a sweet flavor, while the corresponding L-forms are perceived as bitter. The specific balance of D- and L-amino acids in foods contributes to the overall complexity of taste.
Once considered biologically inactive, D-amino acids have also now been shown to play specific physiological roles in humans and other organisms, such as supporting gut health and influencing metabolism, though research in this area is ongoing. The ratio of D- to L-amino acids in foods is also useful for evaluating processing techniques and product authenticity, particularly in fermented or aged foods.
Accurately separating and measuring D- and L-amino acids is therefore important – increasingly so –in food science and clinical applications. But traditional analysis methods such as liquid chromatography-mass spectrometry (LC-MS) and multi-dimensional HPLC have limitations. LC-MS may be affected by sample matrix complexities, for instance, and multi-dimensional systems can be time-consuming and complicated to operate. So there is a clear need for analytical techniques that are fast, straightforward and reliable for D/L-amino acid quantification.
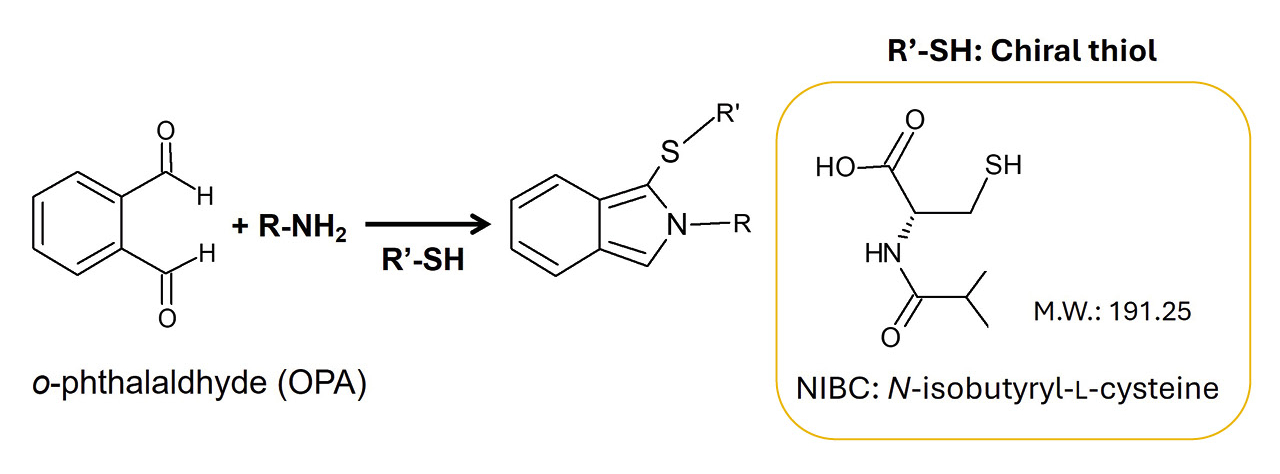
The method investigated in Natsuki Iwata’s study was based on a derivatization reaction of o-phthalaldehyde (OPA) and the chiral thiol N-isobutyryl-L-cysteine (NIBC), followed by analysis using liquid chromatography. The pioneering work in this area was done by Euerby et al. in the late 1980s. [2–7] In those studies, different chiral thiols were synthesized and investigated after manual derivatization with OPA on a reverse phase of HPLC allowing the separation of D- and L-enantiomers of several amino acids.
Can better technology lead to better methods?
Acutely aware of the great evolution in liquid chromatography in recent years, Natsuki Iwata reasoned that state-of-the-art UHPLC (Ultra HPLC) instruments should enable fully automatic derivatization and highly efficient separation of compounds. So that is what she set out to test.
Two kinds of beer (beer A and B), sake, red wine and white wine were used as samples. Beer A and beer B were ale type (top fermenting) and lager type (bottom fermenting), respectively. Beer A, beer B, red wine and white wine were diluted ten-fold (twenty-fold for sake) with 10 mmol/L hydrochloric acid and then passed through 0.2 μm PTFE membrane filters.

| 1 |
OPA regent Add 0.3 mL of ethanol into 10 mg of o-phthalaldehyde and dissolve completely. Then add 0.7 mL of 0.1 mol/L borate buffer (ph 9.1) and 4 mL of ultra-pure water. |
| 2 |
NIBC solution Add 10 mg of N-isobutyryl-l-cysteine into 10 mL of 0.1 mol/L borate buffer (pH 9.1). |
| 3 |
OPA/NIBC solution Mix equal volume of OPA reagent and NIBC solution. |
Careful preparation is essential
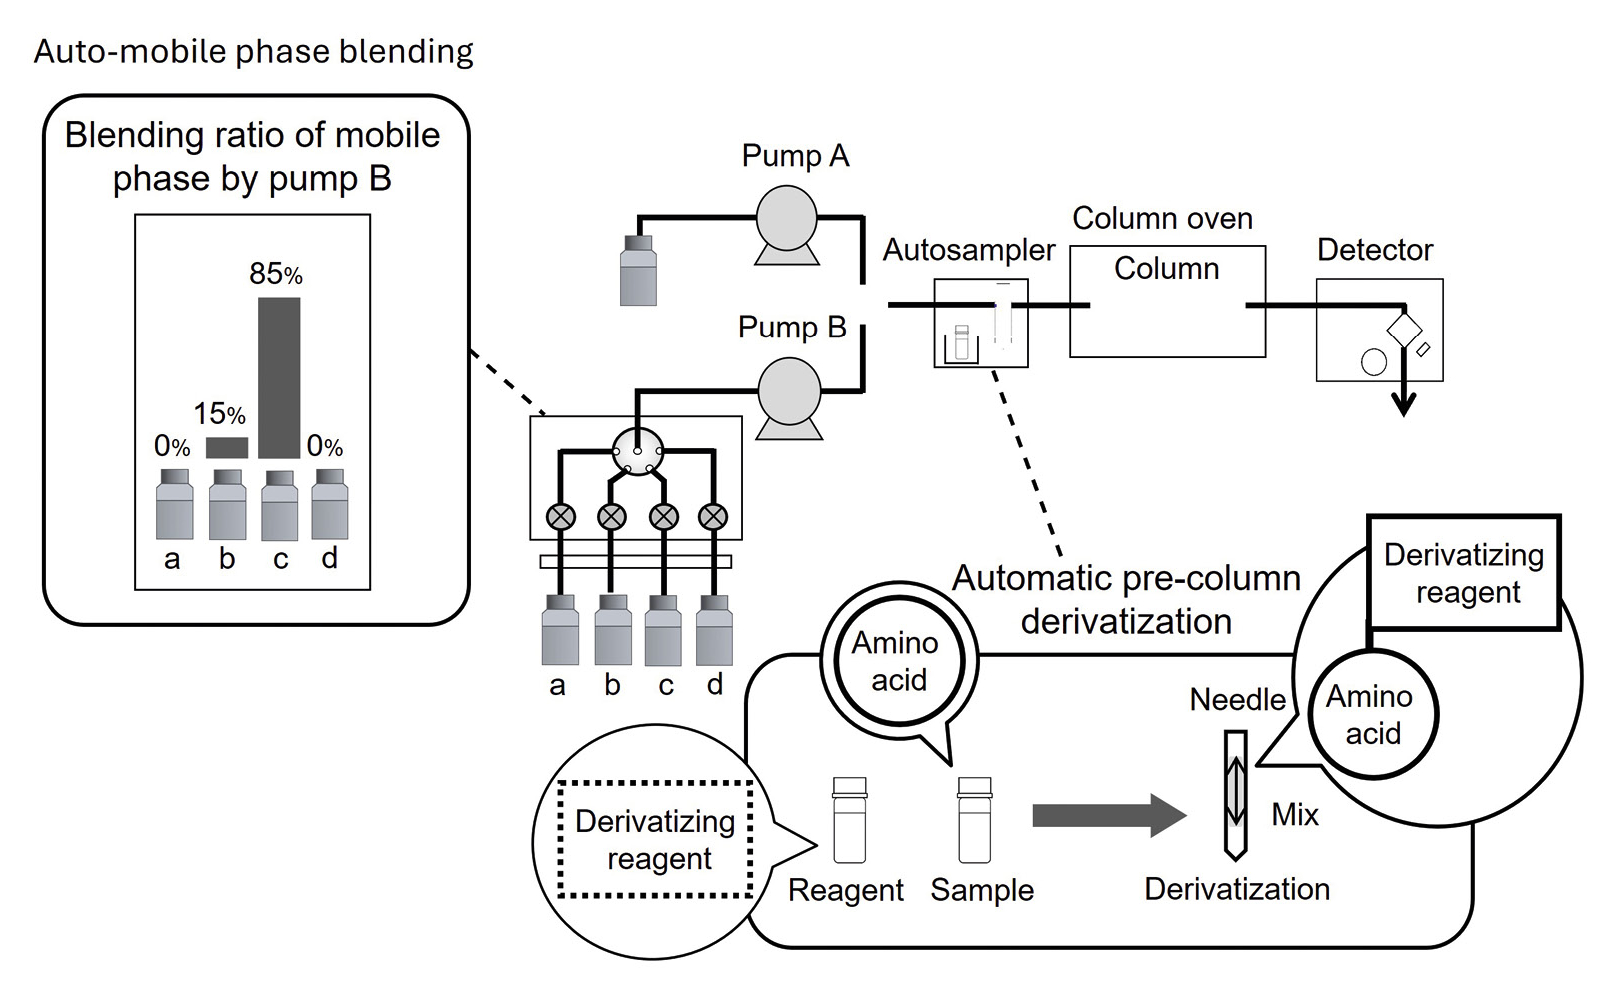
Fluorescence derivatization of the diastereomers was performed by the reaction with OPA under NIBC conditions. A standard (Shimadzu) UHPLC instrument equipped with a fluorescence detector was used for determination of 37 D/L-amino acids (Figure 2), and the eMSTAT – Shimadzu’s Easy Mass Spectrometric Statistical Solution – was applied for principal component analysis (PCA). The analytical conditions are presented in Table 2. Tables 1 and 3 show the details to the preparation of the reagents and the derivatization procedure of the autosampler.
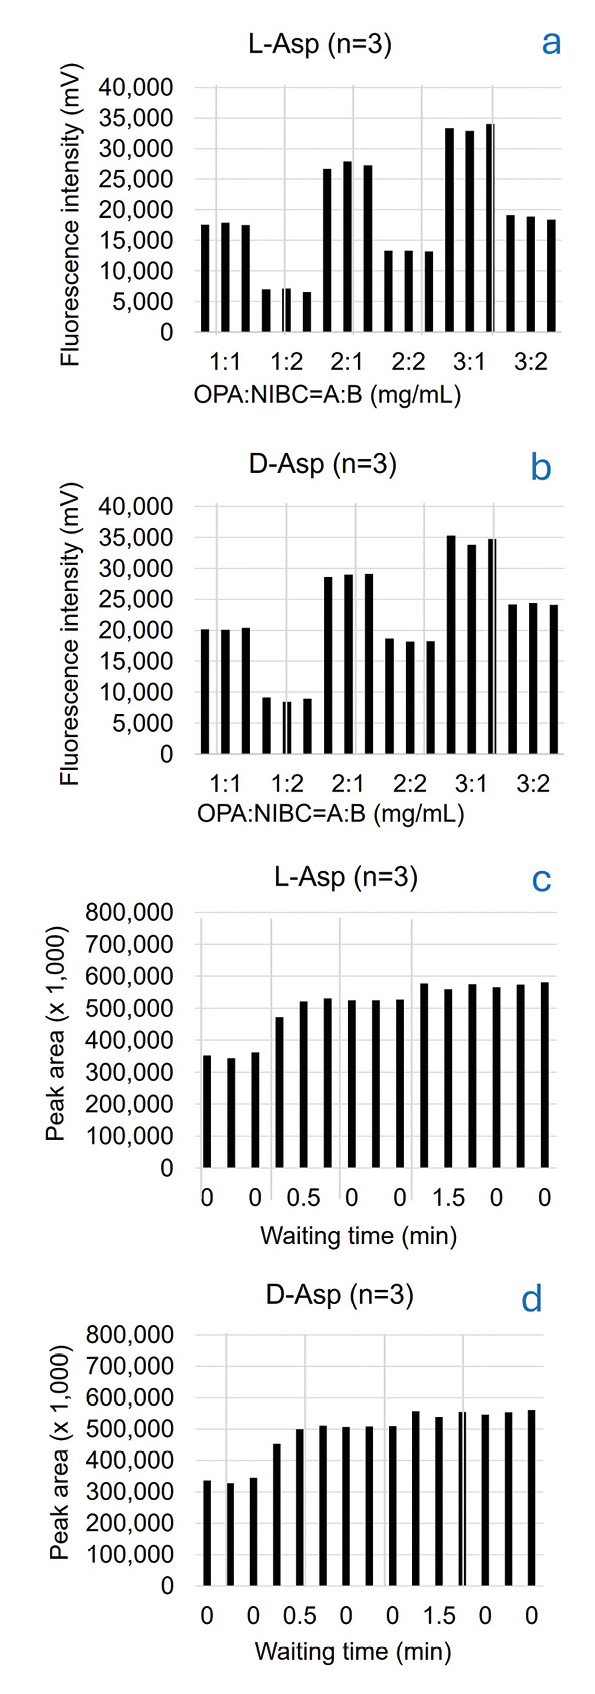
The optimum combination in concentration of the OPA reagent and NIBC solution was examined using a standard solution of D/L-amino acids (1 μmol/L each). Six combinations of varying concentrations were investigated. The fluorescence intensities of D/L-Asp raised with increasing OPA concentration in a constant NIBC concentration. On the other hand, the fluorescence intensities of D/L-Asp decreased with increasing NIBC concentration in constant OPA concentration. The combination of 3 mg/mL for OPA and 1 mg/mL for NIBC elevated the column back pressure, possibly due to clogging. Therefore, the combination of 2 mg/mL for OPA and 1 mg/mL for NIBC was adopted as the optimum concentration (Figure 3a and 3b).
To promote the derivatization reaction and obtain good repeatability, a constant waiting time after mixing the OPA/NIBC solution and the sample within the injection needle of the autosampler was introduced into the pretreatment program. Five different waiting times were examined in advance. As the peak area was constant after 1.5 minutes or more, the waiting time was set to 1.5 minutes (Figure 3c and 3d).
Putting the method to the test: Analysis of a standard solution of 37 D/L-amino acids
A previously reported method with two switching conditions required an analysis time of 120 minutes per sample.[8] In that method, two chiral thiols of N-acetyl-L-cysteine (NAC) and NIBC were independently applied for the reactions. Their products with amino acids were separated and the results from both chromatograms were combined, with a total analysis time of 60 minutes each.
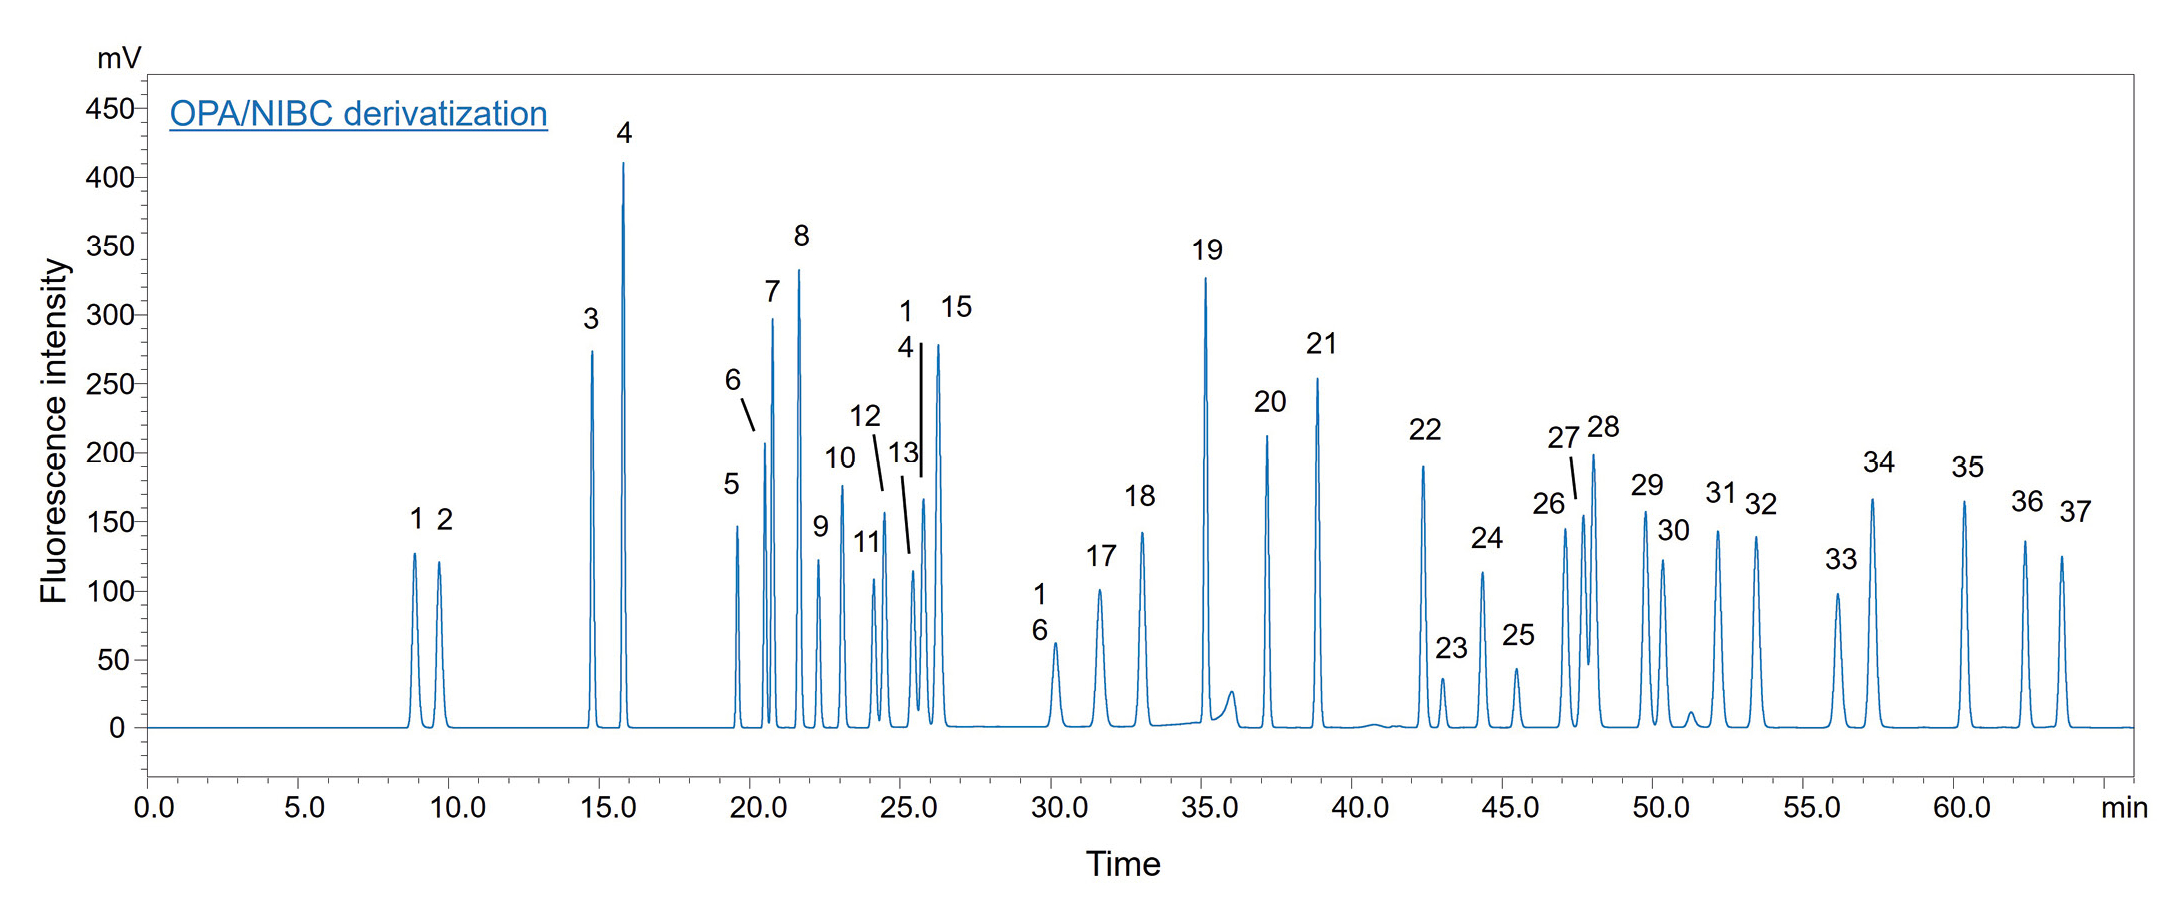
For her work, however, Natsuki Iwata decided to use NIBC alone for the reaction. By increasing the methanol ratio in the mobile phase, setting the column temperature to 20 °C and separation on a unique column, it was possible to separate all 37 diastereomers of D- and L-amino acids in a single analysis within just 66 minutes (Figure 4), cutting overall analysis time almost in half. An overview of the separated amino acids is provided in Table 4. Table 5 shows the description of abbreviations of amino acids.
| System | NexeraTM X3 |
| Column |
CERI L-column3 C18 (150 mm x 2.1 mm I.D., 2.0 µm) using pre-column filter |
| Flow rate | 0.22 mL/min |
| Mobile phase |
[Pump A] 10 mmol/L (sodium) phosphate buffer (pH 6.9) [Pump B] B) Acetonitrile, C) Methanol B/C = 15:85 using mobile phase blending function |
| Time program | Gradient elution |
| Column temp. | 20 °C |
| Injection volume | 1 µL |
| Detection | FL Ex: 338 nm, Em: 455 nm |
| 1 | OPA/NIBC solution 2 µL |
| 2 | Sample µL |
| 3 | Mix |
| 4 | Wait 1.5 minutes |
| 5 | Injection |
| 1 | L-Asp | 20 | L-Tyr |
| 2 | D-Asp | 21 | D-Tyr |
| 3 | L-Glu | 22 | L-Val |
| 4 | D-Glu | 23 | L-(Cys)2 |
| 5 | L-Asn | 24 | L-Met |
| 6 | D-Asn | 25 | D-(Cys)2 |
| 7 | L-Ser | 26 | L-Trp |
| 8 | D-Ser | 27 | D-Met |
| 9 | L-Gln | 28 | D-Val |
| 10 | D-Gln | 29 | L-Ile |
| 11 | L-His | 30 | L-Phe |
| 12 | L-Thr | 31 | D-Trp |
| 13 | D-His | 32 | D-Phe |
| 14 | D-Thr | 33 | L-Leu |
| 15 | Gly | 34 | D-Ile |
| 16 | L-Arg | 35 | D-Leu |
| 17 | D-Arg | 36 | L-Lys |
| 18 | L-Ala | 37 | D-Lys |
| 19 | D-Ala |
| Asp | Aspartic acid |
| Glu | Glutamic acid |
| Asn | Asparagine |
| Ser | Serine |
| Gln | Glutamine |
| His | Histidine |
| Thr | Threonine |
| Gly | Glycine |
| Arg | Arginine |
| Ala | Alanine |
| Tyr | Tyrosine |
| Val | Valine |
| (Cys)2 | Cystine |
| Met | Methionine |
| Trp | Tryptophan |
| Ile | Isoleucine |
| Phe | Phenylalanine |
| Leu | Leucine |
| Lys | Lysine |
Validating the method
The relative standard deviations (%RSD, n = 6) of the peak areas for a standard mixture of D/L-amino acids (0.1 μmol/L each) were 1.6 % or less, indicating excellent repeatability. This high level of consistency was achieved through the automatic pre-column derivatization, which ensured a constant derivatization time. Calibration curves for all 37 D/L-amino acids demonstrated good linearity, with coefficients of determination (r²) of 0.999 or higher. For recovery testing, beer B was selected and spiked with a standard solution containing 31 D/L-amino acids. The final concentration was set to 1 μmol/L for most amino acids. Six amino acids were instead adjusted to a final concentration of 10 μmol/L each. The six samples were simultaneously pretreated following the established pretreatment protocol. The recovery rates ranged from 84.9 % to 108.6 %, with %RSD values between 0.8 % and 9.5 %, demonstrating the method’s reliability and accuracy.
Applying the method to alcoholic beverages
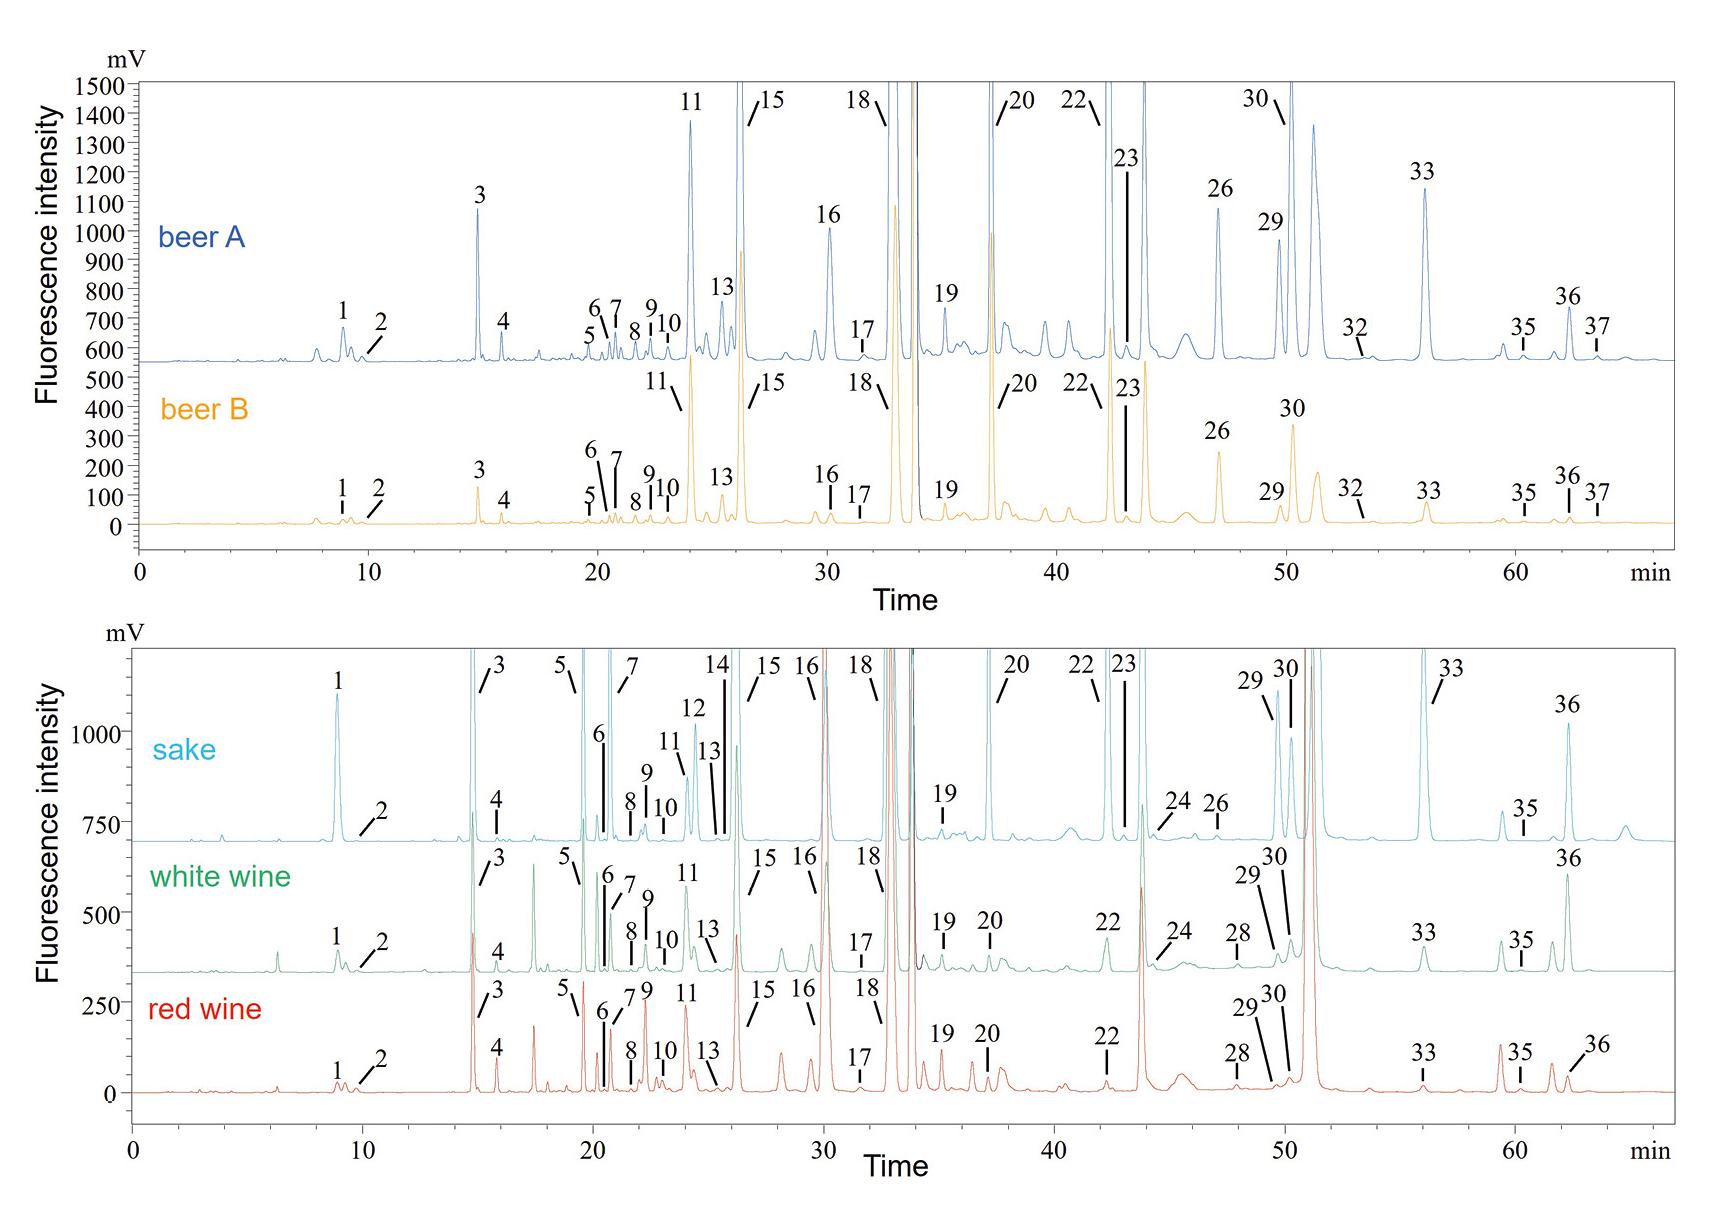
As shown in Figure 5, 25 to 28 amino acids were separated and detected in five samples. The overall ratio of D-amino acid to D/L-amino acid (%D) was found to be 6 % or less in all samples. The determination results of D/L abundance ratios of specific amino acids were close to those of the previous studies, using HPLC [9] and GC-MS [10] for various real-sample analyses. For details to quantification results, refer to publication.
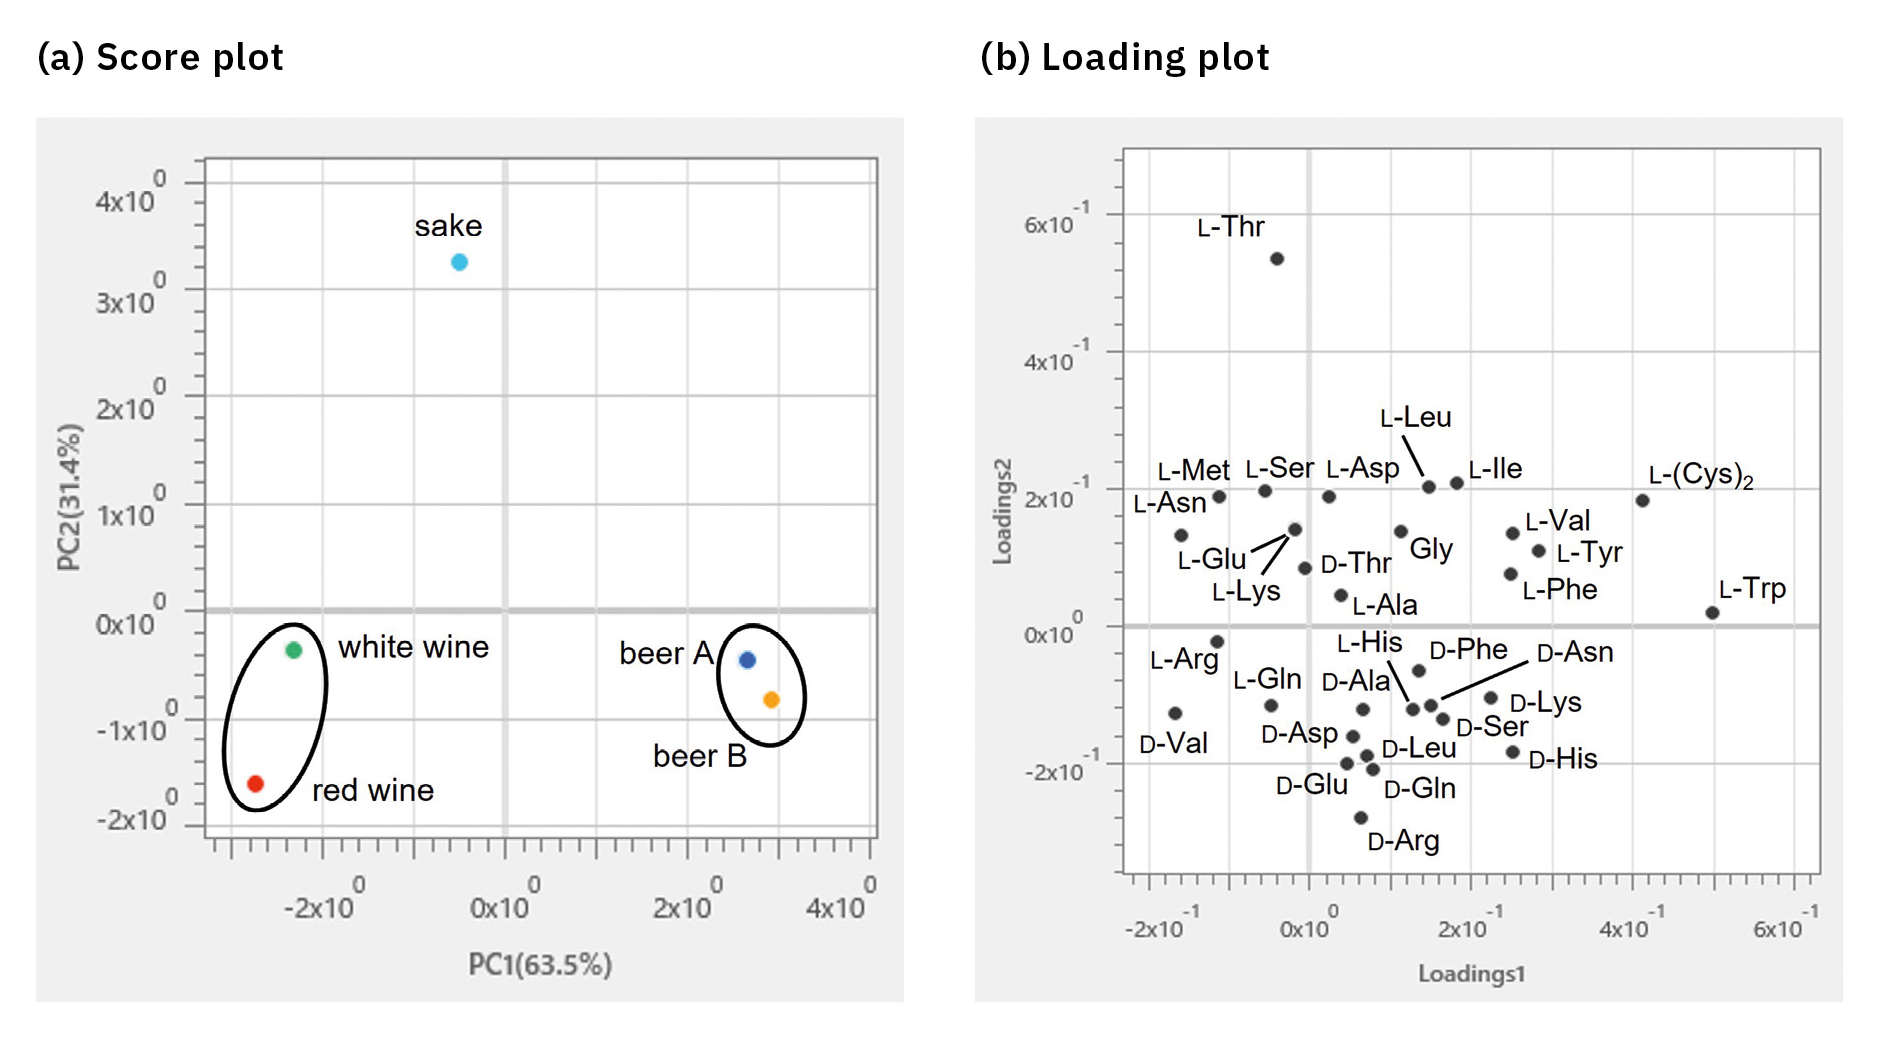
A PCA was performed using the content of each compound (n = 4) in beverages (Figure 6). As a result of the PCA, beer A and beer B were plotted close together on the score plot as well as red and white wines. It was also found that sake showed different characteristics from these beverages. The loading plot revealed that the two kinds of beer as well as the red and white wines contained many D-isomers, while the sake was rich in L-isomers. In particular, L-Trp, D-His and D-Lys contributed significantly to the two kinds of beer, D-Val to the red and white wines and L-Thr to the sake. This suggested that the first principal component (PC1) showed differences in the types of beverages, while the second principal component (PC2) revealed differences in the isomers.
The road to better results
A new method has been developed for the simultaneous separation of 37 OPA/NIBC-derivatized D- and L-amino acids using a straightforward UHPLC system. This method achieves processing results in about half the time required by conventional techniques via a single analysis with automated sample handling and streamlined data.
By optimizing the derivatization reaction, this new method ensures sensitive, accurate and precise quantification of all target compounds. In tests with real beverage samples, the amino acids of interest were effectively separated from contaminants. Besides, it demonstrates strong potential for application in alcoholic beverage profiling and, by extension, for widespread use throughout the entire food and beverage industry.
Rising consumer expectations and greater regulations can now be matched by a highly accurate and reliable, more efficient method for analyzing amino acids, reducing processing time and improving quality control and profiling in the food and beverage industry. It was made possible by progress in technology and by the dedicated curiosity of experts such as Shimadzu’s Natsuki Iwata.
[1] Iwata, N., Kobayashi, M. (2024). Chromatography. 45 (2): 63–72.
[2] Euerby, M.R., Partridge, L.Z., Gibbons, W.A. (1989). Journal of Chromatography A. 483: 239–252.
[3] Euerby, M.R., Partridge, L.Z., Rajani, P. (1988). Journal of Chromatography A. 447: 392–397.
[4] Euerby, M.R., Nunn, P.B., Partridge, L.Z. (1989). Journal of Chromatography A. 466: 407–414.
[5] Euerby, M.R., Partridge, L. Z., Nunn, P.B. (1989). Journal of Chromatography A. 469: 412–419.
[6] Euerby, M.R. (1988). Journal of Chromatography A. 454: 398–405.
[7] Euerby, M.R., Partridge, L.Z., Gibbons, W.A. (1988). Journal of Chromatography A. 445: 433–440.
[8] Iwata, N., Watabe, Y., Horie, S., Hayakawa, Y. (2021). Chromatography. 42: 133–141.
[9] Jin, D., Miyahara, T., Oe, T., Toyo’oka, T. (1999). Anal. Biochem. 269: 124–132.
[10] Ali, H.S., Pätzold, R., Brückner, H. (2010). Amino Acids. 38: 951–958.