The perfect taste where sweet meets sour
HPLC methods for identifying and quantifying sugars and organic acids in tonic water and gin
Dr. Brigitte Bollig, Shimadzu Europa GmbH
This article provides a detailed description of the application of HPLC analysis for determining sugars and organic acids – in tonic water especially. By analyzing these components in detail, insight into the factors that influence the taste and quality of a gin and tonic can be gained.
The gin and tonic: a refreshing beverage with a history as long as the glass it’s served in [1] that’s hugely popular across the world. Sales of tonic water, which is also enjoyed neat, are just as high: One market analysis company estimated the global market at USD 1.29 billion in 2024, and this is anticipated to rise to USD 1.85 billion within five years,[2] with the largest growth expected in the Asia-Pacific region.
Product developers at beverage companies are always coming up with new flavors in the hope that they will appeal to consumers’ tastes: For example, the market analysts highlight the varieties of “Raspberry Rhubarb”, “Wild Elderflower” and “Damask Rose”, some of which are made with dandelion instead of quinine.[2]

Once the tonic water of choice is placed in the shopping cart and later in the refrigerator, then it’s traditionally mixed with gin: Gin and tonic – the combination of gin, a distilled alcoholic beverage mainly characterized by its juniper note, and tonic water, a carbonated drink with a bitter edge – owes its unique taste to a variety of chemical components. Sugar and organic acids are some of these chemical components that play a significant role since they contribute to the taste profile and sensory experience of the beverage to a large extent. This text shows analysis methods for certain components of tonic water and gin samples, important for manufacturers, test laboratories and consumer protection companies. Precise measuring procedures are necessary to ensure that consumers get a tasty and safe beverage.
Determination of sugars
Sugars are essential ingredients in many drinks, as they not only provide sweetness but also bring a balance to the various flavor components. Gin and tonic can contain different types of sugar such as glucose, fructose and sucrose, each of which has varying levels of sweetness and sensory properties. These sugars not only affect the taste but also the texture and the mouthfeel of the drink. The exact composition and concentration of the sugars can be precisely determined using analytical methods such as high-performance liquid chromatography (HPLC).
In nine of the ten tonic water samples that were tested, sucrose was declared as the sweetener. Only one tonic water gets its sweetness from a combination of fructose and stevia.
Sucrose, also known as granulated sugar, is a disaccharide made up of equal parts of the monosaccharides fructose and glucose. As a result of the low pH value in the tonic water, the sucrose is hydrolyzed into the monosaccharides. That’s why only the monosaccharides fructose and glucose are determined for quantifying sugars in tonic water, the sum of which giving the sucrose content.
The chromatographic determination of sugars presents two challenges. On the one hand, saccharides cannot be separated using conventional reversed-phase HPLC due to their high polarity, and on the other hand, sugars do not have any chromophoric groups, which is why it’s not possible to detect them using UV-Vis.
However, a good alternative to chromatographic reversed-phase separation of sugars is HILIC (hydrophilic interaction chromatography). A polar column with typical reversed-phase solvents such as acetonitrile and water is used for this. The elution strength of the solvents is reversed compared to traditional reversed-phase chromatography. In HILIC, water is the stronger solvent for the elution of substances from the column compared to acetonitrile. The column material mostly consists of modified polymers, and the column material used here is a polymer with functional amino groups.
The RID-20A refractive index detector from Shimadzu is used as an alternative to a UV-Vis detector. This works based on the change in the refractive index between the pure liquid and the analyte. The exact analysis conditions are laid out in Table 1.
| System | Nexera-i |
| Column | Shodex HILICpak VG-50 4E (4.6 mm x 250 mm) |
| Guard column | Shodex HILICpak VG-50G 4A (4.6 mm x 10 mm) |
| Flow rate | 1 mL/min |
| Mobile phase | Water/Acetonitrile 20/80 |
| Column temperature | 40 °C |
| Injection volume | 5 μL |
| Detection | RID-20A (Refractive Index Detection) |
| Run time | 12 minutes |
Standard and sample preparation
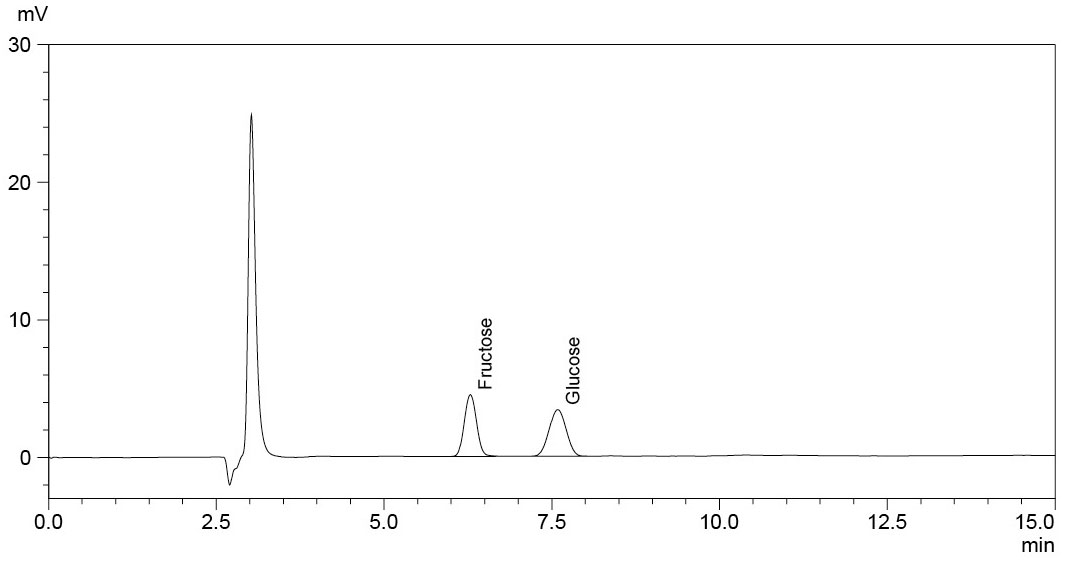
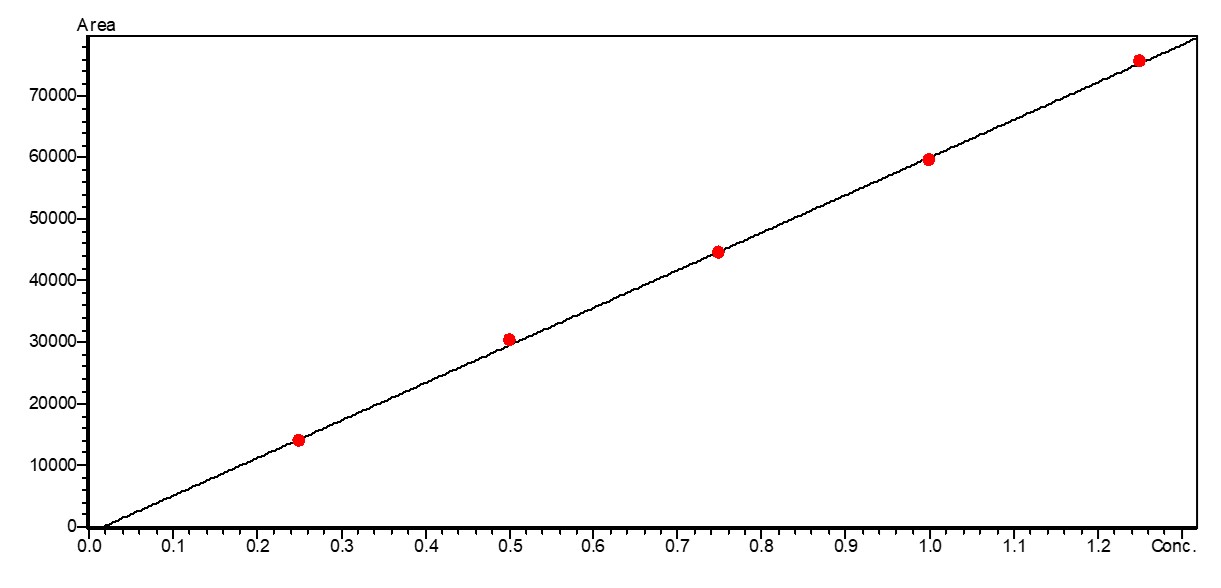
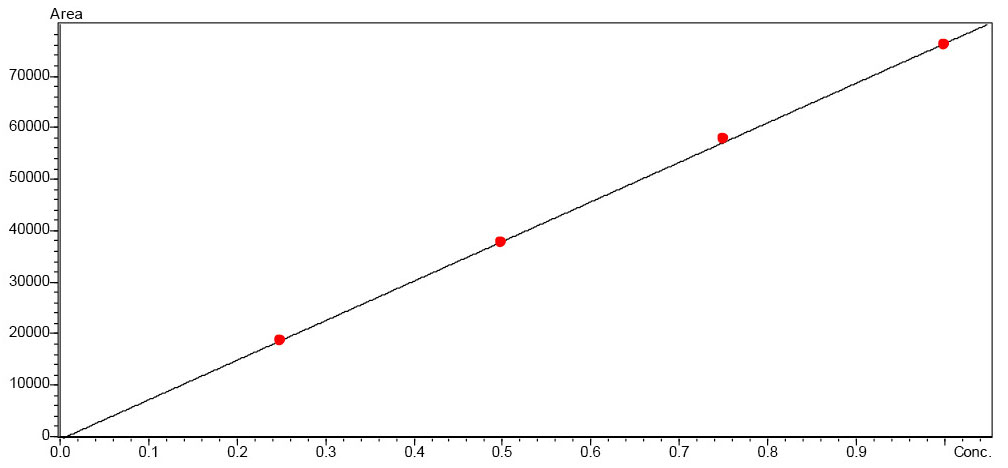
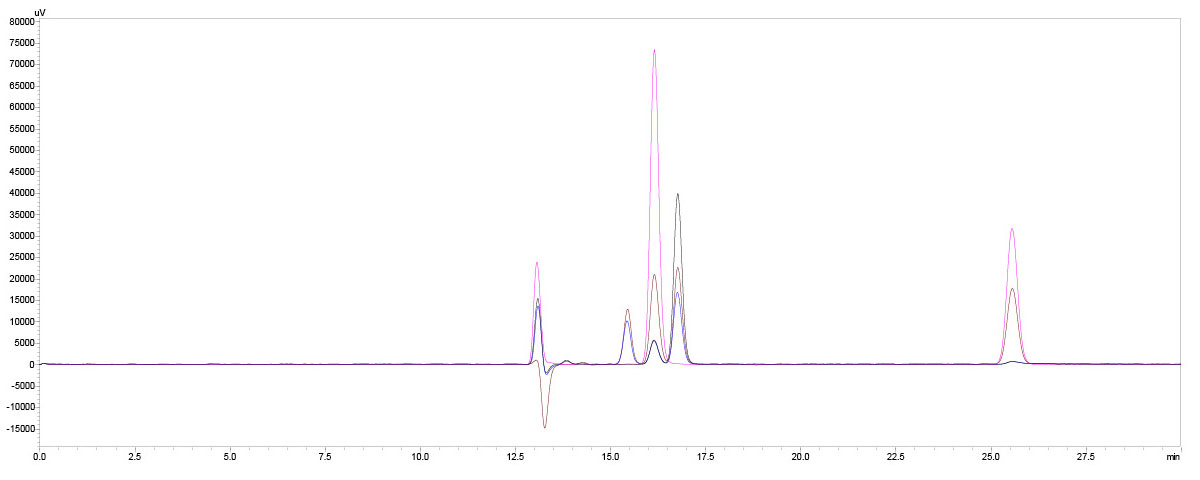
To quantify fructose and glucose, solutions in the concentration range 0.25–1.25 mg/mL and 0.25–1.0 mg/mL respectively were prepared in the mobile phase (Figure 1). The sample solutions were diluted with the mobile phase at a ratio of 1:50.
Results of the sugar determination
The calibration curves of the sugars that were tested, fructose and glucose, are very good with a regression value of R2 > 0.999 (Figures 2 and 3).
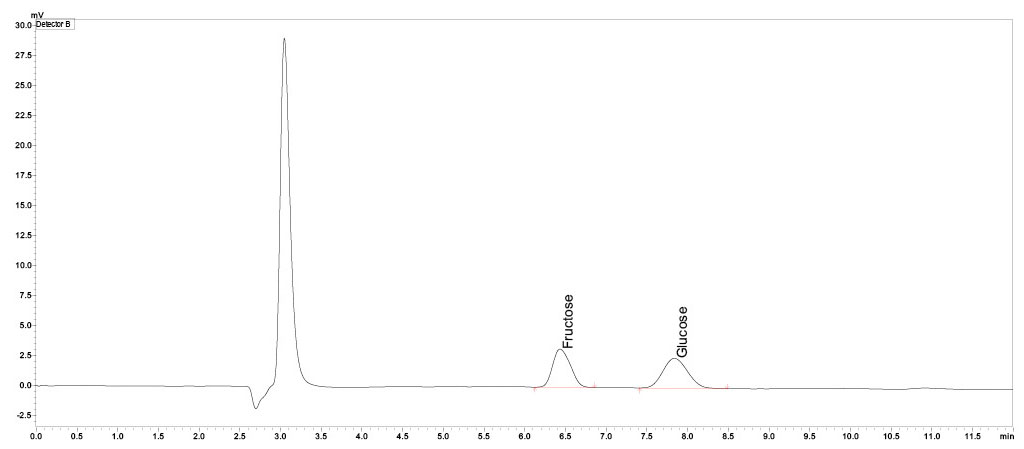
In the nine tonic waters that were declared as containing sucrose, this was also found in the stated quantity. The results all turned out very similar and range between 7.1 and 8.8 g of sucrose per 100 mL tonic water (Figure 4 and Table 2). The tonic water that was sweetened only with fructose contains the same amount of fructose as the other nine tonic waters. These were all sweetened with sucrose, which means they also contain glucose. The lack of sweetness from not using glucose in that tonic water was compensated for by adding stevia instead (content according to LC-MS analysis: 0.1 mg/mL).
Neither fructose nor glucose could be detected in the gin samples.
| Tonic Water | Glucose [g/100 mL] |
Fructose [g/100 mL] |
Sucrose (calculated) [g/100 mL] |
| 1 | 3.7 | 4.5 | 8.2 |
| 2 | 3.3 | 3.9 | 7.1 |
| 3 | 3.4 | 4.1 | 7.4 |
| 4 | – | 4.3 | – |
| 5 | 3.2 | 3.8 | 7.1 |
| 6 | 4.1 | 4.8 | 8.8 |
| 7 | 3.3 | 4.0 | 7.3 |
| 8 | 4.0 | 4.8 | 8.7 |
| 9 | 3.9 | 4.7 | 8.6 |
| 10 | 3.9 | 4.8 | 8.7 |
Organic acids
Organic acids provide the sour taste and freshness of the drink and can regulate the sensation of sweetness and bitterness. The organic acids usually found in gin and tonic are citric acid, malic acid and ascorbic acid. These acids are not only important when it comes to the taste but also play a role in the stability and shelf life of the drink. HPLC analysis makes it possible to precisely determine the concentrations of these acids in samples of tonic water and non-alcoholic gins.
Citric acid was found in all ten tonic water samples tested. This is an organic tricarboxylic acid that belongs to the group of fruit acids. Citric acid fulfills several functions in tonic water, including changing the taste and lowering the pH value, which then reduces the growth of microorganisms.
In two tonic waters, ascorbic acid and malic acid were declared in addition to citric acid. Ascorbic acid is used as an antioxidant in food.
Organic acids are highly hydrophilic compounds that are difficult to determine with the C18 columns often used in HPLC analysis. The disadvantage of organic acids in UV detection is that they only absorb in the non-selective low wavelength range, which can lead to contamination caused by impurities and the absorption of solvents. That’s why ingenuity is needed both when it comes to choosing a solvent and a column and for the detection method in order to perform analyses with high levels of sensitivity and selectivity.
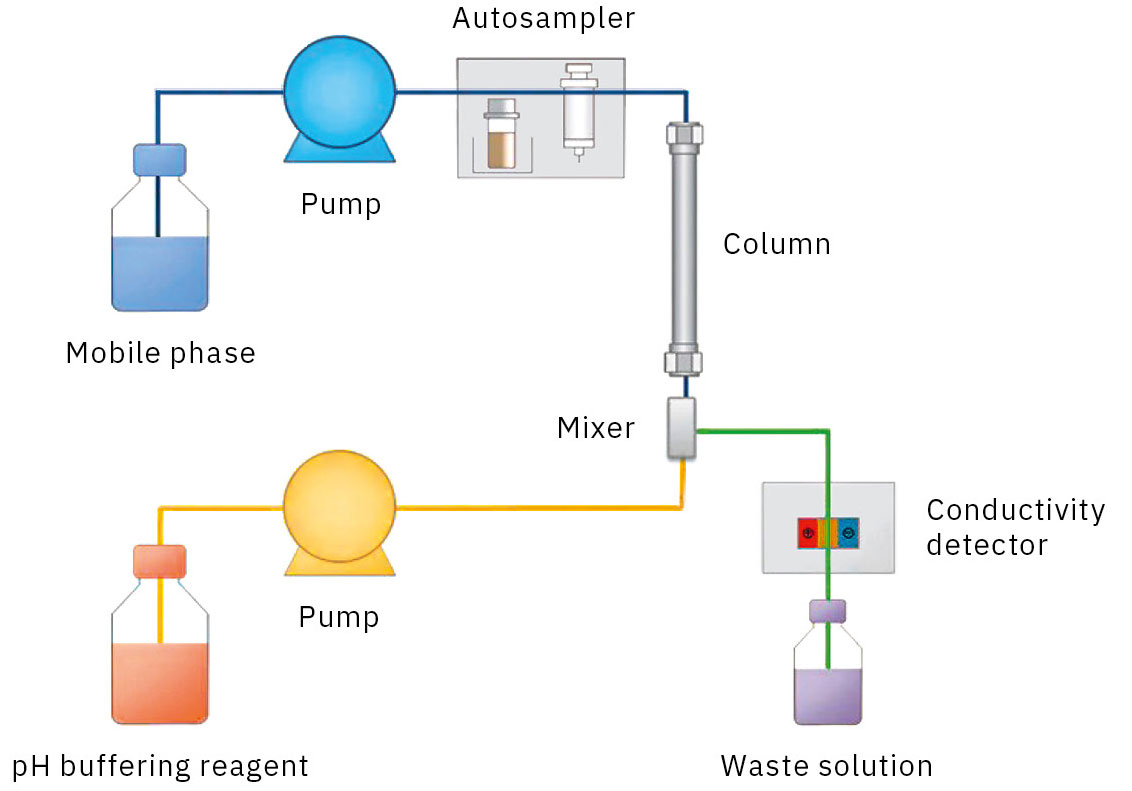
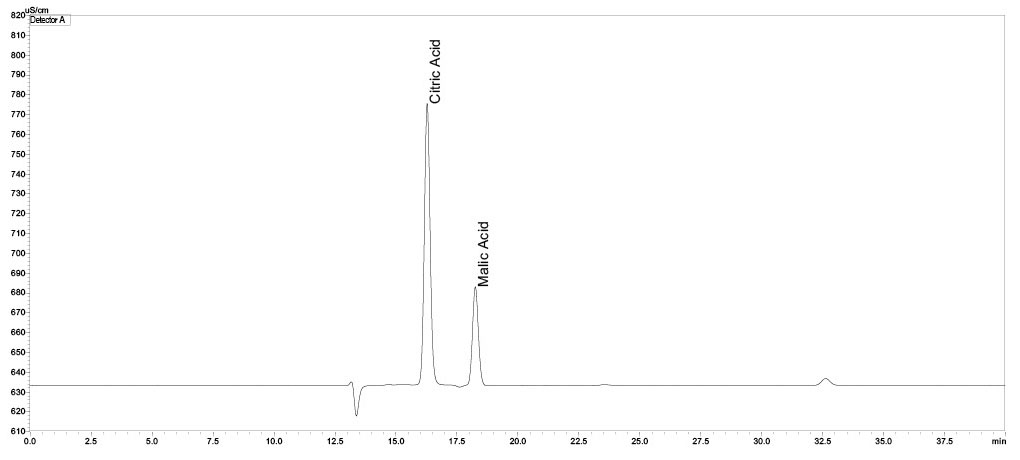
The Nexera organic acids analysis system uses “post-column pH buffering with electrical conductivity detection”. Organic acids are separated by ion exclusion chromatography with an acidic solvent and then mixed with a pH-buffering reagent to increase detection sensitivity (Figure 5). The system is optimized for the analysis of organic acids, and since the retention times are very stable, it’s also possible to provide a qualitative estimation of the organic acids contained in unknown samples (Table 3).
Standard and sample preparation
As the concentration ranges of the organic acids were not known, screening was carried out with all gins and tonic waters. The samples were injected without dilution for this. The acids and concentrations identified in the screening were then used to create calibration curves for quantification.
| System | Nexera Organic Acid Analysis System |
| Column | 2 x Shim-pack SCR-102H (300 mm × 8.0 mm I.D., 7 µm) |
| Guard column | Shim-pack SCR-102H (50 mm × 6.0 mm I.D.) |
| Flow rate | 0.8 mL/min |
| Mobile Phase | 5 mmol/L p-toluene sulfonic acid |
| pH buffer reagent | 5 mmol/L p-toluene sulfonic acid 20 mmol/L bis-tris 1 mmol/L EDTA |
| Column temperature | 40 °C |
| Injection volume | 10 μL |
| Detection | CDD (Conductivity Detection) |
| Tonic Water | Citric acid [g/100 mL] |
Ascorbic acid [g/10 0mL] |
Malic acid [g/100 mL] |
Acetic acid [g/100 mL] |
| 1 | 3.9 | declared but not found | – | found but not declared, approx. 0.1 mg/mL |
| 2 | 3.9 | – | – | – |
| 3 | 3.8 | – | – | – |
| 4 | 5.0 | – | – | – |
| 5 | 3.3 | – | 1.0 | – |
| 6 | 4.4 | – | – | – |
| 7 | 3.9 | – | – | – |
| 8 | 4.2 | – | – | – |
| 9 | 3.9 | – | – | – |
| 10 | 3.9 | – | – | – |
| Alcohol-free Gin | Citric acid [mg/mL] |
Acetic acid [mg/mL] |
Tartaric acid [mg/mL] |
Phosphoric acid [mg/mL] |
| 1 | 0.13 | 0.01 | 0.88 | – |
| 2 | 1.81 | 0.97 | – | – |
| 3 | 0.13 | 0.01 | 0.37 | 0.32 |
Results of the determination of organic acids
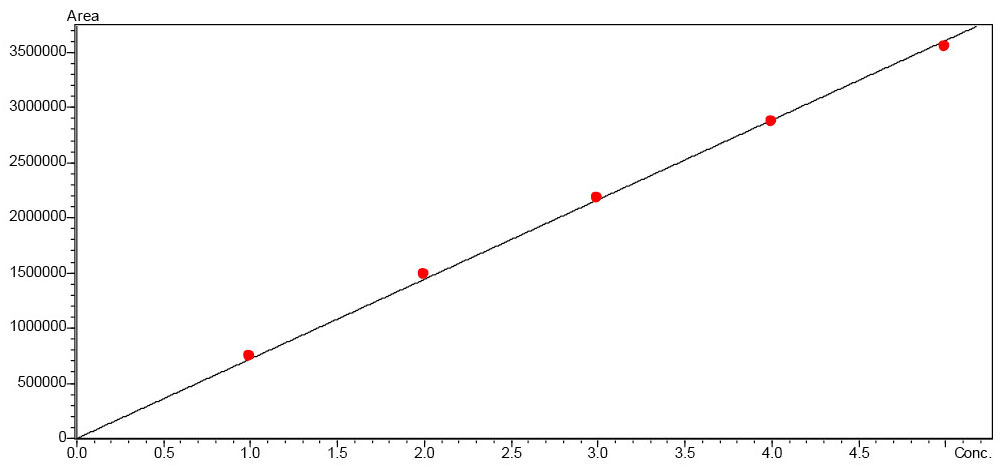
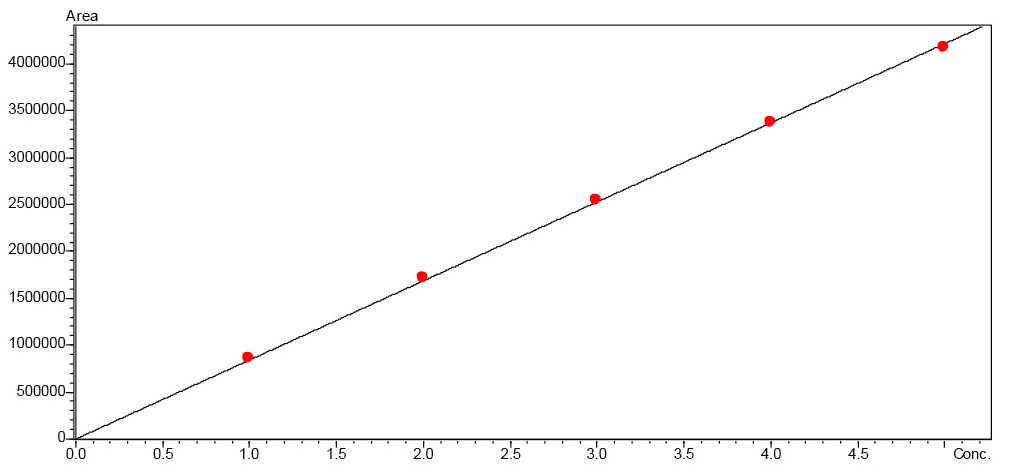
Calibration curves were created for citric acid and malic acid in the range of 1.0–5.0 mg/mL. The calibration curves of the acids that were tested, citric acid and malic acid, are very good with a regression value of R2 > 0.999 (Figures 6 and 7). According to the declaration, all ten tonic water samples contained citric acid (Figure 8), the content of which amounted to between 3.3 and 5.0 mg/mL (Table 4). Ascorbic acid could not be detected in any sample, despite being declared in one sample. Acetic acid was detected instead. Since ascorbic acid is used as an antioxidant, it can be assumed that the ascorbic acid has degraded through oxidation.
In the gin samples, the only significant results were found for the non-alcoholic gin varieties. The acids contained here are citric, acetic, tartaric and phosphoric acid (Figure 9 and Table 5).
Suitable for identification and quantification
The analyses have revealed which specific sugars and acids are present. The only surprise was one of the samples of tonic water: It was supposed to contain ascorbic acid, but this could not be detected. The methods described here – such as HILIC (hydrophilic interaction chromatography) and “post-column pH buffering with electrical conductivity detection” – are obviously suitable for identifying and quantifying sugars and organic acids in beverages.
In the next issue: Analysis of gin samples
The third and final part of the series on the ingredients in a gin and tonic covers other options for analyzing gin and tackles the question of which gin goes best with which tonic water.