Following the scent to scientific discovery
Investigating how the chemical process of heat affects the volatile ingredients of e-cigarettes
Waldemar Weber, Shimadzu Europa GmbH
E-cigarettes have become increasingly popular in recent years. Much testing has been done on the raw ingredients used in creating the vapor produced by e-cigarettes. Less research has been done on what happens to those ingredients through the process of heating. A recent set of experiments using gas chromatography/mass spectrometry (GC/MS) looked into the effects of the heating process on flavor: for instance, how certain chemicals designed to imitate a raspberry flavor might end up tasting like something else after heating.
The result was a clever new method to better understand and predict how to create and maintain better quality control for vaping flavors. Of additional interest, the new method also revealed the outline of a new way to test for consumer safety in the rapidly developing market for e-cigarettes.
Vaping – the use of e-cigarettes – has provoked heated discussion since commercialized electronic cigarettes first appeared over 20 years ago. Proponents have argued that e-cigarettes are a pleasant and effective way for consumers to wean themselves off of tobacco cigarettes. Smoking tobacco, of course, is associated with all manner of health risks, and vaping has been promoted as a healthier alternative, either as a permanent solution or as a stop on the road to complete nicotine abstinence.
At the same time, vaping opponents have argued that the health risks of e-cigarettes have not been adequately tested and that further research needs to be done. That argument continues today, with some countries simply banning vaping, others restricting the use of e-cigarettes, and many others simply allowing them and hoping for the best.

Most of the countries who do allow fairly unrestricted vaping naturally place an age limit on it, and many countries have also conducted safety tests on the individual components involved in the process, such as batteries and the chemicals being used in what they call the “e-liquid”. But clearly, much more testing is required, if we are to ensure that vaping is as safe as it possibly can be.
Fascinated by flavors
Meanwhile, several lab researchers were dealing with a different vaping issue. E-liquids for e-cigarettes are designed to have a specific flavor. E-cigarette flavors generally tend to imitate sweet or fruity flavors, in large part because those flavors appeal to younger consumers – the market of today and tomorrow. But how do you ensure that the flavor of the vapor produced is the same as the flavor promised by the liquid? They began to run tests using the world-class assortment of Shimadzu scientific instrumentation that they had at their disposal.
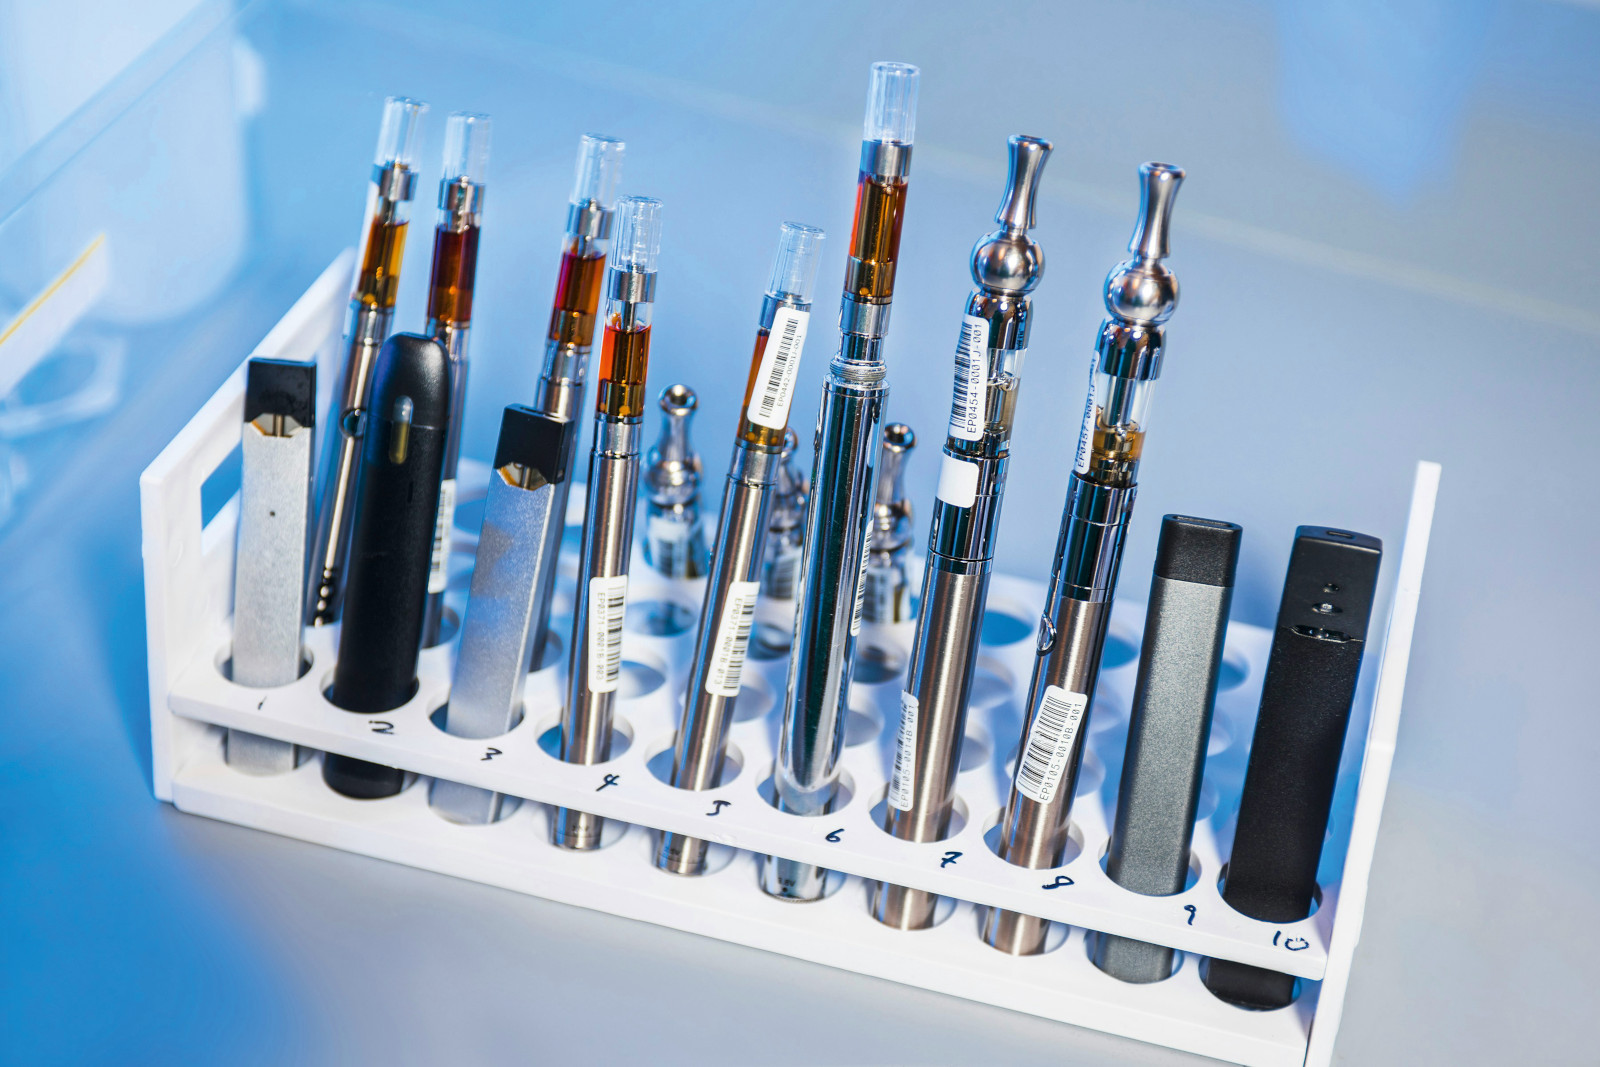
The focus on these tests was not on the chemicals themselves but on the chemical process at the heart of vaping. Basically, vaping uses a power source (usually a battery) to run an atomizer – a heating element – that creates an aerosol of vapor out of e-liquid in a small tank which is then inhaled. Relatively little work has been done on the effects of heating on the base chemicals, and the researcher began to look at how the raw ingredients change through the process of heating the e-liquid.
Taking advantage of state-of-the-art testing equipment
The vaporization ratio of aroma compounds in e-liquids changes with the temperature, since the vapor pressure of each aroma compound is different. Therefore, the flavor of an e-liquid is expected to change depending on the temperature. Gas chromatography/mass spectrometry (GC/MS) analysis is ideal for objectively evaluating the correlation between flavors and aroma compounds.
What eventually became an effective new method started with this experiment: The aroma compounds of the e-liquid were exposed to a simple pretreatment and then analyzed in an environment close to actual use conditions. A flavored e-liquid was employed for the sample, of which 1 mg was directly weighed in a crimp vial for a headspace sampler, using a heat-resistant crimp cap for the vial cap and a highly heat-resistant septum.
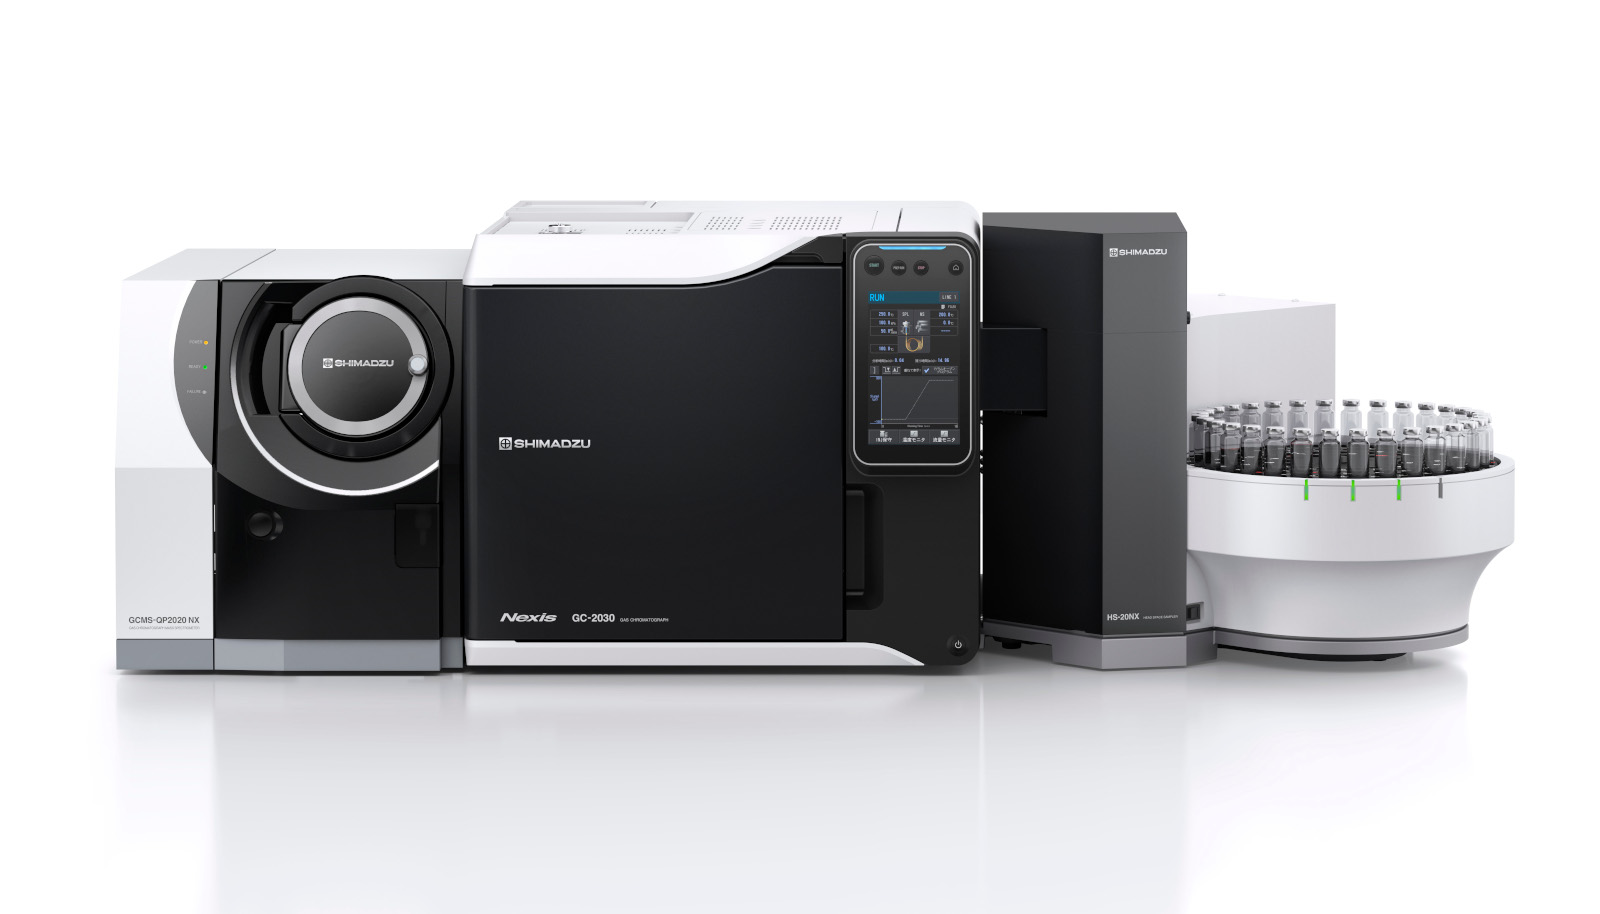
An HS-20 NX headspace sampler was connected to a GCMS-QP2020 NX gas chromatograph/mass spectrometer, and the progress mode of a connected HS-20 NX was selected. Finally, analytical conditions specific to the Smart Aroma Database were used. During batch analysis, the oven temperature was changed step by step by selecting the progress mode, running analyses at 20 °C-increments at temperatures ranging from 150 °C to 270 °C.
Heating things up
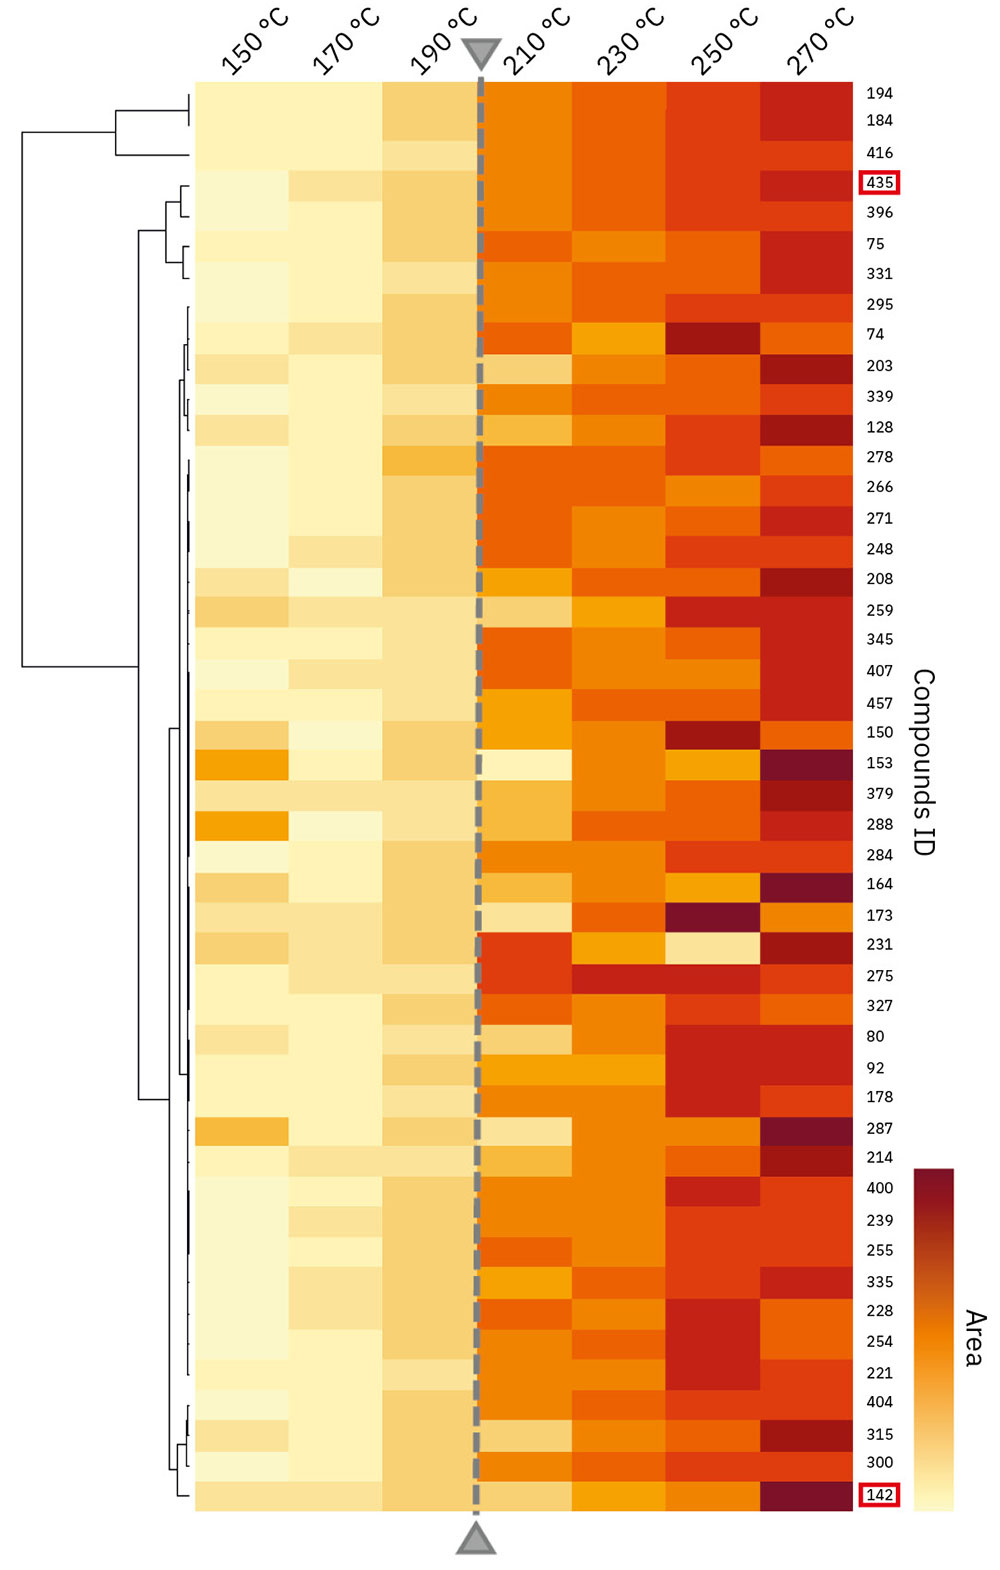
As a result of this, 47 aroma compounds were identified by the Smart Aroma Database. Next, in order to investigate the correlation between the peak area of each aroma compound and the temperature, the area value was standardized, and cluster analysis was performed using the “R” statistical analysis software. The heat map obtained as the result of the cluster analysis is shown in Figure 2. Here, it is apparent that the vapor pressure of e-liquid increases with rising temperature. Therefore, the peak area value in Figure 2 is corrected by the dilution rate with the pressurized gas. The dilution rate by the pressurized gas was calculated based on the measured internal pressure of the vial.
Figure 2 also shows the correlation between the area value of each compound and the oven temperature. As one can see, the correlation can be confirmed at a glance. Overall, it can also be observed that the amount of aroma compounds in the generated gas tends to increase with rising oven temperature. In particular, there is a significant tendency for this to increase from 210 °C. On the other hand, the tendency of the area of aroma compounds to change depends on the variety of compounds when viewed in detail.
Changes in aroma characteristics
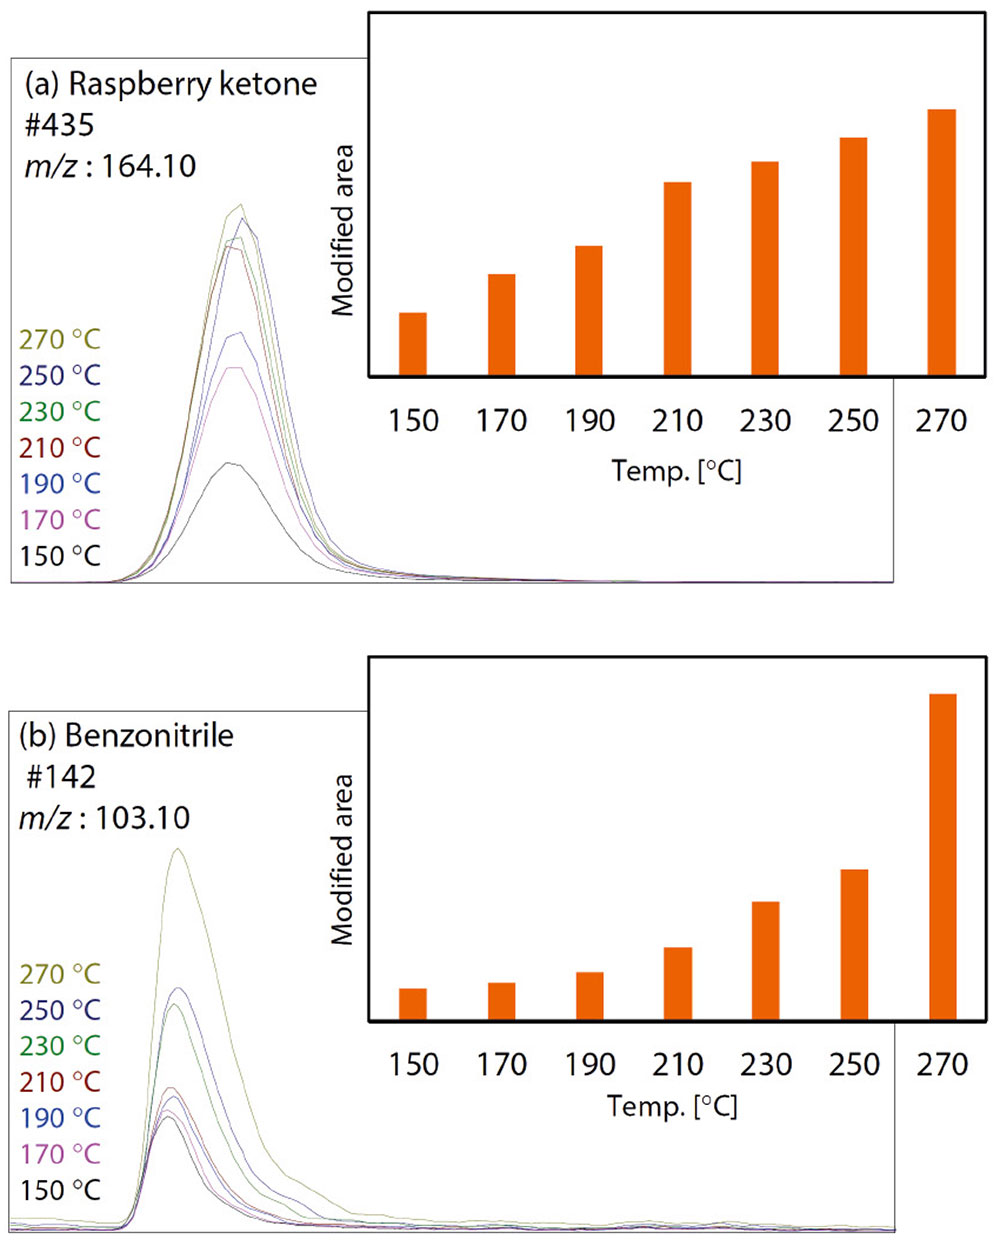
Figure 3 shows the temperature dependence of the quantitative ion peak areas of raspberry ketone and benzonitrile. These two compounds are shown in the red frame in Figure 2. The area values in Figure 3 have been corrected to take into consideration the dilution ratio of the pressurized gas, as in the case of Figure 2. As shown in Figure 3, the peak area of raspberry ketone increases with temperature, but the tendency decreases from around 210 °C. On the other hand, the peak area of benzonitrile does not change much in the low-temperature range, but the peak area value rapidly increases from 250 °C. These results show that the increasing tendencies of the area values of the two compounds are quite different.
The Smart Aroma Database contains sensory information about numerous aroma compounds. According to the sensory information, for example, raspberry ketone smells like raspberry, and benzonitrile smells rancid. From the results shown in Figure 2 and Figure 3, it can be inferred that the raspberry-like scent intensifies until 210 °C, and the rancid smell increases rapidly from around 250 °C.
To sum it all up: Investigating the correlation between aroma compounds of e-liquid vapor and heating temperature using a GCMS-QP2020 NX and an HS-20 NX revealed that, by linking changes in aroma compounds with sensory information, a new method was created that can be applied to improve strategic scent design and evaluation. In addition, it was confirmed that the Smart Aroma Database strongly supports the analysis of e-cigarette aroma compounds, as it includes information on characteristic ions, retention indices and mass spectra for more than 500 aroma compounds. The database also contains sensory information for all of these aroma compounds.
The rest of the story …
As noted, a new method was developed that offers researchers the opportunity for more efficient design and evaluation of e-cigarette aromas and flavors by linking the analysis results of aroma compounds with sensory information. But – even more interestingly – it also points the way towards a better way to test e-cigarettes for safety. Investigating the effects of heating on e-liquids for one thing – aromas – can also be used for investigating another thing: unplanned harmful compounds created by the chemical process of heating. But that, as they say, is another story. Perhaps even one for a future issue of the Secrets of Science.
The science of discovery
This article highlights an important aspect of scientific inquiry. That is, that one thing does truly lead to another. From looking into flavors to improving consumer safety is not necessarily a linear move. Science hops and jumps and sometimes leads from A to Z while bypassing all of the letters in between. Science leads to discovery, and sometimes we discover things that we didn’t even know were there.
Shimadzu salutes the creativity and dedication of scientific researchers everywhere and commits its research to ensuring that laboratories worldwide have the best tools available to follow science –wherever it leads.
The recommended analytical hardware and software are listed below.
Main unit: Nexis GC-2030 with GCMS-QP2020 NX: gas chromatograph plus mass spectrometer detector
Accessory: HS-20 NX headspace sampler
Main consumable: SH-I-5Sil MS
Software: GCMSsolution and GCMS Lab Solutions Insight Software
A picture of the instruments used, including the main unit and the accessory, can be seen in Figure 1.